Inverted Hammer Candlestick Pattern: A Comprehensive Guide

What Is the Inverted Hammer Candlestick?
The inverted hammer candlestick, also referred to as an inverse hammer, is a significant technical pattern that signals the potential end of a downtrend in cryptocurrency markets. When traders identify this candlestick formation on a price chart, it indicates emerging buying pressure that could lead to a price reversal. This pattern serves as an early warning system, suggesting that a bullish reversal may be developing, where buyers begin to overpower sellers and transform a declining trend into an upward trajectory.
Candlestick patterns are essential tools in technical analysis, representing price movements through visual formations that help crypto traders predict future price directions of digital assets. The methodology behind candlestick charting has a rich history, originating from the work of Munehisa Homma, a Japanese rice trader who developed this analytical approach in the 18th century. Over the centuries, this technique has evolved and been adapted across various financial markets. Crypto traders have embraced candlestick charts as a fundamental component of their technical analysis toolkit, using these patterns to forecast potential market movements and make informed trading decisions in the volatile cryptocurrency landscape.
What Does the Inverted Hammer Look Like?
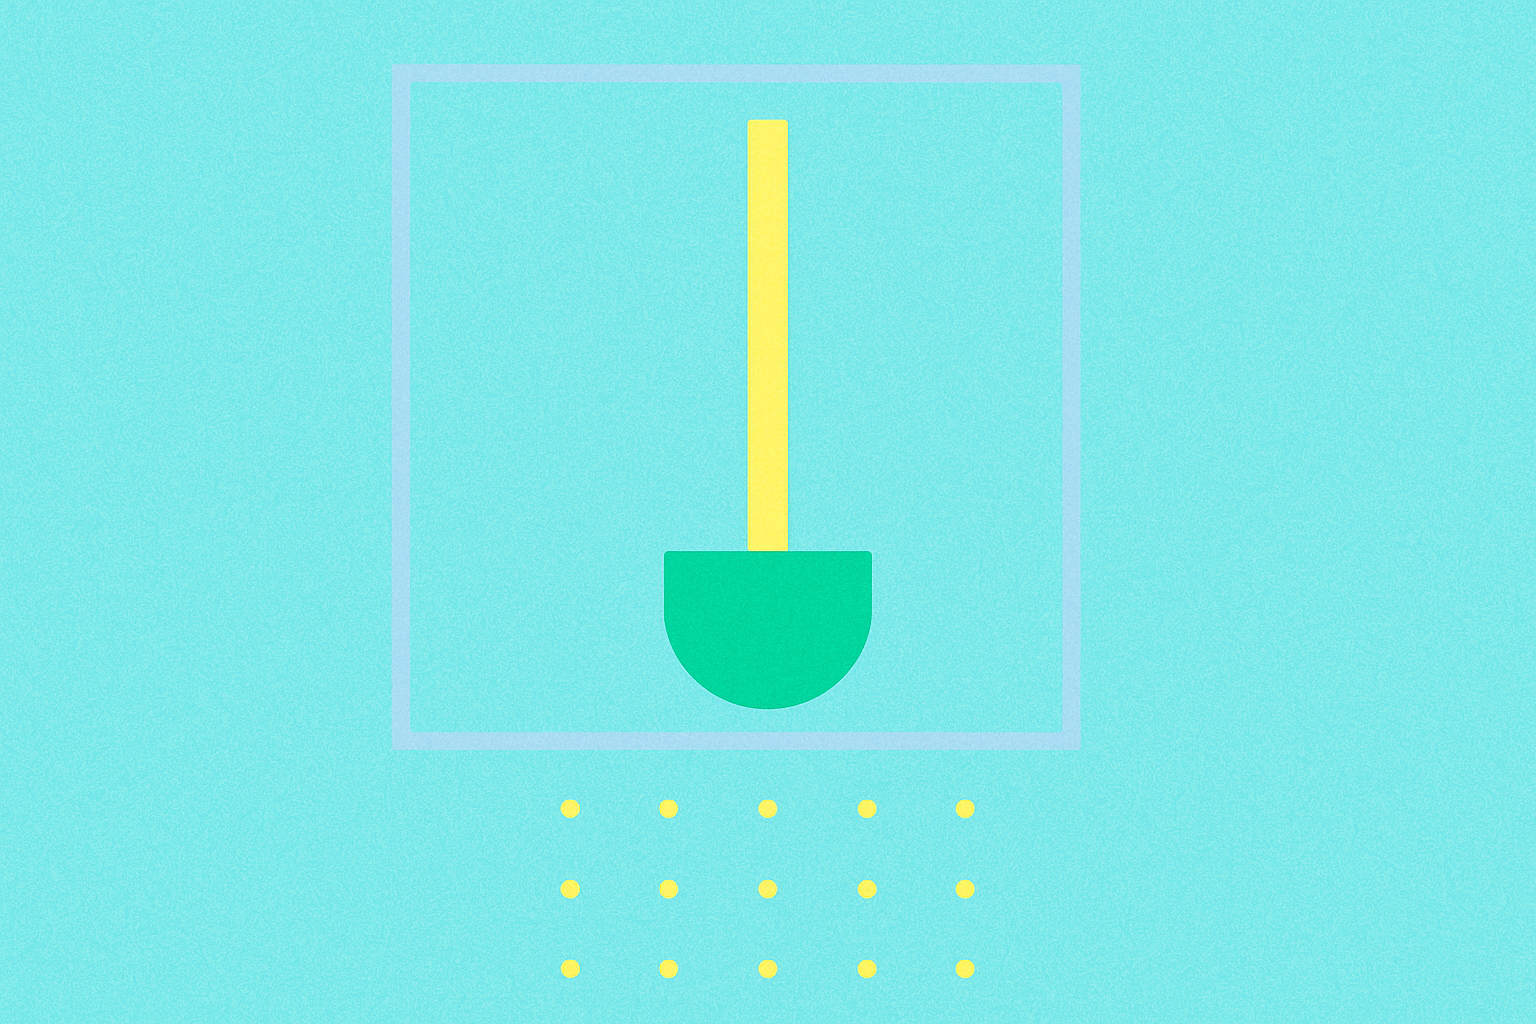
The inverted hammer candlestick has a distinctive appearance that resembles an upside-down hammer or an inverted capital "T" shape. This formation consists of a short body positioned at the lower end of the trading range, accompanied by a long upper wick (also called a shadow) that extends upward. The pattern may or may not include a small lower wick, but when present, it is minimal. The defining characteristic is that the upper wick must be at least twice the length of the real body, creating the unmistakable inverted hammer silhouette.
Understanding the components of a candlestick is crucial for proper pattern recognition:
- Body: This rectangular section represents the price range between the opening and closing prices during the trading period. The body's size indicates the difference between these two key price points.
- Wick (Shadow): These thin lines extending from the body depict the highest and lowest prices reached during the trading session. The upper wick shows how high the price climbed, while the lower wick indicates how low it dropped.
- Color: The candlestick body's color provides immediate visual information about price direction. White or green bodies indicate that the closing price was higher than the opening price (bullish movement). Conversely, black or red bodies signify that the closing price was lower than the opening price (bearish movement).
Green and Red Inverted Hammers
An inverted hammer candlestick can manifest in either green (bullish) or red (bearish) coloration, each carrying slightly different implications for traders.
A green inverted hammer forms when the closing price exceeds the opening price, despite the presence of a long extended upper wick. This configuration suggests that even though sellers pushed prices down during the session (creating the long upper shadow), buyers managed to drive the price back up by the close, resulting in a net positive movement for the period.
In contrast, a red inverted hammer develops when the closing price falls below the opening price, while still maintaining the characteristic long upper wick. This indicates that although buyers attempted to push prices higher during the session, sellers ultimately prevailed, forcing the price to close lower than it opened.
In both scenarios, the proximity of the closing and opening prices creates the compact body that gives the candlestick its distinctive hammer shape. While both colored variations are generally interpreted as bullish reversal signals when appearing at the bottom of a downtrend, a green inverted hammer is considered a stronger bullish indicator than its red counterpart. This is because the green version demonstrates that buyers not only created upward pressure but also managed to close the session with gains, showing greater strength and conviction in the reversal.
How Does an Inverted Hammer Form?
The formation of an inverted hammer is a fascinating process that reflects the psychological battle between bulls and bears in the market. This pattern develops when bullish traders begin to gain confidence after a prolonged downtrend, resulting in the open, low, and close prices clustering very close together at the lower end of the trading range.
The creation of the long upper shadow tells a compelling story of market dynamics. As bullish traders sense an opportunity to reverse the downtrend, they aggressively enter the market, pushing prices significantly higher and creating the extended upper wick. This upward movement demonstrates their determination to establish a new direction. However, bears or short sellers don't surrender easily. They actively resist the price increase, attempting to push prices back down to the opening levels, which creates the small lower wick when present. Despite this bearish resistance, the buying pressure proves strong enough to prevent prices from falling back to the session's lows, and the price ultimately settles at a higher level relative to the trading range.
This price action is interpreted as a bullish signal because it demonstrates that buyers have successfully resisted the continuation of the downward trend through powerful buying pressure. The market's inability to continue declining, combined with the evidence of buyer aggression shown in the long upper wick, suggests a potential shift in market sentiment. Traders pay close attention to the candlestick that appears on the following day, as it provides crucial confirmation. This subsequent candle helps traders determine whether the reversal will materialize into a sustained uptrend or if the downward pressure will resume.
Interestingly, an inverse hammer can also appear during an uptrend, though in this context it carries a different meaning. When this formation occurs at the peak of an upward trend, it is called a "shooting star" and serves as a warning of an impending bearish reversal. The shooting star forms when the prices of open, low, and close are approximately equal, positioned at the top of an uptrend. This configuration indicates that bears have successfully overcome the bulls, pushing the closing price below the opening price and signaling potential downward movement ahead.
Inverted Hammer Formation in Detail
The complete bullish inverse hammer formation is a two-candle pattern that unfolds over consecutive trading sessions. The first day features a tall black or red candle, representing continued bearish momentum in the existing downtrend. On the second day, a short candle with a long upper wick appears, creating the inverted hammer shape. Both candles emerge at the bottom of the trading range, which is crucial for the pattern's bullish interpretation.
On the day the inverted hammer candle appears, the market opens at or near the bottom of the trading range, reflecting the ongoing bearish sentiment. As the session progresses, buyers make their move, attempting to reverse the downtrend by pushing prices higher. However, this upward momentum faces resistance from sellers who are not yet ready to concede control. The resulting tug-of-war causes the asset's price to eventually close near its opening price, creating the short body characteristic of the pattern.
The true confirmation of a potential reversal can only be assessed on the second day following the inverted hammer's appearance. Traders look for the price to open above the body of the inverted hammer candle, which demonstrates that buyers have gained enough strength to push the opening price higher. This confirmation becomes increasingly reliable as the market opens progressively higher above the inverted hammer's body. However, it's essential to remember that no pattern provides absolute certainty in markets, and traders should always use additional confirmation signals and risk management strategies when making trading decisions based on this pattern.
What Does the Inverted Candlestick Hammer Mean?
When an inverted candlestick hammer appears after a prolonged downtrend, it carries significant meaning for traders analyzing market sentiment and potential trend changes. This pattern emergence signals that buyer pressure is beginning to build in the market, serving as an early warning that a bullish reversal could be developing. The short candlestick body is particularly meaningful, as it suggests that asset prices have stabilized after a decline and that sellers are losing their grip on market control.
However, experienced traders understand that the inverted hammer should never be analyzed in isolation. To make well-informed trading decisions, traders must examine the pattern within a broader context, considering multiple factors including other candlestick characteristics, various technical indicators, and the patterns that form in subsequent trading sessions. For example, an exceptionally long upper wick serves as a stronger indicator of bullish reversal potential, as it demonstrates more aggressive buying activity. Similarly, a green inverted hammer carries more bullish implications than a red one, as it shows buyers managed to close the session with gains.
The interpretation of an inverted hammer requires careful consideration of the overall market context and confirmation signals. Traders should evaluate the pattern alongside volume indicators, support and resistance levels, and broader market trends. If multiple indicators align to suggest that an uptrend is likely to develop, traders might consider entering long positions to capitalize on the potential reversal. Conversely, if the inverted hammer appears weak or lacks confirmation from other indicators, suggesting the pattern may fail and the downtrend could resume, traders should exercise caution or consider short positions. This comprehensive analytical approach helps traders avoid false signals and make more accurate predictions about future price movements.
The Pros and Cons of an Inverted Hammer Candlestick
Pros
-
Easy to Identify: The inverse hammer possesses a highly distinctive visual appearance that makes it straightforward to recognize on price charts. Its characteristic shape of an upside-down hammer, combined with its tendency to appear at the bottom of trading ranges during downtrends, makes it one of the more accessible patterns for traders to spot. This simplicity makes the inverted hammer particularly beginner-friendly, allowing new traders to incorporate it into their technical analysis without extensive experience in pattern recognition.
-
Multiple Entry Points for Investors: The inverse hammer provides traders with flexibility in timing their market entries. Investors can choose to enter positions at different stages of the potential reversal, either at the very start of the uptrend when the pattern first confirms, or later when the uptrend has gained momentum and shows stronger signs of continuation. This flexibility allows traders to match their entry strategy with their risk tolerance and trading style, whether they prefer early entry with higher risk and reward potential, or more conservative entry after additional confirmation.
Cons
-
Potentially Short-Lived Indicator: One significant limitation of the inverse hammer is that it may represent only a temporary pause in the downtrend rather than a genuine long-term reversal. The pattern can sometimes result in a brief price bounce that quickly fails, with the downtrend resuming shortly after. This temporary nature means traders must exercise caution and avoid assuming the pattern guarantees a sustained trend change. It's crucial to wait for confirmation from subsequent price action and other technical indicators before committing significant capital based solely on the inverted hammer pattern.
-
Requires Complementary Analysis: The inverse hammer cannot serve as a standalone trading signal for making informed decisions. Traders must incorporate multiple technical indicators, volume analysis, and other candlestick patterns to validate the signal provided by the inverted hammer. Relying exclusively on this single pattern increases the risk of false signals and poor trading outcomes. Successful traders typically combine the inverted hammer with tools such as moving averages, RSI, MACD, volume indicators, and support/resistance levels to build a comprehensive view of market conditions before executing trades. This multi-faceted approach significantly improves the accuracy of trade decisions and helps filter out unreliable signals.
Why Traders Should Know the Inverted Hammer
The inverted hammer candlestick represents a valuable pattern that crypto traders can leverage to make informed decisions about establishing, selling, or buying positions in the market. Its relatively straightforward visual identification makes it accessible to traders at all experience levels, including beginners who are just starting to learn technical analysis. The pattern's clear structure and well-defined characteristics allow new traders to quickly grasp its significance and incorporate it into their trading strategies.
However, it's essential to understand that effective trading requires a holistic approach that considers multiple dimensions of market analysis. Successful traders recognize that making decisions based solely on the inverted hammer pattern is not advisable and can lead to poor outcomes. Instead, the pattern should be viewed as one component within a comprehensive analytical framework that includes various factors and trading signals.
This comprehensive approach should incorporate technical analysis elements such as trend lines, support and resistance levels, volume indicators, and momentum oscillators. Additionally, traders should consider chart patterns beyond just candlesticks, including triangles, head and shoulders, and double tops or bottoms. Equally important are sentimental factors, which reflect the overall mood and psychology of market participants. These can be assessed through sentiment indicators, social media analysis, and news flow.
By combining the inverted hammer signal with these multiple analytical tools, traders can develop a more accurate understanding of market conditions and make more confident trading decisions. This multi-faceted approach helps filter out false signals, improves timing of entries and exits, and ultimately leads to more consistent trading results in the dynamic and often unpredictable cryptocurrency markets.
FAQ
What is an Inverted Hammer Candlestick Pattern and what are its formation conditions?
An Inverted Hammer is a bullish reversal pattern forming when open, low, and close prices are nearly identical, with an upper shadow at least twice the body size. It signals market rejection of lower prices and potential upward momentum ahead.
How to identify and trade the inverted hammer candlestick pattern?
Identify inverted hammer by its long upper wick at least twice the body size with minimal lower wick, forming in uptrends. Trade by entering when price breaks above the upper wick, confirming reversal strength through increased trading volume.
How high is the trading accuracy and success rate of the Inverted Hammer Candlestick Pattern?
The Inverted Hammer pattern shows strong trading accuracy with success rates typically exceeding 60%, especially when used at reversal points. Accuracy depends on subsequent market behavior and confirmation from other technical indicators.
What is the difference between an Inverted Hammer and a Hammer candlestick?
The main difference lies in position and market context. A Hammer appears at bottoms with a small body and long lower wick, signaling potential upward reversal. An Inverted Hammer appears at tops with a small body and long upper wick, suggesting possible downward continuation or reversal.
How does the inverted hammer candlestick pattern perform on different timeframes(daily, weekly, monthly)?
On daily charts, inverted hammer signals potential bullish reversal at support levels. On weekly charts, it indicates stronger reversal signals with longer-term implications. On monthly charts, it represents significant trend changes with greater reliability for long-term price reversals.
How should stop loss and take profit be set after an Inverted Hammer Candlestick Pattern appears?
Set stop loss below the pattern's lowest point. Place take profit at your target resistance level. Adjust both based on market volatility and support/resistance levels for optimal risk management.
How to use Inverted Hammer Candlestick Pattern with other technical indicators such as support/resistance levels and moving averages?
Combine Inverted Hammer patterns with support/resistance levels and moving averages to confirm trend reversals. Use RSI or MACD for additional confirmation, improving trading accuracy and signal reliability.
Share
Content
How to Buy Cryptocurrency


Trending Cryptocurrencies


How to Withdraw Money from Crypto Exchanges in 2025: A Beginner's Guide

Hedera Hashgraph (HBAR): Founders, Technology, and Price Outlook to 2030

Jasmy Coin: A Japanese Crypto Tale of Ambition, Hype, and Hope

IOTA (MIOTA) – From Tangle Origins to 2025 Price Outlook
Bitcoin Price in 2025: Analysis and Market Trends

How to Trade Bitcoin in 2025: A Beginner's Guide
Everything About the Correlation Between Global M2 Money Supply and Bitcoin

Pepe Coin: Roadmap and Tokenomics

Comprehensive Guide to Chart Patterns

Everything About Real-World Asset Tokens

Best Crypto Wallets 2025: A Review of Leading Choices