GraphAI (GAI) is an AI-native data layer for Web3 that transforms blockchain events into queryable knowledge graphs, currently trading at $0.01809 with a $1.27 million market cap as of February 2026. This comprehensive analysis examines GAI's investment viability through multiple dimensions: historical performance shows significant volatility from $0.5078 peak to $0.0164 low, price forecasts range from $0.0124-$0.0230 short-term to $0.0262-$0.0332 long-term through 2030, and technical integration with Base and Ethereum ecosystems provides infrastructure potential. Key investment considerations include limited liquidity ($15,589.92 daily volume), early-stage adoption (7,301 holders), and regulatory uncertainties surrounding AI-blockchain projects. Risk management strategies recommend conservative allocation of 1-3% for beginners, with emphasis on diversification and secure storage, while acknowledging substantial downside risks inherent to emerging crypto assets.
Introduction: GraphAI (GAI)'s Investment Position and Market Outlook
GraphAI (GAI) represents a notable asset in the cryptocurrency sector, launched in 2025 with a focus on building an AI-native data layer for Web3. As of February 2, 2026, GAI maintains a market capitalization of approximately $1.27 million, with a circulating supply of 70 million tokens and a current price around $0.01809. Positioned as the connective infrastructure between blockchain and artificial intelligence, GraphAI has established integrations with ecosystems including Base, Ethereum, and the Artificial Superintelligence Alliance. The project's flagship product, GraphEngine, facilitates subgraph creation, querying, and analysis by transforming raw blockchain events into structured, queryable knowledge graphs. With 7,301 holders and a fully diluted market cap of $1.81 million, GAI has become a subject of interest for investors evaluating "Is GraphAI (GAI) a good investment?" This article provides a comprehensive analysis of GAI's investment value, historical price movements, future price projections, and associated investment risks to serve as a reference for potential investors.
I. GraphAI (GAI) Price History Review and Current Investment Value
-
2025: GraphAI (GAI) token launched on January 17, 2025, with an initial offering price of $0.448. Following the launch, the token experienced notable price appreciation, with trading activity concentrated on a single exchange platform during the early phase.
-
September 2025: GAI reached a notable price level of $0.5078 on September 16, 2025, representing growth from its launch price. This movement occurred during a period when the project was establishing integrations with Base, Ethereum, and the Artificial Superintelligence Alliance ecosystems.
-
Late 2025 to Early 2026: The token entered a period of downward price adjustment, declining to $0.0164 on January 31, 2026. This movement reflected broader market volatility and adjustment patterns common in newly launched crypto assets.
Current GAI Investment Market Status (February 2026)
-
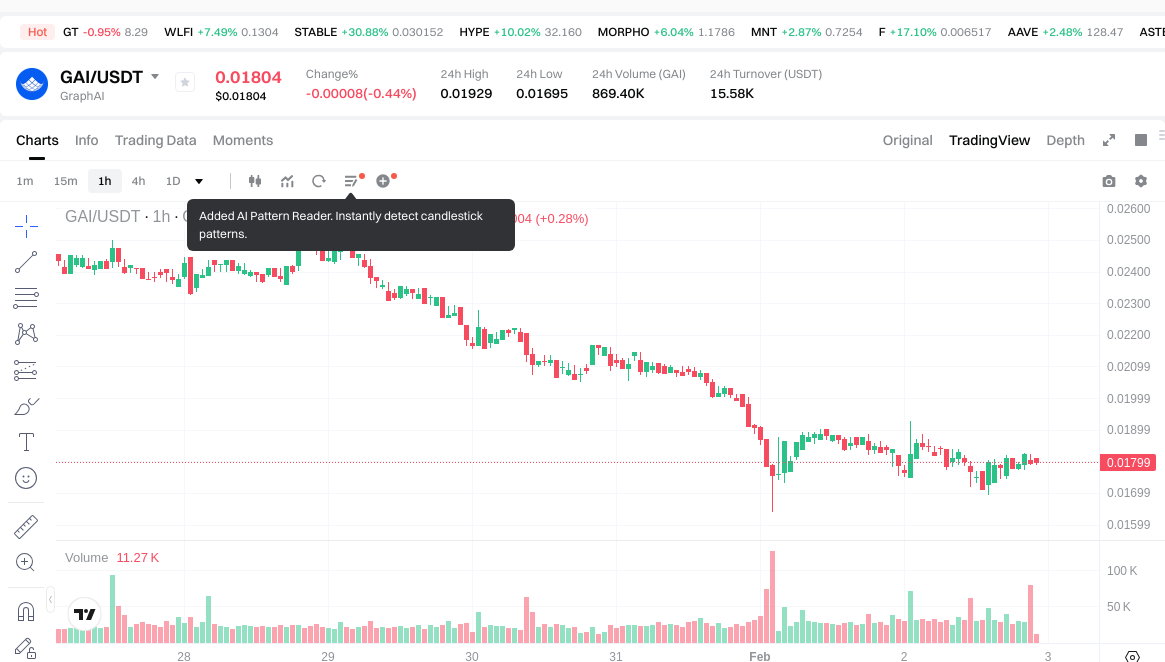
Current Price: As of February 2, 2026, GAI is trading at $0.01809, showing a 24-hour change of -1.14%, with an hourly increase of 0.33%.
-
Trading Metrics: The 24-hour trading volume stands at $15,589.92, with price ranging between $0.01695 and $0.01929 during this period.
-
Market Capitalization: GAI currently holds a market capitalization of approximately $1.27 million, with a circulating supply of 70 million tokens out of a maximum supply of 100 million tokens. The circulating supply represents 70% of the total token allocation.
-
Holder Distribution: The token has attracted approximately 7,301 holders since its launch, indicating a developing community base across the Base blockchain ecosystem.
Click to view real-time GAI market price
-
Short-term Movement: The token has shown a 7-day decline of -25.77% and a 30-day decrease of -48.97%, reflecting recent market adjustment patterns.
-
Year-over-Year Performance: Since its initial trading period, GAI has demonstrated a year-to-date change of approximately 1,809.99%, calculated from early trading benchmarks.
-
Market Position: GAI ranks #2,350 among tracked crypto assets, with a market share of 0.000066% in the overall crypto market landscape as of the current reporting period.
II. Core Factors Affecting Whether GAI Is a Good Investment
Supply Mechanism and Scarcity (GAI Investment Scarcity)
- GraphAI (GAI) implements a fixed supply mechanism with a maximum supply of 100,000,000 tokens, of which 70,000,000 tokens (70%) are currently in circulation. This supply structure creates a defined scarcity model that may influence price dynamics and investment considerations.
- The token's circulating supply ratio stands at 70%, with the fully diluted market cap at $1,809,000 compared to the current market cap of $1,266,300, indicating that 30% of tokens remain unvested or locked.
- The finite supply design represents a structural element that investors typically consider when evaluating long-term value propositions in digital assets.
Institutional Investment and Mainstream Adoption (Institutional Investment in GAI)
- GraphAI has established integrations with several blockchain ecosystems including Base, Ethereum, and the Artificial Superintelligence Alliance, positioning itself as infrastructure connecting blockchain and AI domains.
- The project's flagship product, GraphEngine, enables subgraph creation, querying, and analysis at scale, targeting applications, agents, and enterprise users who require structured blockchain data access.
- With 7,301 token holders as of February 2026, the project demonstrates a growing user base, though this represents a relatively early-stage adoption level in the broader cryptocurrency market.
Macroeconomic Environment's Impact on GAI Investment
- As a digital asset operating within the Web3 and AI data infrastructure sector, GAI's investment characteristics may be influenced by broader market conditions affecting technology assets and cryptocurrency adoption.
- The token's performance occurs within the context of evolving regulatory frameworks for digital assets and AI technologies, which may affect market sentiment and institutional participation.
- Market volatility indicators show GAI experienced price movements with a 24-hour change of -1.14%, 7-day change of -25.77%, and 30-day change of -48.97%, reflecting sensitivity to market conditions typical of emerging digital assets.
Technology and Ecosystem Development (Technology & Ecosystem for GAI Investment)
- GraphAI's core technology transforms raw blockchain events into structured, queryable knowledge graphs, combining real-time on-chain data with off-chain intelligence to provide contextual insights accessible through natural language interfaces.
- The $GAI token serves functional roles within the network including indexing, querying, curation, and staking mechanisms, creating utility-driven demand dynamics within the platform's operational framework.
- The project's positioning as an AI-native data layer for Web3 addresses the infrastructure need for structured blockchain data, with applications spanning DeFi analytics, blockchain intelligence, and AI-powered data services.
III. GAI Future Investment Forecast and Price Outlook (Is GraphAI(GAI) worth investing in 2026-2030)
Short-term Investment Forecast (2026, short-term GAI investment outlook)
- Conservative Forecast: $0.0124 - $0.0180
- Neutral Forecast: $0.0180 - $0.0200
- Optimistic Forecast: $0.0200 - $0.0230
Mid-term Investment Outlook (2027-2028, mid-term GraphAI(GAI) investment forecast)
-
Market Stage Expectation: The project may enter a phase of gradual ecosystem expansion, with potential growth driven by integrations with Base, Ethereum, and AI-related platforms. The AI-native data layer infrastructure could attract increased developer and enterprise adoption.
-
Investment Return Forecast:
- 2027: $0.0161 - $0.0230
- 2028: $0.0170 - $0.0262
-
Key Catalysts: Expansion of GraphEngine adoption, strategic partnerships with major blockchain ecosystems, growth in demand for AI-accessible on-chain data analytics, and broader Web3 infrastructure development.
Long-term Investment Outlook (Is GAI a good long-term investment?)
- Baseline Scenario: $0.0136 - $0.0262 (assuming steady development of AI-Web3 infrastructure and moderate market adoption)
- Optimistic Scenario: $0.0262 - $0.0332 (assuming accelerated adoption of AI-driven blockchain data solutions and favorable market conditions)
- Risk Scenario: $0.0124 - $0.0161 (under conditions of delayed ecosystem growth, increased competition, or adverse market sentiment)
For long-term investment analysis and price forecasts for GAI: Price Prediction
2026-2030 Long-term Outlook
- Baseline Scenario: $0.0136 - $0.0262 (corresponding to steady progress and gradual mainstream application growth)
- Optimistic Scenario: $0.0262 - $0.0332 (corresponding to large-scale adoption and favorable market environment)
- Transformative Scenario: Above $0.0332 (in case of breakthrough ecosystem developments and mainstream adoption)
- Predicted High by December 31, 2030: $0.0332 (based on optimistic development assumptions)
Disclaimer: Price forecasts are subject to market volatility and uncertainty. Historical performance does not guarantee future results. Investors should conduct independent research and consider their risk tolerance before making investment decisions.
| Year |
Predicted High Price |
Predicted Average Price |
Predicted Low Price |
Price Change |
| 2026 |
0.0199689 |
0.01799 |
0.0124131 |
0 |
| 2027 |
0.0229651345 |
0.01897945 |
0.0161325325 |
4 |
| 2028 |
0.0262153653125 |
0.02097229225 |
0.0169875567225 |
15 |
| 2029 |
0.028784471113125 |
0.02359382878125 |
0.016751618434687 |
30 |
| 2030 |
0.033260220432928 |
0.026189149947187 |
0.013618357972537 |
44 |
| 2031 |
0.032102660005262 |
0.029724685190057 |
0.025563229263449 |
64 |
IV. GraphAI Investment Strategy and Risk Management (How to invest in GraphAI)
Investment Methodology (GraphAI investment strategy)
Long-term Holding (HODL GraphAI)
For conservative investors seeking steady exposure to the AI-native data infrastructure sector, a long-term holding strategy may be considered. This approach involves accumulating GAI tokens during market corrections and maintaining positions through market cycles, with a focus on the project's fundamental development rather than short-term price movements. The strategy assumes belief in GraphAI's vision of bridging blockchain and AI ecosystems through structured knowledge graphs.
Active Trading
Traders utilizing technical analysis may observe GAI's price patterns within established ranges. With a 24-hour high of $0.01929 and low of $0.01695 as of February 02, 2026, active participants might identify potential entry and exit points based on support and resistance levels. This approach requires continuous monitoring of trading volumes, which stood at $15,589.92 in 24-hour volume, and correlation with broader market trends in both blockchain and AI sectors.
Risk Management (Risk management for GraphAI investment)
Asset Allocation Ratios
- Conservative Investors: May consider allocating 1-3% of their crypto portfolio to GAI, treating it as a speculative position within a diversified digital asset strategy
- Aggressive Investors: Could allocate 5-10% to GAI as part of a higher-risk, higher-potential-reward approach focused on emerging AI-blockchain infrastructure projects
- Professional Investors: Might implement dynamic allocation models ranging from 2-8% based on technical indicators, market sentiment, and project milestone achievements
Risk Hedging Approaches
- Multi-asset Portfolio Construction: Combining GAI holdings with established cryptocurrencies, stablecoins, and traditional assets to reduce concentration risk
- Diversification Within Crypto Sectors: Balancing GAI exposure with positions in other blockchain infrastructure, AI tokens, and DeFi protocols
- Hedging Instruments: Consideration of stop-loss orders and position sizing strategies to manage downside exposure
Secure Storage Solutions
- Cold Wallet Storage: Hardware wallets supporting BASE network tokens for long-term holdings disconnected from internet exposure
- Hot Wallet Management: Secure software wallets for active trading positions, with regular security audits and two-factor authentication
- Hardware Wallet Recommendations: Devices compatible with BASE network infrastructure, ensuring proper backup of recovery phrases in multiple secure physical locations
V. GraphAI Investment Risks and Challenges (Risks of investing in GraphAI)
Market Risks
High Volatility Characteristics
GAI has demonstrated substantial price fluctuations, with a 7-day decline of 25.77% and a 30-day decrease of 48.97% as of February 02, 2026. The token's price range from an all-time high of $0.5078 (September 16, 2025) to an all-time low of $0.0164 (January 31, 2026) illustrates the extreme volatility inherent in early-stage crypto projects. These swings may result from limited liquidity, market sentiment shifts, or broader crypto market dynamics.
Liquidity Considerations
With a circulating market cap of approximately $1.27 million and 24-hour trading volume of $15,589.92, GAI exhibits relatively modest liquidity compared to established cryptocurrencies. This limited liquidity profile may contribute to wider bid-ask spreads and increased price sensitivity to individual trades, potentially affecting execution quality for larger position sizes.
Regulatory Risks
Policy Uncertainty Across Jurisdictions
The intersection of AI, blockchain, and data infrastructure places GraphAI within multiple evolving regulatory frameworks. Different countries maintain varying approaches to cryptocurrency classification, AI governance, and data handling requirements. Changes in regulatory stances toward crypto assets, particularly those combining AI and blockchain technologies, could impact GAI's accessibility, usage scenarios, or operational parameters.
Compliance Evolution
As regulatory frameworks for crypto-AI hybrid projects continue to develop, GraphAI may face adaptation requirements related to token classification, data processing standards, or cross-border operations. The project's integration with ecosystems like Base and Ethereum exposes it to regulatory considerations affecting these underlying networks.
Technical Risks
Network Security Considerations
As a data layer bridging blockchain and AI systems, GraphAI's infrastructure faces multi-dimensional security challenges. Potential vulnerabilities could emerge from smart contract code, indexing mechanisms, query processing systems, or integration points with external blockchain networks. The project's reliance on BASE network infrastructure also creates dependency on the underlying chain's security model.
Upgrade and Development Risks
The technical roadmap for GraphEngine and related infrastructure involves ongoing development and potential protocol upgrades. Implementation challenges, unexpected bugs, or delays in delivering planned features could affect user adoption and token utility. The complexity of maintaining real-time blockchain data indexing while ensuring query accuracy presents continuous technical challenges.
Integration Dependencies
GraphAI's positioning as "connective tissue" between blockchain and AI creates dependencies on multiple external ecosystems including Base, Ethereum, and the Artificial Superintelligence Alliance. Changes, disruptions, or competitive dynamics within these partner ecosystems could influence GraphAI's operational environment and strategic positioning.
VI. Conclusion: Is GraphAI a Good Investment?
Investment Value Summary
GraphAI represents exposure to the emerging intersection of blockchain infrastructure and artificial intelligence through its AI-native data layer approach. The project's focus on transforming raw blockchain data into queryable knowledge graphs addresses a potential infrastructure need as Web3 applications increasingly incorporate AI capabilities. However, as of February 02, 2026, GAI has experienced considerable short-term price volatility, with notable declines over 7-day (−25.77%) and 30-day (−48.97%) periods, reflecting early-stage market dynamics and broader crypto market conditions.
The token's relatively small market cap of $1.27 million and modest daily trading volume suggest an early-stage project with corresponding liquidity characteristics. With 70% of maximum supply in circulation and trading availability on limited exchanges, GAI exhibits the typical profile of an emerging crypto asset with both potential growth scenarios and substantial risk factors.
Investor Recommendations
✅ Beginner Investors
For those new to cryptocurrency markets, if considering exposure to GraphAI, a dollar-cost averaging approach with very small position sizes may help manage volatility risk. Secure storage using reputable wallets compatible with BASE network tokens should be prioritized. Educational focus on understanding both blockchain infrastructure and AI integration concepts is recommended before making allocation decisions.
✅ Experienced Investors
Those familiar with crypto market dynamics might evaluate GAI within a broader portfolio context, potentially employing tactical allocation strategies based on technical indicators and project development milestones. Portfolio diversification across multiple blockchain infrastructure and AI-related projects could help manage concentration risk. Regular monitoring of GraphAI's ecosystem developments, partnership progress, and competitive positioning may inform position adjustments.
✅ Institutional Investors
Institutional participants assessing the AI-blockchain infrastructure sector might consider GraphAI as part of thematic exposure strategies, subject to thorough due diligence on technical architecture, team credentials, and tokenomics models. Strategic allocation decisions would typically involve evaluation against competing protocols, assessment of total addressable market potential, and alignment with broader investment theses around Web3 data infrastructure evolution.
⚠️ Important Notice
Cryptocurrency investments involve substantial risk, including potential loss of principal. GAI's price history, liquidity profile, and early-stage status indicate elevated risk characteristics. This analysis is provided for informational purposes only and does not constitute investment advice, financial guidance, or a recommendation to buy, sell, or hold any cryptocurrency. Prospective investors should conduct independent research, assess personal risk tolerance, and consider consultation with qualified financial advisors before making investment decisions.
VII. FAQ
Q1: What is GraphAI (GAI) and what makes it different from other blockchain projects?
GraphAI is an AI-native data layer for Web3 that transforms raw blockchain events into structured, queryable knowledge graphs. Unlike traditional blockchain indexing solutions, GraphAI specifically bridges blockchain and artificial intelligence by combining real-time on-chain data with off-chain intelligence, accessible through natural language interfaces. The project's flagship product, GraphEngine, enables applications, agents, and enterprises to create subgraphs, perform queries, and conduct analysis at scale across ecosystems including Base, Ethereum, and the Artificial Superintelligence Alliance.
Q2: How has GAI performed since its launch in January 2025?
GAI launched on January 17, 2025, at an initial offering price of $0.448 and reached a peak of $0.5078 on September 16, 2025. However, the token has experienced significant volatility, declining to an all-time low of $0.0164 on January 31, 2026. As of February 2, 2026, GAI trades at approximately $0.01809 with a market capitalization of $1.27 million. The token has shown a 7-day decline of 25.77% and a 30-day decrease of 48.97%, reflecting the price adjustment patterns common in newly launched crypto assets.
Q3: What are the main risks associated with investing in GraphAI?
The primary risks include high price volatility (evidenced by the token's 96.8% decline from its all-time high), limited liquidity with a 24-hour trading volume of only $15,589.92, and relatively small market capitalization of $1.27 million. Additional risk factors encompass regulatory uncertainty surrounding AI-blockchain hybrid projects, technical dependencies on multiple external ecosystems (Base, Ethereum, Artificial Superintelligence Alliance), and the early-stage nature of the project with only 7,301 token holders. Network security considerations and potential smart contract vulnerabilities also present ongoing technical risks.
Q4: What is the tokenomics structure of GAI?
GAI has a maximum supply of 100,000,000 tokens, with 70,000,000 tokens (70%) currently in circulation. The token serves functional roles within the GraphAI network including indexing, querying, curation, and staking mechanisms. The fully diluted market cap stands at $1,809,000 compared to the current market cap of $1,266,300, indicating that 30% of tokens remain unvested or locked. This fixed supply mechanism creates a defined scarcity model that influences the token's long-term value proposition.
Q5: What are the price predictions for GAI through 2030?
Short-term forecasts for 2026 range from $0.0124 (conservative) to $0.0230 (optimistic). Mid-term projections suggest potential price ranges of $0.0161-$0.0230 for 2027 and $0.0170-$0.0262 for 2028. Long-term predictions through 2030 estimate a baseline scenario of $0.0136-$0.0262, an optimistic scenario of $0.0262-$0.0332, and a transformative scenario above $0.0332. The predicted high by December 31, 2030, is $0.0332 based on optimistic development assumptions. However, these forecasts are subject to significant market volatility and uncertainty.
Q6: What investment strategies are suitable for GAI?
Conservative investors may consider allocating 1-3% of their crypto portfolio to GAI as a speculative position, utilizing a long-term holding (HODL) strategy focused on the project's fundamental development. Aggressive investors could allocate 5-10% as part of a higher-risk approach. Active traders might employ technical analysis based on GAI's price patterns, with the token showing a 24-hour range of $0.01695-$0.01929 as of February 2, 2026. Risk management should include multi-asset portfolio diversification, position sizing strategies, and secure storage using hardware wallets compatible with BASE network infrastructure.
Q7: How liquid is the GAI market and where can it be traded?
GAI exhibits relatively modest liquidity with a circulating market cap of approximately $1.27 million and 24-hour trading volume of $15,589.92 as of February 2, 2026. This limited liquidity profile may contribute to wider bid-ask spreads and increased price sensitivity to individual trades. Trading activity has been concentrated on limited exchange platforms during the project's early phase. Investors should be aware that this liquidity constraint could affect execution quality for larger position sizes and contribute to the token's high volatility characteristics.
Q8: What factors could drive future adoption and value for GraphAI?
Key catalysts for potential growth include expansion of GraphEngine adoption among developers and enterprises, strategic partnerships with major blockchain ecosystems, increasing demand for AI-accessible on-chain data analytics, and broader Web3 infrastructure development. The project's positioning as connective infrastructure between blockchain and AI addresses the emerging need for structured blockchain data as applications increasingly incorporate AI capabilities. Integration with established ecosystems like Base, Ethereum, and the Artificial Superintelligence Alliance provides foundational infrastructure for potential network effects, though actual adoption remains to be demonstrated through measurable usage metrics.
* The information is not intended to be and does not constitute financial advice or any other recommendation of any sort offered or endorsed by Gate.