Master Japanese candlesticks like a pro and explore the most popular patterns with real-world examples
What Are Japanese Candlesticks?
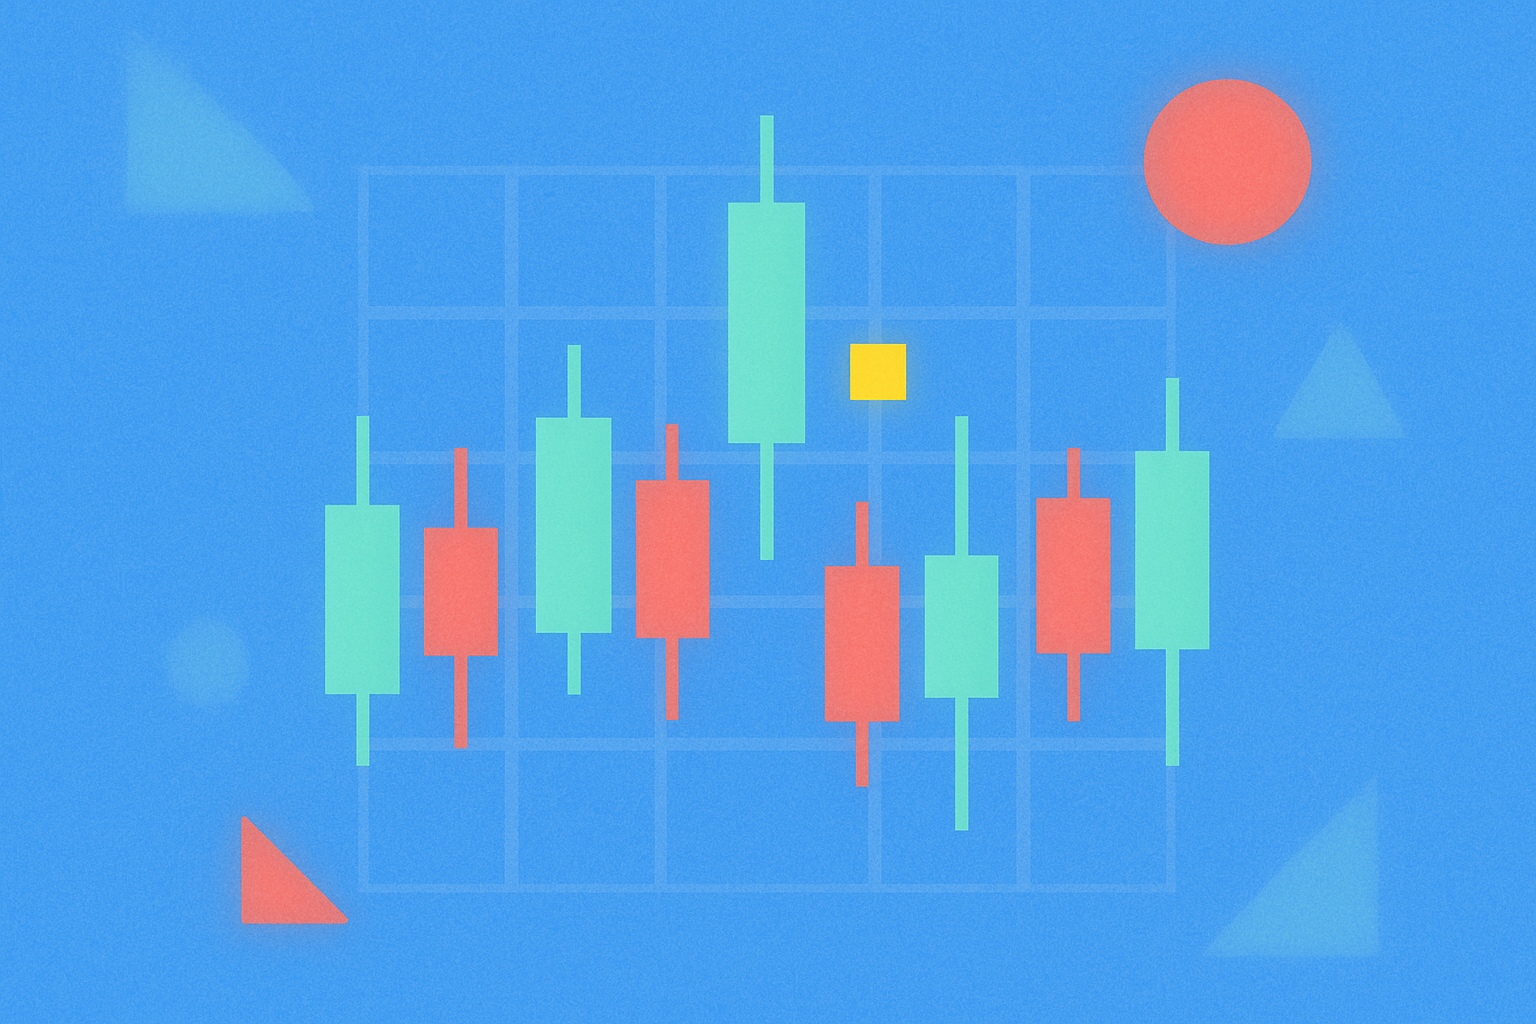
Japanese candlesticks are a centuries-old analytical tool with origins in 17th-century Japan, where rice traders used them to monitor price movements. Today, Japanese candlesticks are among the most essential technical analysis tools in both cryptocurrency and traditional financial markets.
The core principle of Japanese candlesticks is to understand market psychology and trader behavior. By analyzing candlestick shapes and patterns on charts, traders can forecast potential future price movements of financial assets. Each candlestick reveals the ongoing struggle between buying and selling forces in the market.
Financial markets experience ongoing cycles of rallies and declines, driven by the psychological battle between investor greed and fear. When greed dominates, prices rise due to increased demand; when fear takes over, prices fall as intense selling sets in. Japanese candlesticks capture these cycles and translate them into visual patterns that are easily read and interpreted on charts.
What distinguishes Japanese candlesticks from other analysis tools is their ability to present four key data points in a single visual: opening price, closing price, high, and low for a defined period. This information-rich format makes Japanese candlesticks indispensable for any serious crypto trader.
How Can You Read Japanese Candlesticks?
Reading Japanese candlesticks requires an understanding of each candlestick’s basic components and the insights they provide. Every candlestick on a chart represents a specific time frame and contains five critical data points:
- Highest price reached: The peak price achieved during the candlestick’s time interval.
- Lowest price reached: The lowest price touched during the same interval.
- Opening price: The point where the candlestick began to form.
- Closing price: The final value where the candlestick ended.
- Trading volume: The amount of the asset traded during the candlestick’s lifespan, serving as an indicator of movement strength.
Candlestick Color and Its Meaning
Color is the most immediate visual cue for traders analyzing a chart. A green candlestick (or white on some platforms) indicates a bullish candle, where the closing price exceeds the opening price, reflecting buyer dominance during that period. A red (or black) candlestick signals a bearish candle, where the closing price is below the opening price, marking seller control.
The color intensity and candlestick size provide additional evidence of movement strength. Large candlesticks signify a robust move in one direction, while small candlesticks signal indecision and weak trend momentum.
Detailed Candlestick Components
Body: The thick section of the candlestick, spanning from the opening to the closing price. A long body represents strong buying if green, or strong selling if red. A short body suggests volatility and an unclear trend.
Wick/Shadow: Thin lines extending from the top and bottom of the body. The upper wick is the range between the high and the close (for a green candle) or the open (for a red candle). The lower wick is the difference between the low and the open or close. Long wicks reflect market rejection of those price levels, indicating strong competition between buyers and sellers.
Open: Where the candlestick starts forming, indicating the first traded price in that time frame.
Close: Where the candlestick ends, or the last traded price before the next candlestick begins. The relationship between open and close determines the candlestick’s color and direction.
Time Frame of the Candlestick and Its Significance
Every candlestick on a chart represents a time frame determined by the trader’s strategy. This could be one minute, five minutes, fifteen minutes, one hour, four hours, one day, one week, or even one month.
The key rule in technical analysis: The longer the candlestick’s time frame, the stronger and more reliable its signal. A daily candlestick holds more significance than a five-minute candlestick, as it reflects 24 hours of market activity and typically involves higher volume. Long-term traders rely on daily and weekly candlesticks, while short-term traders (scalpers) often use minute and hourly candlesticks.
It’s crucial for traders to interpret candlesticks across multiple time frames to gain a comprehensive market view. Multi-time-frame analysis helps validate signals and reduces the risk of false positives.
Key Japanese Candlestick Patterns in Crypto
Japanese candlestick patterns are specific chart formations that offer predictive insights into market direction. These patterns have been validated over centuries and are effective across financial markets, including cryptocurrencies.
Hammer Candlestick
The hammer is one of the most powerful bullish reversal patterns in technical analysis. It forms when the price opens high, experiences heavy selling that drives it sharply lower, but then buyers gradually step in and push the price back near or above the opening level by the close.
The hammer’s distinctive shape features a small body at the top and a long lower wick (ideally at least twice the body’s length), with a very short or absent upper wick. This pattern signals strong market rejection of low prices and indicates buyers have regained control.
Hammers typically appear at the end of a downtrend or at strong support levels, suggesting the start of a new uptrend. For confirmation, look for a green candlestick next that closes above the hammer’s close on high volume.
In crypto markets, hammers serve as entry signals for long trades, especially after sharp price drops. Place a stop-loss below the hammer’s lower wick to protect capital if the pattern fails.
Bullish Engulfing Candlestick
The bullish engulfing pattern is a highly reliable bullish reversal signal made up of two consecutive candles. The first is a small red (bearish) candle, followed by a large green (bullish) candle that completely engulfs the red candle’s body. The green candle opens below the red candle’s close and closes above the red candle’s open.
This pattern usually signals the end of a downtrend and the start of buyer dominance. The large green candle reflects strong buying and a significant influx of capital, suggesting a potential strong rally.
The larger the green candle and the higher the trading volume, the more reliable the signal. In crypto, this pattern is most effective at key support or after prolonged declines, when sellers have largely exited the market.
The optimal trading strategy is to go long when the green candle closes or at the open of the next candle, with a stop-loss below the green candle’s low. The target can be the next resistance level or a percentage based on the pattern’s size.
Bearish Engulfing Candlestick
The bearish engulfing pattern is the inverse of the bullish engulfing and is a robust bearish reversal signal. It comprises a small green (bullish) candle followed by a large red (bearish) candle that fully engulfs the green candle’s body.
This pattern often appears at the end of an uptrend or at strong resistance, indicating a likely trend reversal to the downside. The large red candle shows strong rejection of higher prices and a shift to seller control.
In crypto, bearish engulfing patterns are warning signs for long holders—encouraging profit-taking or position reduction. Active traders may use this signal for short entries, especially after sharp rallies and with high volume.
Confirmation comes from the next candle, which should be red and close below the bearish engulfing candle. Place the stop-loss above the red candle’s high, with a target at the next support.
Morning Star Candle
The morning star is a powerful bullish reversal pattern of three consecutive candles, appearing at the end of a downtrend. The first is a large red candle (sustained selling), followed by a small candle (green or red) indicating indecision, and then a large green candle that closes above the midpoint of the first red candle’s body.
This pattern signals a gradual shift from seller to buyer control. The small middle candle (the star) reflects waning selling pressure and tentative buying. The large green candle confirms that buyers are gaining strength and are ready to push the price up.
In crypto, the morning star is especially reliable on longer time frames (daily or weekly). Higher-than-average volume on the third candle validates the bullish reversal.
The strategy is to enter long at the close of the third candle or upon breaking its high, with a stop-loss below the second candle’s low. The target may be the next resistance level or twice the distance from the pattern’s low to the third candle’s high.
Shooting Star Candlestick
The shooting star is a bearish reversal pattern formed by a single candle and serves as an early warning of a potential trend top. It features a small body at the bottom (green or red) and a long upper wick (at least twice the body’s length), with a very short or absent lower wick.
This pattern forms when the price opens and surges upward, but sellers emerge at the highs and push the price down to close near the open. It signals the market’s rejection of high prices and waning buying strength.
Shooting stars typically appear following strong rallies or at major resistance, suggesting sellers are starting to take control. This pattern is particularly useful for profit-taking, signaling long holders to start locking in gains when it appears.
For confirmation, look for a red candle next that closes below the shooting star. Active traders may use this for short entries, with a stop-loss above the upper wick. In crypto’s volatile environment, wait for extra confirmation before selling, especially after strong uptrends.
Crypto Markets Are Highly Volatile and Unstable
The crypto market features unique characteristics that set it apart from traditional financial markets. Chief among these is extreme volatility and relatively unstable price action, driven by several key factors:
Relatively low trading volume: Compared to traditional currency or major stock markets, most cryptocurrencies have modest trading volumes, so even a single large trade can move prices sharply and unexpectedly.
Small market capitalization: Most cryptocurrencies (excluding major coins) have small market caps, making them more vulnerable to manipulation and sudden swings. Whales—large investors—can move prices significantly with major buy or sell orders.
Strong psychological drivers: Crypto investors are often more influenced by emotion and news than traditional market participants. Fear and greed play outsized roles, driving exaggerated price swings in both directions.
Because of this volatility, Japanese candlestick patterns may not always form perfectly or deliver expected outcomes. False signals are more frequent than in stable markets. That’s why it’s crucial to develop the skill of reading candlesticks and understanding their narrative—not just memorize patterns.
Successful crypto traders adapt their candlestick knowledge to volatile conditions. Flexibility in interpreting patterns and readiness to modify strategies is essential. Supplementing candlestick analysis with other confirmation tools—such as momentum indicators, trading volume, and support/resistance levels—is necessary to minimize the risk of false signals.
Candlesticks Alone Don’t Tell the Whole Story
Despite the power of Japanese candlesticks, no trader should rely on them exclusively. Comprehensive market analysis requires considering multiple interrelated factors influencing price action:
Dominant market trend on longer time frames: Before acting on any single candlestick pattern, always assess the overall trend. A bullish reversal on a short time frame may be only a technical rebound within a larger downtrend. Multi-time-frame analysis is essential to understand the broader context.
Project and coin-specific updates: News and technical developments related to a crypto project can decisively impact price direction. Product launches, strategic partnerships, or technical issues can shift the market, regardless of what candlesticks indicate. Monitoring official news and social media is a must.
Global economic conditions: Crypto markets are influenced by global macroeconomic developments—central bank policy, inflation rates, crises, and government stances on digital assets all shape investor sentiment and price action.
Geopolitical developments: Political tensions, wars, sanctions, and major geopolitical events can spark sharp moves in crypto. Some investors flock to digital assets as a safe haven during turmoil, while others exit riskier positions.
Trading volume and liquidity: Analyzing volume together with candlestick patterns is vital. A strong pattern on low volume is less reliable, while even modest patterns with high volume are more trustworthy.
Professional traders combine Japanese candlestick analysis with fundamental and comprehensive technical analysis, using indicators, support/resistance, and trend lines. This integrated approach enhances success rates and reduces risk.
Reading Japanese Candlesticks Is a Skill Developed Through Practice
Mastering Japanese candlestick reading is not just about theory or watching tutorials. It’s a hands-on skill that takes years of consistent practice and real-world experience to perfect. Like any discipline, it requires repetition and active engagement to develop and refine.
The most effective way to improve candlestick reading is by regularly analyzing real crypto charts. New traders should dedicate daily time to reviewing as many charts as possible. Instead of quick glances, each chart should be studied carefully to understand the story behind the candlesticks.
Backtesting is a powerful way to hone candlestick skills. This involves reviewing historical charts, identifying past candlestick patterns, and observing subsequent price action. Did the expected outcome materialize? Was the signal valid? What other factors influenced the result? Backtesting deepens understanding of how patterns behave in different contexts.
Practice with a demo account before risking real money is essential. Most trading platforms provide demo accounts that simulate live market conditions without financial risk. Traders can use these to apply candlestick knowledge and test strategies without emotional pressure.
Exposure to a wide variety of charts across different cryptocurrencies helps broaden perspective and reveals how patterns perform in various environments. Each crypto asset has unique characteristics and price behavior; what works for one may not work for another.
Learning from mistakes is fundamental to growth. Every loss or false signal is an opportunity to improve. Traders should maintain a trading journal to document every trade, the patterns used, rationale, and results. Regularly reviewing the journal helps identify strengths, weaknesses, and areas for improvement.
Patience and discipline are essential traits for successful traders. Developing professional-level candlestick reading takes time—there are no shortcuts. Rushing into trading without adequate experience often results in significant losses.
Japanese candlesticks are a powerful, effective tool for crafting sound trading strategies and safeguarding capital against large losses. Combined with other analysis tools and robust risk management—especially effective stop-loss strategies—they become a vital asset in any serious crypto trader's toolkit.
Traders who invest time and effort into developing their candlestick reading skills will be able to make more confident, precise decisions and are less likely to fall for false signals or act impulsively. Ultimately, trading success depends on consistent, practical application of knowledge in real-world market conditions—not just theoretical understanding.
FAQ
What Are Japanese Candlesticks and How Do They Differ from Traditional Charts?
Japanese candlesticks show the open, close, high, and low prices. Unlike traditional charts, candlesticks use color to differentiate bullish from bearish trends. Traditional charts only display price changes without distinguishing between the open and close.
What Are the Four Main Components of Japanese Candlesticks (Open, Close, High, Low)?
The opening price is the value at the start of the period. The closing price is the value at the end. The high is the highest price reached, and the low is the lowest price during the period.
What Are the Most Common Japanese Candlestick Patterns, and What Do the Hammer Line, Engulfing Pattern, and Harami Pattern Mean?
The hammer line signals a possible reversal, the engulfing pattern indicates a strong trend, and the harami pattern signals a potential change in price direction. These three core patterns help forecast price moves in crypto markets.
How Do You Identify Bullish and Bearish Patterns, and What Do They Mean in Trading?
Bullish patterns indicate an ongoing uptrend and offer buying opportunities, while bearish patterns point to a continuing downtrend and present selling opportunities in the market.
What Do "Highs and Lows" or "Wicks" in Japanese Candlesticks Represent, and How Do They Help Identify Market Direction?
Wicks represent the highest and lowest prices during a trading period. Long wicks show strong selling pressure, while short wicks suggest clear direction. Wick balance reflects uncertainty between buyers and sellers.
How Can You Apply Japanese Candlestick Patterns in Real Trading to Build a Strategy?
Identify primary candlestick patterns like the inverted star and three white soldiers to determine entry and exit points, combine them with other technical indicators for better signal accuracy, and use them to interpret market trends and possible reversals.
How Reliable Is Japanese Candlestick Pattern Analysis, and What Risks Should You Watch for When Using Them?
Japanese candlestick patterns are highly accurate for forecasting price moves, especially when used with other indicators. However, traders must be aware of market volatility and false signals, which can lead to losses if not applied carefully.
How Do Different Time Frames (Daily, Weekly, Monthly) Affect Japanese Candlestick Patterns?
Longer time frames (weekly and monthly) produce more reliable but less frequent signals; shorter time frames (daily) generate more frequent but noisier signals. Patterns on longer time frames are more stable and predictive.
How Can You Combine Other Technical Indicators to Confirm Japanese Candlestick Patterns?
Combine indicators like moving averages and the Relative Strength Index (RSI) with candlestick patterns. When signals align, trend and momentum confirmation become much stronger.
Share
Content
How to Buy Cryptocurrency


Trending Cryptocurrencies


How to Withdraw Money from Crypto Exchanges in 2025: A Beginner's Guide

Hedera Hashgraph (HBAR): Founders, Technology, and Price Outlook to 2030

Jasmy Coin: A Japanese Crypto Tale of Ambition, Hype, and Hope

IOTA (MIOTA) – From Tangle Origins to 2025 Price Outlook

Bitcoin Price in 2025: Analysis and Market Trends

How to Trade Bitcoin in 2025: A Beginner's Guide
How to Start Bitcoin Mining

2026 EGG Price Prediction: Expert Analysis and Market Forecast for the Coming Year
Is xHashtag AI (XTAG) a good investment?: A Comprehensive Analysis of Risk, Potential Returns, and Market Viability

What Is NAV (Net Asset Value)?
Comprehensive Guide to Inflation and Investment Protection