LOOKS vs OP: Understanding the Key Differences Between Appearance and Operational Performance in Modern Technology


Introduction: LOOKS vs OP Investment Comparison
In the cryptocurrency market, the comparison between LOOKS and OP has consistently been a topic that investors cannot overlook. The two not only differ significantly in market capitalization ranking, application scenarios, and price performance, but also represent different crypto asset positioning. LooksRare (LOOKS): Launched in 2022, it has gained market recognition by positioning itself as a community-first NFT trading platform where participants can earn rewards through buying or selling NFTs. Optimism (OP): Since its introduction in 2022, it has been regarded as a low-cost, lightning-fast Ethereum Layer 2 blockchain solution, ranking among the cryptocurrencies with substantial trading volume and market presence. This article will provide a comprehensive analysis of the investment value comparison between LOOKS and OP, covering historical price trends, supply mechanisms, institutional adoption, technical ecosystems, and future predictions, while attempting to answer the question investors care about most:
"Which is the better buy right now?"
I. Historical Price Comparison and Current Market Status
LOOKS (Coin A) vs OP (Coin B) Historical Price Trends
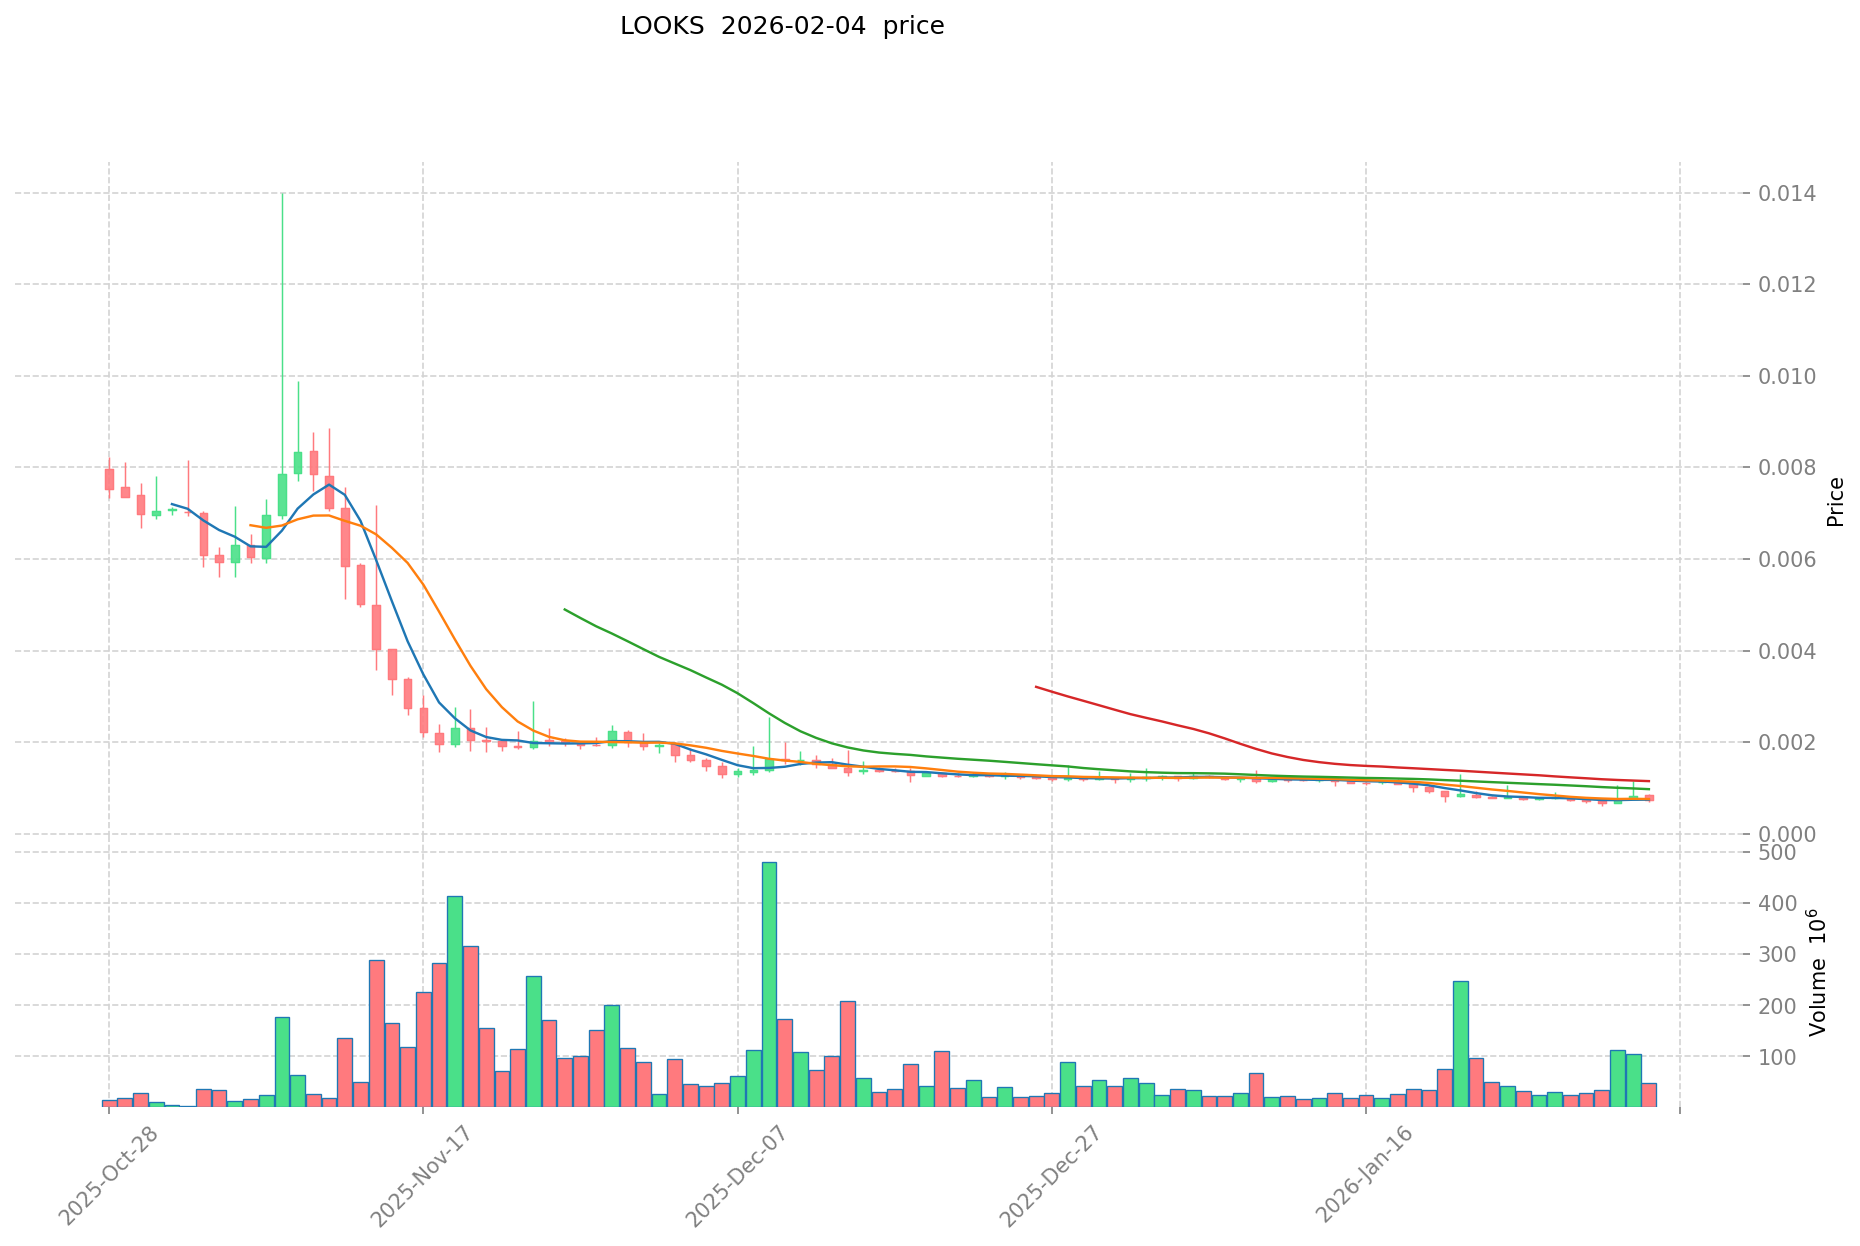
- 2022: LOOKS reached a price peak of $7.1 on January 21, 2022, following its launch as a community-first NFT marketplace.
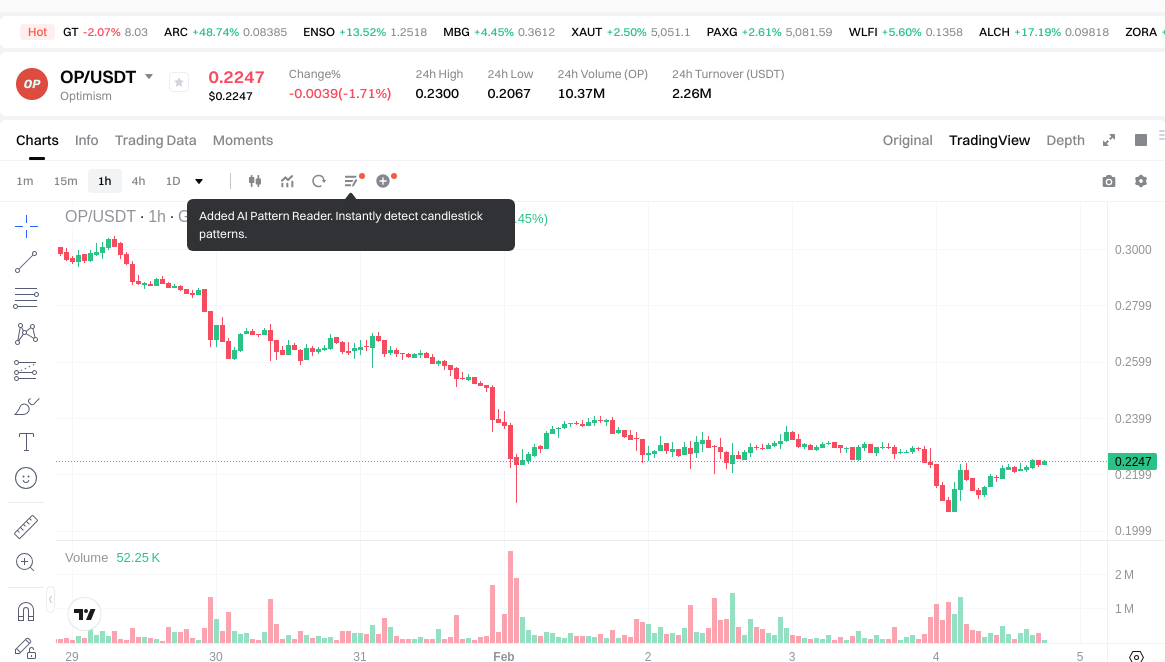
- 2024: OP recorded its all-time high of $4.84 on March 6, 2024, driven by adoption of its Layer 2 scaling solution.
- Comparative Analysis: During the recent market cycle, LOOKS declined from its all-time high of $7.1 to an all-time low of $0.00064821 on February 1, 2026, representing a decline of over 99.99%. In contrast, OP fell from its peak of $4.84 to an all-time low of $0.207182 on February 4, 2026, showing a decline of approximately 95.72%.
Current Market Situation (2026-02-04)
- LOOKS current price: $0.0007152
- OP current price: $0.2239
- 24-hour trading volume: LOOKS $33,433.27 vs OP $2,262,513.51
- Market Sentiment Index (Fear & Greed Index): 14 (Extreme Fear)
View real-time prices:
- Check LOOKS current price Market Price
- Check OP current price Market Price
II. Core Factors Influencing LOOKS vs OP Investment Value
Supply Mechanism Comparison (Tokenomics)
- LOOKS: Features a fixed maximum supply of 1,000,000,000 tokens, which establishes a defined scarcity framework that may influence long-term price dynamics through supply constraints.
- OP: The supply mechanism and distribution model remain subject to ongoing technical development and governance decisions within the Optimism ecosystem.
- 📌 Historical Pattern: Supply mechanisms with predetermined caps have historically contributed to cyclical price movements as circulating supply approaches maximum thresholds, though actual price performance depends on multiple market variables.
Institutional Adoption and Market Application
- Institutional Holdings: Current data on institutional preference between LOOKS and OP shows varying allocation strategies, with factors including protocol maturity and use case specificity influencing institutional positioning.
- Enterprise Adoption: LOOKS operates primarily within NFT marketplace infrastructure, while OP functions as a Layer 2 scaling solution with broader application potential across DeFi protocols and decentralized applications.
- Regulatory Environment: Both tokens operate within evolving regulatory frameworks that vary significantly across jurisdictions, affecting their respective market accessibility and institutional adoption rates.
Technical Development and Ecosystem Construction
- LOOKS Technical Framework: Positioned within the NFT marketplace sector, the token serves utility functions related to trading fee distribution and platform governance mechanisms.
- OP Technical Evolution: Continues development as a Layer 2 scaling solution aimed at enhancing Ethereum network throughput and reducing transaction costs, with ongoing protocol upgrades influencing its technical positioning.
- Ecosystem Comparison: LOOKS concentrates on NFT marketplace functionality, while OP supports a broader range of DeFi protocols, decentralized applications, and smart contract deployments across its Layer 2 infrastructure.
Macroeconomic Environment and Market Cycles
- Performance in Inflationary Conditions: Digital assets demonstrate varying correlation patterns with traditional inflation hedges, with performance influenced by market sentiment, liquidity conditions, and broader risk appetite.
- Macroeconomic Policy Impact: Interest rate adjustments and dollar index movements affect cryptocurrency market liquidity and capital flows, potentially influencing both LOOKS and OP valuations through risk-on/risk-off dynamics.
- Geopolitical Considerations: Cross-border transaction demand and international regulatory developments may affect adoption patterns for different cryptocurrency use cases, including NFT platforms and Layer 2 scaling solutions.
III. 2026-2031 Price Forecast: LOOKS vs OP
Short-term Forecast (2026)
- LOOKS: Conservative $0.00038225 - $0.000695 | Optimistic $0.000695 - $0.0010147
- OP: Conservative $0.119038 - $0.2246 | Optimistic $0.2246 - $0.29198
Mid-term Forecast (2028-2029)
- LOOKS may enter a gradual recovery phase, with estimated price range of $0.000810141345 - $0.00139822087005
- OP may enter a consolidation phase, with estimated price range of $0.209059926 - $0.383909759
- Key drivers: institutional capital flows, ETF developments, ecosystem expansion
Long-term Forecast (2030-2031)
- LOOKS: Baseline scenario $0.000812234210141 - $0.001374550201777 | Optimistic scenario $0.001249591092525 - $0.001553241728008
- OP: Baseline scenario $0.27163937409114 - $0.382590667734 | Optimistic scenario $0.3510006126 - $0.49354196137686
Disclaimer
LOOKS:
| Year | Predicted High Price | Predicted Average Price | Predicted Low Price | Price Change |
|---|---|---|---|---|
| 2026 | 0.0010147 | 0.000695 | 0.00038225 | -2 |
| 2027 | 0.0012224355 | 0.00085485 | 0.0004701675 | 19 |
| 2028 | 0.00116327988 | 0.00103864275 | 0.000810141345 | 45 |
| 2029 | 0.00139822087005 | 0.001100961315 | 0.0007926921468 | 53 |
| 2030 | 0.00149950931103 | 0.001249591092525 | 0.000812234210141 | 74 |
| 2031 | 0.001553241728008 | 0.001374550201777 | 0.001319568193706 | 92 |
OP:
| Year | Predicted High Price | Predicted Average Price | Predicted Low Price | Price Change |
|---|---|---|---|---|
| 2026 | 0.29198 | 0.2246 | 0.119038 | 0 |
| 2027 | 0.2918677 | 0.25829 | 0.2195465 | 15 |
| 2028 | 0.363104082 | 0.27507885 | 0.209059926 | 22 |
| 2029 | 0.3829097592 | 0.319091466 | 0.22974585552 | 42 |
| 2030 | 0.414180722868 | 0.3510006126 | 0.329940575844 | 56 |
| 2031 | 0.49354196137686 | 0.382590667734 | 0.27163937409114 | 70 |
IV. Investment Strategy Comparison: LOOKS vs OP
Long-term vs Short-term Investment Strategies
- LOOKS: May appeal to investors focused on NFT marketplace infrastructure with high risk tolerance, given its significant price decline and niche market positioning within the digital collectibles sector.
- OP: May suit investors seeking exposure to Layer 2 scaling solutions with broader ecosystem applications across DeFi protocols and decentralized applications.
Risk Management and Asset Allocation
- Conservative Investors: LOOKS 10-15% vs OP 20-30% (within overall crypto allocation)
- Aggressive Investors: LOOKS 20-30% vs OP 30-40% (within overall crypto allocation)
- Hedging Tools: Stablecoin allocation, options strategies, cross-asset portfolio diversification
V. Potential Risk Comparison
Market Risk
- LOOKS: Exhibits heightened volatility with price decline exceeding 99% from all-time high, indicating substantial market risk and limited liquidity as reflected in 24-hour trading volume of $33,433.27.
- OP: Demonstrates significant price fluctuation with approximately 95% decline from peak, though maintains comparatively higher liquidity with 24-hour trading volume of $2,262,513.51.
Technical Risk
- LOOKS: NFT marketplace concentration risk, platform adoption dependencies, competitive pressure from established marketplaces
- OP: Layer 2 scaling implementation challenges, bridge security considerations, ongoing protocol development dependencies
Regulatory Risk
- Evolving regulatory frameworks across jurisdictions may impact both tokens differently, with NFT-focused platforms and Layer 2 protocols subject to varying compliance requirements and market access restrictions
VI. Conclusion: Which Is the Better Buy?
📌 Investment Value Summary:
- LOOKS Considerations: Positioned within the NFT marketplace sector with community-first approach, though facing significant price depreciation and market challenges
- OP Considerations: Functions as Layer 2 scaling solution with broader ecosystem applications, maintaining relatively higher market liquidity and technical development momentum
✅ Investment Guidance:
- Novice Investors: Consider establishing foundational understanding of cryptocurrency fundamentals before allocating to higher-risk assets; prioritize diversification and risk management
- Experienced Investors: Evaluate portfolio positioning based on individual risk tolerance, market outlook, and specific exposure preferences to NFT infrastructure versus Layer 2 scaling solutions
- Institutional Investors: Conduct comprehensive due diligence on regulatory compliance, liquidity requirements, and strategic alignment with investment mandates
⚠️ Risk Disclosure: Cryptocurrency markets exhibit extreme volatility. This content does not constitute investment advice. Investors should conduct independent research and consider their financial circumstances before making investment decisions.
VII. FAQ
Q1: What are the main differences between LOOKS and OP in terms of their core use cases?
LOOKS is specifically designed as a community-first NFT marketplace platform, while OP functions as an Ethereum Layer 2 scaling solution with broader applications. LOOKS focuses on NFT trading infrastructure where users can earn rewards through buying and selling digital collectibles, operating within a niche market segment. In contrast, OP serves as a scaling solution that enhances Ethereum network throughput, reduces transaction costs, and supports a wide range of DeFi protocols and decentralized applications across its Layer 2 infrastructure. This fundamental difference in purpose positions LOOKS as a sector-specific token concentrated on the NFT marketplace, whereas OP addresses broader blockchain scalability challenges with applications extending beyond any single market segment.
Q2: How do the price declines of LOOKS and OP compare since their all-time highs?
LOOKS has experienced a more severe price decline than OP. LOOKS declined from its all-time high of $7.1 (January 21, 2022) to $0.00064821 (February 1, 2026), representing a decline exceeding 99.99%. OP fell from its peak of $4.84 (March 6, 2024) to $0.207182 (February 4, 2026), showing an approximately 95.72% decline. While both tokens have experienced substantial depreciation, LOOKS demonstrates significantly higher downside volatility and market risk. The current 24-hour trading volumes further illustrate this disparity, with LOOKS at $33,433.27 compared to OP's $2,262,513.51, indicating substantially lower liquidity and market activity for LOOKS.
Q3: What does the price forecast suggest for LOOKS and OP through 2031?
The price forecasts suggest modest recovery potential for both tokens through 2031, though with different trajectories. For LOOKS, the conservative 2026 range is $0.00038225 - $0.000695, potentially reaching $0.001319568193706 - $0.001553241728008 by 2031 under optimistic scenarios. For OP, conservative 2026 estimates range from $0.119038 - $0.2246, potentially reaching $0.27163937409114 - $0.49354196137686 by 2031. These projections suggest OP maintains significantly higher absolute price levels, though both face substantial uncertainty given current market conditions reflected by the Fear & Greed Index at 14 (Extreme Fear). Investors should note these forecasts depend on multiple variables including institutional adoption, ecosystem development, and broader market recovery.
Q4: What risk allocation strategies are recommended for different investor profiles?
Risk allocation strategies vary significantly based on investor experience and risk tolerance. Conservative investors might consider allocating 10-15% of their crypto portfolio to LOOKS versus 20-30% to OP, reflecting OP's relatively lower risk profile and broader ecosystem applications. Aggressive investors with higher risk tolerance might allocate 20-30% to LOOKS and 30-40% to OP within their overall cryptocurrency holdings. These allocations should exist within a properly diversified portfolio that includes hedging tools such as stablecoin positions, options strategies, and cross-asset diversification. Novice investors are particularly advised to establish foundational understanding of cryptocurrency fundamentals before allocating to higher-risk assets like LOOKS, prioritizing risk management and portfolio diversification.
Q5: How do supply mechanisms differ between LOOKS and OP, and why does this matter?
LOOKS features a fixed maximum supply of 1,000,000,000 tokens, establishing a predetermined scarcity framework that creates defined supply constraints potentially influencing long-term price dynamics. This fixed cap means no additional tokens can be created beyond the maximum supply, which historically has contributed to cyclical price movements as circulating supply approaches maximum thresholds. In contrast, OP's supply mechanism remains subject to ongoing technical development and governance decisions within the Optimism ecosystem, providing greater flexibility but less predictability. The importance of this difference lies in how scarcity influences valuation models—fixed supply mechanisms may appeal to investors seeking predictable token economics, while flexible mechanisms allow protocol adjustments based on ecosystem needs and governance decisions.
Q6: What are the primary technical risks associated with each token?
LOOKS faces technical risks primarily related to NFT marketplace concentration, including platform adoption dependencies and competitive pressure from established marketplaces like OpenSea and Blur. The token's value proposition depends heavily on LooksRare platform success and continued user engagement within a highly competitive NFT trading environment. OP confronts different technical challenges related to Layer 2 scaling implementation, including bridge security considerations that have historically posed vulnerabilities in cross-chain infrastructure, and ongoing protocol development dependencies as the technology continues to evolve. Both tokens face technical risks, but LOOKS risks center on marketplace adoption dynamics while OP risks relate to infrastructure security and scaling solution effectiveness.
Q7: How might regulatory developments affect LOOKS versus OP differently?
Regulatory developments may impact LOOKS and OP through different channels due to their distinct use cases. LOOKS, as an NFT marketplace token, faces regulatory considerations specific to digital collectibles, including potential securities classification of certain NFTs, intellectual property concerns, and platform compliance requirements varying across jurisdictions. OP, functioning as a Layer 2 scaling infrastructure, encounters regulatory frameworks applicable to blockchain technology providers, cross-border transaction facilitation, and potential classification as utility infrastructure within cryptocurrency ecosystems. Evolving regulatory clarity around NFT platforms versus blockchain scaling solutions may create divergent compliance requirements and market access restrictions, affecting their respective adoption rates and institutional positioning differently across various jurisdictions.
Q8: What factors should investors prioritize when choosing between LOOKS and OP?
Investors should prioritize several key factors based on their investment objectives and risk profiles. First, assess use case alignment—whether preference exists for NFT marketplace infrastructure exposure (LOOKS) versus Layer 2 scaling solution benefits (OP). Second, evaluate risk tolerance given LOOKS' significantly higher price volatility and lower liquidity compared to OP's relatively more stable trading environment. Third, consider ecosystem maturity and development momentum, where OP demonstrates broader application potential across DeFi protocols while LOOKS operates within a more concentrated market segment. Fourth, analyze liquidity requirements, noting the substantial difference in 24-hour trading volumes ($33,433.27 for LOOKS versus $2,262,513.51 for OP). Finally, align investment timeframes with recovery prospects, recognizing both tokens face substantial challenges requiring patient capital and comprehensive risk management strategies.
Share
Content
Introduction: LOOKS vs OP Investment Comparison
I. Historical Price Comparison and Current Market Status
II. Core Factors Influencing LOOKS vs OP Investment Value
III. 2026-2031 Price Forecast: LOOKS vs OP
IV. Investment Strategy Comparison: LOOKS vs OP
V. Potential Risk Comparison
VI. Conclusion: Which Is the Better Buy?
VII. FAQ
How to Buy Cryptocurrency


Trending Cryptocurrencies


Treasure NFT Marketplace: A 2025 Guide for Web3 Gamers and Investors

What are the new trends in the NFT market in 2025?

NFT Treasure Hunting: Top Strategies for Web3 Collectors in 2025
How to Create and Sell NFTs: A Step-by-Step Guide for Beginners

The technical principles and application scenarios of 2025 NFTs
How to Create an NFT in 2025: A Step-by-Step Guide
Best Crypto Trading Bots for Automated Trading

Top 5 Tokens Recommended for DeFi Investment
What is Crypto? How to Explain Cryptocurrency to a Child
What Is a Crypto Scam? Common Fraud Schemes and How to Protect Yourself

How do derivatives market signals like funding rates and open interest predict crypto price movements in 2026?