NERO vs SOL: A Comprehensive Comparison of Two Revolutionary Blockchain Solutions
Introduction: Investment Comparison Between NERO and SOL
In the cryptocurrency market, the comparison between NERO vs SOL has consistently been a topic that investors cannot overlook. Both exhibit notable differences in market cap ranking, application scenarios, and price performance, while representing distinct positioning within the crypto asset landscape. NERO (NERO): Launched in 2025, this project has gained market recognition through its positioning as a modular, app-centric Layer 1 blockchain with native account abstraction and flexible gas payment mechanisms. SOL (SOL): Since its inception in 2020, Solana has been regarded as a high-performance blockchain protocol, ranking among the cryptocurrencies with substantial global trading volume and market capitalization. This article will comprehensively analyze the investment value comparison between NERO vs SOL across dimensions including historical price trends, supply mechanisms, institutional adoption, technical ecosystem, and future outlook, attempting to address the question investors care about most:
"Which is the better buy right now?"
I. Historical Price Comparison and Current Market Overview
Historical Price Trends of NERO (Coin A) and SOL (Coin B)
-
2020: SOL launched through a public auction at $0.22 in March 2020, raising $1.76 million. During the first three months of trading, SOL fluctuated between $0.50 and $1.50 before experiencing a rally that brought the price to a peak of $4.735 in August 2020. However, this momentum proved short-lived, and by the end of 2020, SOL had retreated to approximately $1.655.
-
2021: This year marked a breakthrough for the Solana ecosystem and its native digital currency. In the first quarter alone, SOL's token price surged by over 2,500%, making it one of the best-performing digital currencies at the time. This performance was largely driven by the broader cryptocurrency bull market. After a relatively flat performance in the subsequent months, SOL experienced another price surge and reached a peak of $253 in November 2021.
-
2025: SOL reached a new all-time high of $293.31 on January 19, 2025, reflecting increased network activity and adoption within its ecosystem.
-
NERO Chain: Launched its testnet and has been operational since then, backed by institutional players such as NTT Digital and CoinTrade. As a newer project, NERO's price history is relatively limited compared to SOL.
-
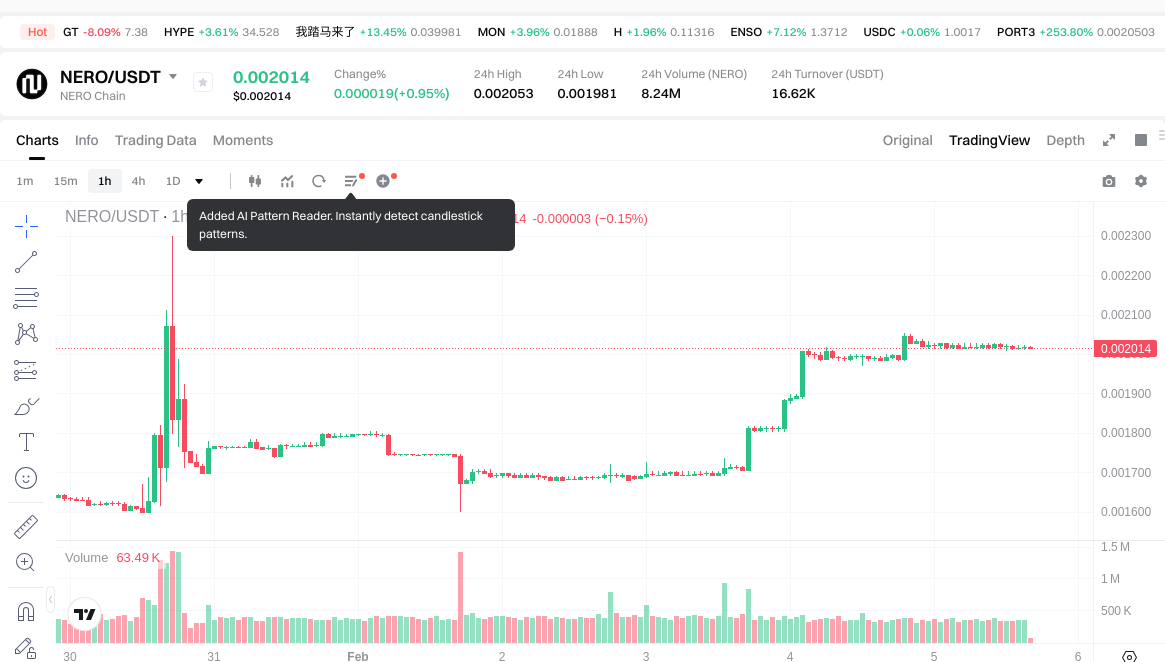
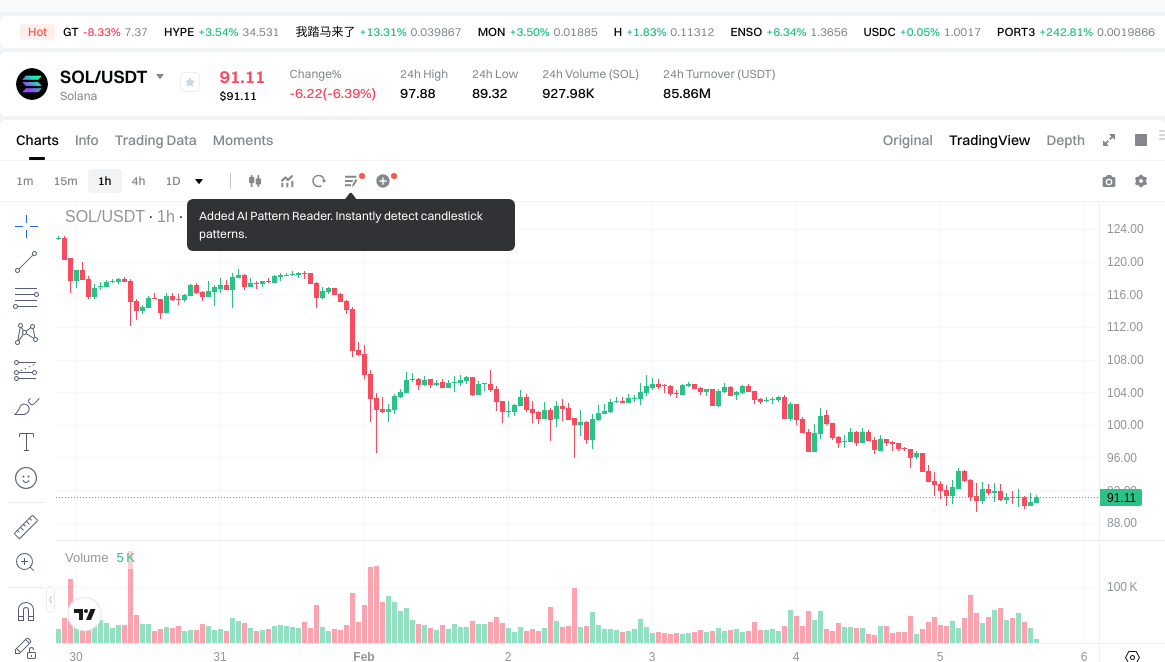
Comparative Analysis: During market cycles, SOL has demonstrated significant volatility, declining from its January 2025 peak of $293.31 to approximately $90.53 as of February 5, 2026. In contrast, NERO Chain, as a newer entrant, has shown price fluctuations within a narrower range, with a 24-hour high of $0.002053 and a low of $0.001981.
Current Market Situation (February 5, 2026)
- NERO Current Price: $0.002021
- SOL Current Price: $90.53
- 24-Hour Trading Volume: NERO recorded $16,659.91 vs SOL recorded $85,856,324.30
- Market Sentiment Index (Fear & Greed Index): 12 (Extreme Fear)
View real-time prices:
- Check NERO current price Market Price
- Check SOL current price Market Price
II. Core Factors Influencing NERO vs SOL Investment Value
Supply Mechanism Comparison (Tokenomics)
- SOL: Operates with an inflationary model featuring staking rewards, where validators and delegators earn incentives for network participation. The token supply adjusts dynamically based on network activity and governance decisions.
- NERO: Supply mechanism details are not available in current materials.
- 📌 Historical Pattern: Token supply models influence price cycles through inflation rates, staking incentives, and network security economics, affecting long-term value retention.
Institutional Adoption and Market Application
- Institutional Holdings: SOL has attracted attention from institutional investors due to its high-performance blockchain infrastructure supporting decentralized applications.
- Enterprise Adoption: SOL finds applications in DeFi protocols, NFT marketplaces, and decentralized services. Cross-border payment and settlement use cases remain under development across the ecosystem.
- Regulatory Environment: Different jurisdictions maintain varying approaches toward blockchain assets, with ongoing regulatory frameworks affecting market participation.
Technology Development and Ecosystem Building
- SOL Technology: Features high-speed transaction processing and scalability architecture designed for decentralized application deployment. The platform supports various services and continues development in network efficiency.
- NERO Technology: Information regarding technology development is not available in current materials.
- Ecosystem Comparison: SOL demonstrates active participation in DeFi, NFT platforms, and decentralized application development. Smart contract functionality supports diverse use cases across the network.
Macroeconomic Environment and Market Cycles
- Inflation Environment Performance: Digital assets respond differently to inflationary pressures based on their supply mechanisms, adoption rates, and market positioning.
- Macroeconomic Monetary Policy: Interest rate adjustments, dollar index movements, and liquidity conditions influence digital asset valuations and investment flows.
- Geopolitical Factors: Cross-border transaction requirements and international developments affect adoption patterns and regulatory approaches across different markets.
III. 2026-2031 Price Forecast: NERO vs SOL
Short-term Forecast (2026)
- NERO: Conservative $0.00109 - $0.00201 | Optimistic $0.00201 - $0.00296
- SOL: Conservative $56.58 - $91.25 | Optimistic $91.25 - $135.05
Mid-term Forecast (2028-2029)
- NERO may enter a consolidation phase, with estimated price range of $0.00179 - $0.00377
- SOL may enter an expansion phase, with estimated price range of $123.91 - $195.26
- Key drivers: institutional capital inflows, ETF developments, ecosystem growth
Long-term Forecast (2030-2031)
- NERO: Baseline scenario $0.00254 - $0.00358 | Optimistic scenario $0.00321 - $0.00469
- SOL: Baseline scenario $93.14 - $175.73 | Optimistic scenario $192.44 - $251.82
Disclaimer
NERO:
| Year | Predicted High Price | Predicted Average Price | Predicted Low Price | Price Change |
|---|---|---|---|---|
| 2026 | 0.00296058 | 0.002014 | 0.00108756 | 0 |
| 2027 | 0.0036811892 | 0.00248729 | 0.0020893236 | 23 |
| 2028 | 0.00370108752 | 0.0030842396 | 0.001788858968 | 52 |
| 2029 | 0.0037658565516 | 0.00339266356 | 0.0017302584156 | 67 |
| 2030 | 0.004438282469192 | 0.0035792600558 | 0.002541274639618 | 77 |
| 2031 | 0.00469026237712 | 0.004008771262496 | 0.003207017009996 | 98 |
SOL:
| Year | Predicted High Price | Predicted Average Price | Predicted Low Price | Price Change |
|---|---|---|---|---|
| 2026 | 135.05 | 91.25 | 56.575 | 0 |
| 2027 | 150.4895 | 113.15 | 57.7065 | 24 |
| 2028 | 180.5930575 | 131.81975 | 123.910565 | 45 |
| 2029 | 195.2580046875 | 156.20640375 | 149.9581476 | 72 |
| 2030 | 233.7238316109375 | 175.73220421875 | 93.1380682359375 | 94 |
| 2031 | 251.815462035257812 | 204.72801791484375 | 192.444336839953125 | 126 |
IV. Investment Strategy Comparison: NERO vs SOL
Long-term vs Short-term Investment Strategies
-
NERO: May appeal to investors interested in emerging blockchain infrastructure with modular architecture and account abstraction features. The asset exhibits characteristics of an early-stage project with limited trading history.
-
SOL: May attract investors seeking exposure to established high-performance blockchain protocols with demonstrated ecosystem development across DeFi, NFT platforms, and decentralized applications.
Risk Management and Asset Allocation
-
Conservative Investors: Allocation considerations might emphasize established assets with longer track records. SOL's multi-year operational history provides more historical data for risk assessment compared to NERO's recent launch.
-
Aggressive Investors: Portfolio construction approaches vary based on risk tolerance, market conditions, and investment horizons. Diversification across market capitalizations and project maturity stages represents one approach to managing exposure.
-
Hedging Tools: Stablecoin positions, derivatives instruments, and multi-asset portfolios serve as risk management mechanisms within digital asset strategies.
V. Potential Risk Comparison
Market Risks
-
NERO: As a recently launched project with 24-hour trading volume of $16,659.91, the asset demonstrates limited liquidity compared to more established cryptocurrencies. Price volatility may be influenced by lower trading depth and market participation levels.
-
SOL: Despite being an established protocol, SOL has experienced significant price fluctuations, declining from $293.31 in January 2025 to $90.53 as of February 2026. Market sentiment indicators showing "Extreme Fear" at 12 reflect broader market conditions affecting valuations.
Technical Risks
-
NERO: Information regarding network scalability, operational stability, and technical infrastructure development remains limited in available materials.
-
SOL: High-performance blockchain architectures face ongoing considerations regarding network optimization, scalability maintenance, and security framework updates as ecosystem usage evolves.
Regulatory Risks
- Jurisdictional approaches toward blockchain protocols and digital assets continue to develop across different markets. Regulatory frameworks may affect network operations, trading accessibility, and institutional participation differently based on project characteristics and geographical presence.
VI. Conclusion: Which Is the Better Buy?
📌 Investment Value Summary:
-
NERO Characteristics: Represents an emerging blockchain infrastructure project with modular Layer 1 architecture and institutional backing from entities including NTT Digital and CoinTrade. Limited operational history and trading data provide fewer historical reference points for valuation assessment.
-
SOL Characteristics: Demonstrates established presence as a high-performance blockchain protocol with substantial 24-hour trading volume of $85,856,324.30. Multi-year price history shows significant volatility across market cycles, with ecosystem development spanning DeFi protocols, NFT marketplaces, and decentralized application platforms.
✅ Investment Considerations:
-
Beginning Investors: May benefit from understanding fundamental differences between established protocols with extensive trading history versus emerging projects with limited operational data. Market education regarding volatility patterns, liquidity considerations, and risk assessment frameworks supports informed decision-making.
-
Experienced Investors: Portfolio strategies might incorporate analysis of ecosystem development trajectories, technical infrastructure maturity, institutional adoption patterns, and market cycle positioning when evaluating assets across different stages of project development.
-
Institutional Investors: Due diligence processes typically encompass comprehensive assessment of regulatory compliance frameworks, operational infrastructure, liquidity depth, custody solutions, and risk management protocols appropriate to institutional investment mandates.
⚠️ Risk Disclosure: Cryptocurrency markets demonstrate high volatility characteristics. This content does not constitute investment advice, financial guidance, or recommendations for asset purchase or sale decisions. Individuals should conduct independent research and consult qualified professionals before making investment determinations.
VII. FAQ
Q1: What is the main difference between NERO and SOL in terms of project maturity and market position?
SOL is an established high-performance blockchain protocol launched in 2020 with substantial trading volume ($85,856,324.30 in 24 hours), while NERO is a recently launched modular Layer 1 blockchain in 2025 with significantly lower trading volume ($16,659.91 in 24 hours). SOL has demonstrated a multi-year operational history with proven ecosystem development across DeFi protocols, NFT marketplaces, and decentralized applications. In contrast, NERO represents an emerging infrastructure project backed by institutional players such as NTT Digital and CoinTrade, featuring innovative account abstraction and flexible gas payment mechanisms, but with limited trading history and price reference points for comprehensive valuation assessment.
Q2: How have NERO and SOL performed in terms of price volatility and stability?
SOL has experienced significant price fluctuations throughout its history, declining from its all-time high of $293.31 in January 2025 to approximately $90.53 as of February 5, 2026, representing a substantial downturn influenced by broader market conditions. During 2021, SOL surged over 2,500% in the first quarter alone, reaching a peak of $253 in November 2021, demonstrating its capacity for both dramatic gains and steep corrections across market cycles. NERO, as a newer entrant to the market, has shown price movements within a narrower range, with a recent 24-hour high of $0.002053 and low of $0.001981, though its limited operational period provides insufficient data to establish long-term volatility patterns comparable to SOL's extensive price history.
Q3: What are the projected price ranges for NERO and SOL through 2031?
For NERO, short-term 2026 forecasts range from $0.00109 - $0.00201 (conservative) to $0.00201 - $0.00296 (optimistic), with long-term 2030-2031 projections reaching $0.00254 - $0.00358 (baseline) or $0.00321 - $0.00469 (optimistic scenario). For SOL, 2026 estimates span $56.58 - $91.25 (conservative) to $91.25 - $135.05 (optimistic), expanding to $93.14 - $175.73 (baseline) or $192.44 - $251.82 (optimistic) by 2030-2031. These projections factor in variables including institutional capital inflows, ETF developments, ecosystem growth trajectories, and macroeconomic conditions. However, cryptocurrency price predictions remain inherently speculative due to market volatility, regulatory developments, technological changes, and unpredictable adoption patterns that can significantly influence actual outcomes.
Q4: Which asset presents greater liquidity risks for investors?
NERO presents substantially greater liquidity risk compared to SOL, primarily due to its dramatically lower 24-hour trading volume of $16,659.91 versus SOL's $85,856,324.30. This limited liquidity may result in wider bid-ask spreads, increased price slippage during order execution, and potential difficulty entering or exiting positions, particularly for larger transaction sizes. As a recently launched project, NERO's trading depth across exchanges remains constrained compared to SOL's established presence on multiple trading platforms. SOL's higher liquidity facilitates more efficient price discovery, reduced transaction costs, and greater ease of portfolio rebalancing. However, both assets remain subject to market-wide liquidity conditions, with periods of extreme volatility potentially affecting execution quality regardless of normal trading volumes.
Q5: What technological advantages does each blockchain protocol offer?
SOL features high-speed transaction processing architecture designed for scalability, supporting diverse decentralized applications across DeFi, NFT platforms, and smart contract deployments with demonstrated ecosystem participation and multi-year operational validation. NERO positions itself as a modular, app-centric Layer 1 blockchain incorporating native account abstraction and flexible gas payment mechanisms, potentially offering enhanced user experience and developer flexibility. However, detailed technical specifications, performance benchmarks, network capacity metrics, and real-world stress testing results for NERO remain limited in available materials, making direct technological comparison challenging. SOL's established infrastructure provides verifiable performance data and proven operational stability, while NERO's innovative architectural approach requires further ecosystem development and adoption to validate its technical advantages in production environments.
Q6: How do institutional adoption patterns differ between NERO and SOL?
SOL has attracted institutional attention as an established high-performance blockchain infrastructure supporting various decentralized services, with broader market recognition and integration into institutional investment portfolios focusing on proven blockchain protocols. NERO has secured backing from specific institutional players including NTT Digital and CoinTrade, indicating early-stage institutional interest in its modular architecture and technical positioning. However, the scope and scale of institutional holdings, custody arrangements, and deployment capital differ significantly between the two assets. SOL benefits from longer-term institutional relationships, established custody solutions, regulatory precedent, and integration into institutional-grade trading infrastructure. NERO's institutional adoption remains in developmental stages, with institutional participation currently limited to strategic backers rather than widespread portfolio allocation across the institutional investor landscape.
Q7: What investment strategy considerations apply to portfolio allocation between NERO and SOL?
Conservative investors might emphasize SOL's multi-year operational history, established ecosystem development, substantial trading liquidity, and longer track record providing more historical data for risk assessment and performance evaluation across market cycles. Aggressive investors evaluating NERO may consider its early-stage positioning, potential for growth as ecosystem development progresses, institutional backing from strategic partners, and innovative technical architecture, balanced against higher volatility risk and limited liquidity. Portfolio construction approaches typically incorporate diversification across market capitalizations, project maturity stages, and technical differentiation, with allocation percentages reflecting individual risk tolerance, investment horizons, and market cycle positioning. Risk management frameworks might include stablecoin hedges, position sizing protocols, rebalancing strategies, and stop-loss mechanisms appropriate to each asset's liquidity profile and volatility characteristics.
Q8: What are the primary regulatory risk considerations for investing in NERO versus SOL?
Both assets face evolving regulatory frameworks that vary across jurisdictions, though their regulatory risk profiles differ based on operational history, geographical presence, and market positioning. SOL's established presence provides more regulatory precedent, historical compliance frameworks, and clarified treatment across multiple markets where it has operated since 2020, though regulatory changes continue to affect all blockchain protocols regardless of maturity. NERO, as a recently launched project, faces regulatory uncertainties common to emerging blockchain infrastructure, including potential classification determinations, compliance framework establishment, and jurisdictional approaches that remain undefined for newer protocols. Regulatory developments affecting blockchain protocols may impact network operations, trading accessibility, institutional participation levels, and cross-border functionality differently based on project characteristics, operational jurisdictions, and governance structures implemented by each protocol.
Share
Content
Introduction: Investment Comparison Between NERO and SOL
I. Historical Price Comparison and Current Market Overview
II. Core Factors Influencing NERO vs SOL Investment Value
III. 2026-2031 Price Forecast: NERO vs SOL
IV. Investment Strategy Comparison: NERO vs SOL
V. Potential Risk Comparison
VI. Conclusion: Which Is the Better Buy?
VII. FAQ
How to Buy Cryptocurrency


Trending Cryptocurrencies


What Is a Phantom Wallet: A Guide for Solana Users in 2025

Solana Price in 2025: SOL Token Analysis and Market Outlook

How Does Solana's Proof of History Work?

Solana (SOL) : Low Fees, Memecoins, and the way to moon

Is Solana a Good Investment?
Solana in 2025: Ecosystem Growth and DeFi Dominance

How does macroeconomic policy impact HBAR crypto price movements in 2026?
What Is a Physical Bitcoin and What Is Its Worth?
What is Bitcoin Cash price volatility: BCH price analysis from $548.88 with 3.67% 24-hour fluctuation

How to Analyze On-Chain Data: Active Addresses, Transaction Volume, and Whale Distribution in 2026

Leading NFT Artists Worth Watching