OVL vs SOL: A Comprehensive Comparison of Two Leading Blockchain Solutions


Introduction: Investment Comparison Between OVL and SOL
In the cryptocurrency market, the comparison between OVL and SOL remains a topic of significant interest for investors. Both tokens exhibit notable differences in market cap ranking, application scenarios, and price performance, representing distinct positioning within the crypto asset landscape. OVL (Overlay Protocol): Launched in 2025, this token has gained market attention through its focus on decentralized data derivatives protocol. The project enables real-world metrics — from ETH burn to Twitch statistics, CS2 skins, and various other data points — to be traded on-chain without counterparties, utilizing a dynamic mint-and-burn model built on the $OVL token. SOL (Solana): Since its establishment in 2017 by former engineers from Qualcomm, Intel, and Dropbox, Solana has been positioned as a high-performance blockchain protocol. The network emphasizes providing scalability without compromising decentralization or security through its single-chain delegated proof-of-stake consensus mechanism. This article will provide a comprehensive analysis of the investment value comparison between OVL and SOL, examining historical price trends, supply mechanisms, institutional adoption, technical ecosystems, and future projections, while attempting to address the question most relevant to investors:
"Which is the better buy right now?"
I. Historical Price Comparison and Current Market Status
Historical Price Trends of OVL (Overlay Protocol) and SOL (Solana)
-
2020: Solana launched with a public sale price of $0.22 in March 2020. During the first three months of trading, SOL price fluctuated between $0.50 and $1.50, reaching a peak of $4.735 in August 2020 before declining to approximately $1.655 by year-end.
-
2021: Solana experienced a breakthrough year with SOL token price surging over 2,500% in the first quarter alone, driven primarily by broader market bullish momentum. Following a period of relatively flat performance, SOL reached a peak of $253 in November 2021.
-
2025: Overlay Protocol (OVL) was deployed on the BSC network. According to available data, OVL launched in August 2025 with initial trading activity. Solana reached an all-time high of $293.31 on January 19, 2025.
-
2026: As of early January 2026, Solana recorded an all-time low of $0.03171 on January 5, 2026. Both assets have experienced notable price fluctuations during this period.
-
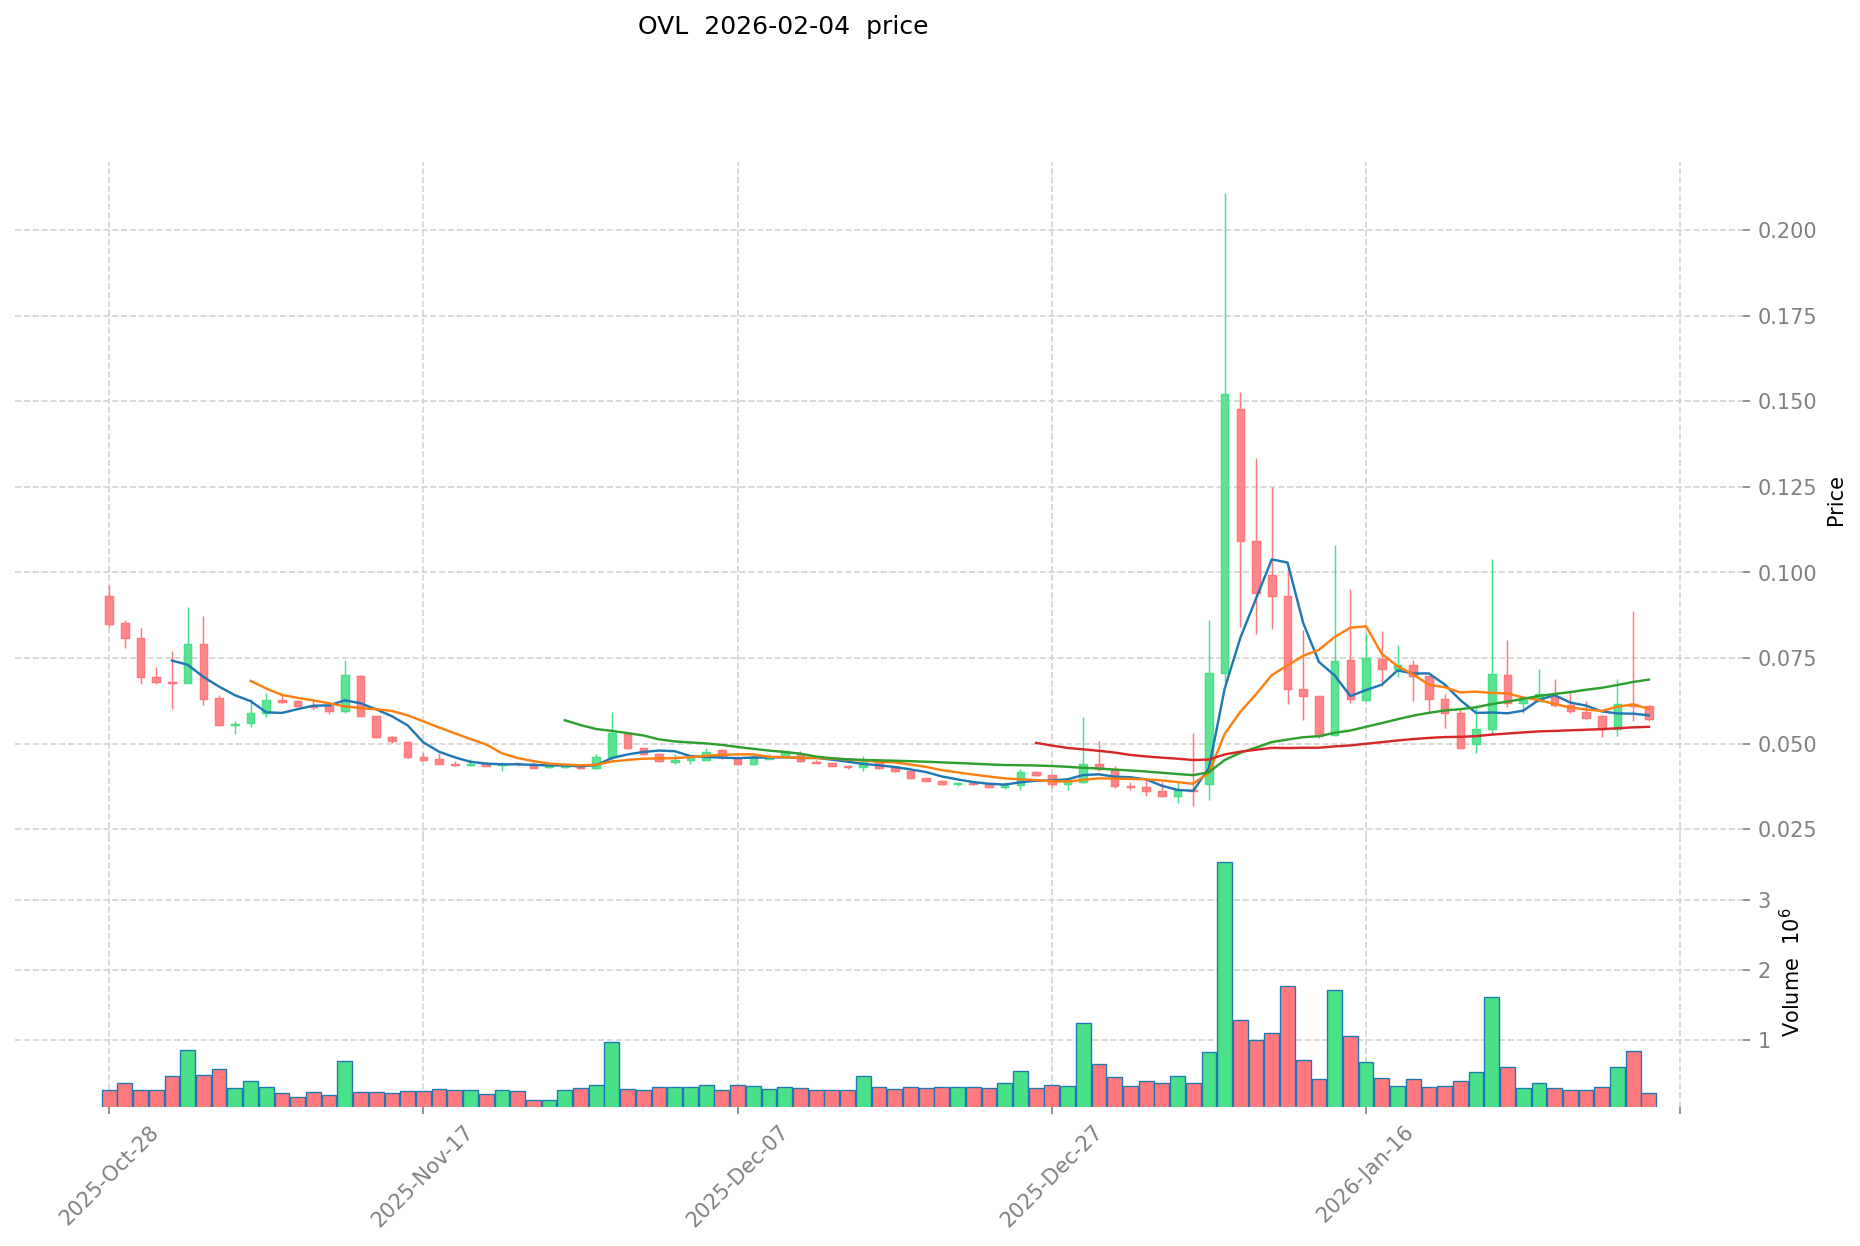
Comparative Analysis: During the 2025-2026 market cycle, OVL declined from its high of $0.5 (recorded on August 14, 2025) to a low of $0.03171, while SOL experienced a decline from its peak of $293.31 to lower price levels, reflecting broader market corrections.
Current Market Status (February 4, 2026)
- OVL Current Price: $0.05708
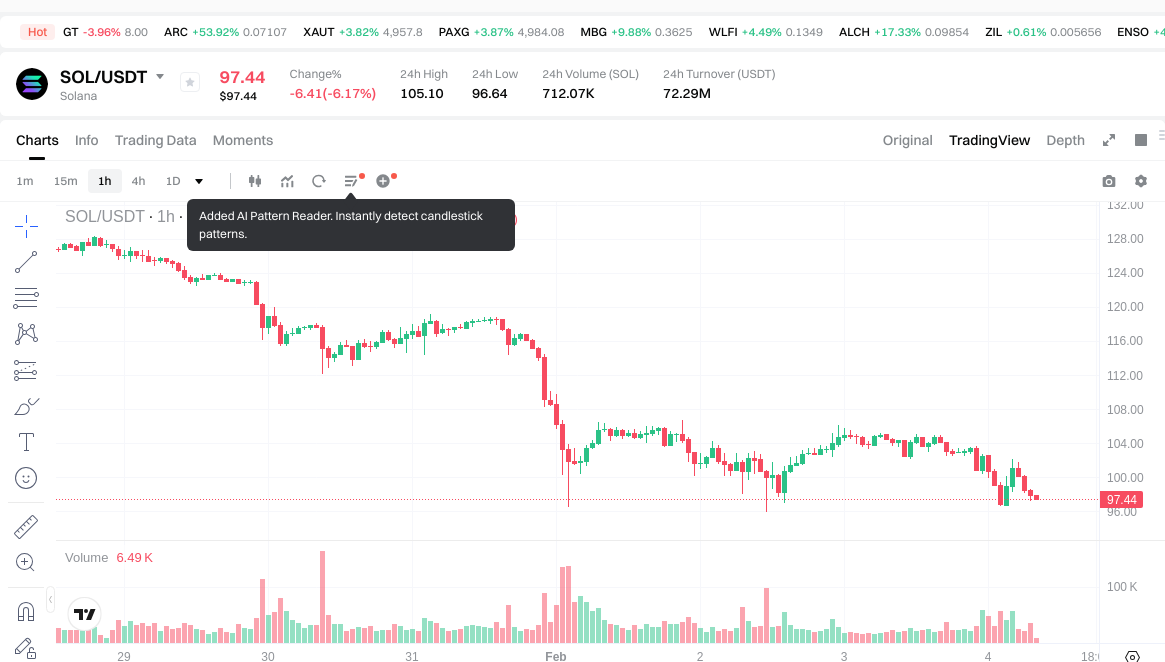
- SOL Current Price: $97.6
- 24-Hour Trading Volume: OVL recorded $14,364.32 vs SOL with $72,158,848.78
- Market Sentiment Index (Fear & Greed Index): 17 (Extreme Fear)
View real-time prices:
- Check current OVL price Market Price
- Check current SOL price Market Price
II. Core Factors Influencing Investment Value: OVL vs SOL
Supply Mechanism Comparison (Tokenomics)
-
SOL: Solana employs an inflationary model with an initial inflation rate that decreases over time, eventually stabilizing at 1.5% annually. The network uses a Delegated Proof of Stake (DPoS) combined with Proof of History (PoH) consensus mechanism. Token distribution included allocations to the foundation, core contributors, and investors. As of recent data, SOL's circulating supply continues to expand gradually under this controlled inflation schedule.
-
OVL: Information regarding OVL's supply mechanism remains limited in the provided materials. Without specific data on supply cap, inflation rate, or distribution model, a direct comparison cannot be established.
-
📌 Historical Pattern: Supply mechanisms fundamentally shape price cycle dynamics. Networks with deflationary or capped supply models historically demonstrate different volatility patterns compared to inflationary models, particularly during periods of heightened network activity or market speculation.
Institutional Adoption and Market Application
-
Institutional Holdings: SOL has gained attention from institutional investors, evidenced by BlackRock's BUIDL fund expansion to Solana following Ethereum. Market predictions suggest SOL has a potential path toward spot ETF approval in the United States, with probability estimates reaching notable levels on prediction markets.
-
Enterprise Adoption: Solana demonstrates practical applications across DeFi, GameFi, NFT platforms, payment systems, and DAO governance structures. The network's low transaction fees (averaging approximately $0.002) position it favorably for micropayments and high-frequency applications. OVL's enterprise adoption status cannot be assessed from available materials.
-
Regulatory Landscape: Different jurisdictions maintain varying regulatory postures toward blockchain networks. SOL's potential ETF approval would represent regulatory recognition in major markets, potentially opening institutional and retail access channels. Specific regulatory positions toward OVL were not found in reference materials.
Technical Development and Ecosystem Construction
-
SOL Technical Upgrades: Solana has addressed historical network stability concerns, recording zero downtime since February 2024. The network continues advancing with client diversity initiatives, including development of Firedancer by Jump Crypto and Sig by Syndica, which aim to enhance decentralization. Communication layer improvements like DoubleZero represent ongoing performance optimization efforts.
-
OVL Technical Development: Technical roadmap details for OVL are not available in provided materials.
-
Ecosystem Comparison: Solana hosts over 180 decentralized applications spanning DeFi, NFT marketplaces, and gaming platforms. The network's Total Value Locked reached historical peaks exceeding $15 billion in early 2025, stabilizing around $10 billion subsequently. Solana ranks as the second-largest Layer 1 blockchain by TVL and demonstrates significant developer activity, becoming the preferred ecosystem for new developer onboarding in 2024. The network also leads in DePIN (Decentralized Physical Infrastructure Networks) with 46.5% of sector market capitalization. OVL's ecosystem development metrics could not be evaluated from reference sources.
Macroeconomic Environment and Market Cycles
-
Performance Under Inflation: Blockchain networks with established use cases and strong fundamentals may demonstrate resilience during inflationary periods, though correlations with traditional inflation hedges remain complex. SOL's performance characteristics under varying inflation scenarios would depend on multiple factors including network utilization, institutional flows, and broader risk asset sentiment.
-
Macroeconomic Monetary Policy: Interest rate adjustments and dollar index movements typically influence cryptocurrency markets through risk appetite channels. Higher rates generally pressure speculative assets, while dollar strength can create headwinds for digital assets priced in USD. Both factors affect market liquidity and investor positioning across crypto assets.
-
Geopolitical Factors: Cross-border transaction demand, international payment settlement needs, and geopolitical uncertainties can influence blockchain network adoption. Networks offering fast, low-cost international transfers may benefit from elevated geopolitical tensions or traditional payment system disruptions. Solana's technical specifications position it favorably for cross-border use cases, though actual geopolitical adoption patterns require ongoing monitoring.
III. 2026-2031 Price Forecast: OVL vs SOL
Short-term Forecast (2026)
- OVL: Conservative $0.0325-$0.0571 | Optimistic $0.0571-$0.0850
- SOL: Conservative $62.44-$97.56 | Optimistic $97.56-$140.49
Medium-term Forecast (2028-2029)
- OVL may enter a growth phase, with estimated prices ranging from $0.0637 to $0.1370
- SOL may enter a consolidation phase, with estimated prices ranging from $91.69 to $175.73
- Key drivers: institutional capital flows, ETF developments, ecosystem expansion
Long-term Forecast (2030-2031)
- OVL: Baseline scenario $0.0671-$0.1405 | Optimistic scenario $0.1405-$0.2060
- SOL: Baseline scenario $126.71-$189.12 | Optimistic scenario $189.12-$220.64
Disclaimer
Price predictions are based on historical data analysis and market trends. Actual outcomes may vary significantly due to market volatility, regulatory changes, technological developments, and macroeconomic factors. This information does not constitute investment advice.
OVL:
| Year | Predicted High Price | Predicted Average Price | Predicted Low Price | Price Change |
|---|---|---|---|---|
| 2026 | 0.0850492 | 0.05708 | 0.0325356 | 0 |
| 2027 | 0.096647856 | 0.0710646 | 0.066800724 | 24 |
| 2028 | 0.1132059078 | 0.083856228 | 0.06373073328 | 46 |
| 2029 | 0.136958184381 | 0.0985310679 | 0.060103951419 | 72 |
| 2030 | 0.16248758407389 | 0.1177446261405 | 0.067114436900085 | 106 |
| 2031 | 0.205970674507576 | 0.140116105107195 | 0.102284756728252 | 145 |
SOL:
| Year | Predicted High Price | Predicted Average Price | Predicted Low Price | Price Change |
|---|---|---|---|---|
| 2026 | 140.4864 | 97.56 | 62.4384 | 0 |
| 2027 | 139.257144 | 119.0232 | 105.930648 | 21 |
| 2028 | 149.80259952 | 129.140172 | 91.68952212 | 32 |
| 2029 | 175.7339460576 | 139.47138576 | 126.9189610416 | 42 |
| 2030 | 220.64373227232 | 157.6026659088 | 148.146505954272 | 61 |
| 2031 | 196.6881270541824 | 189.12319909056 | 126.7125433906752 | 93 |
IV. Investment Strategy Comparison: OVL vs SOL
Long-term vs Short-term Investment Strategies
-
OVL: May appeal to investors with higher risk tolerance seeking exposure to emerging decentralized data derivatives protocols. The token's relatively early stage and limited available information suggest positioning suitable for speculative allocations within diversified portfolios. Given the nascent nature of the data derivatives sector, OVL investment horizons would typically extend beyond short-term trading cycles.
-
SOL: Demonstrates characteristics aligned with both medium and long-term investment approaches. Investors focusing on established Layer 1 blockchain infrastructure, DeFi ecosystem development, and institutional adoption trends may find SOL relevant to their portfolio construction. The network's technical performance improvements, developer activity metrics, and potential regulatory developments position it for consideration across various investment timeframes.
Risk Management and Asset Allocation
-
Conservative Investors: A potential allocation framework could consider SOL at 70-80% and OVL at 20-30% within the crypto portion of a broader portfolio. Conservative positioning emphasizes established networks with demonstrated utility and institutional recognition.
-
Aggressive Investors: Higher risk tolerance profiles might explore allocations of SOL at 40-50% and OVL at 50-60% within their crypto holdings. This approach accepts elevated volatility in exchange for potential asymmetric returns from emerging protocols.
-
Hedging Instruments: Risk management approaches include stablecoin reserves for opportunistic rebalancing, options strategies for downside protection, and cross-asset diversification across multiple blockchain networks and token categories.
V. Comparative Risk Analysis
Market Risk
-
OVL: Limited trading volume ($14,364.32 in 24-hour period) indicates constrained liquidity, potentially resulting in wider bid-ask spreads and elevated price volatility during portfolio rebalancing. The token's correlation with broader market cycles remains unclear due to limited historical data.
-
SOL: While demonstrating substantially higher liquidity ($72,158,848.78 in 24-hour volume), SOL remains subject to cryptocurrency market correlation risk. The network experienced notable drawdowns from peak valuations, with prices declining from $293.31 to lower levels during market corrections. Institutional flows and ETF developments could influence volatility patterns.
Technical Risk
-
OVL: Technical architecture details, security audit status, and smart contract risk assessments could not be evaluated from available materials. Protocol maturity and battle-testing remain unknown factors.
-
SOL: The network has addressed historical stability concerns, recording continuous uptime since February 2024. Client diversity initiatives including Firedancer and Sig development aim to reduce single-client dependencies. Communication layer upgrades like DoubleZero represent ongoing technical refinement. However, network complexity and high throughput design introduce technical maintenance requirements.
Regulatory Risk
- Regulatory treatment varies across jurisdictions. SOL's potential path toward ETF approval in certain markets represents possible regulatory recognition, though approval timelines and conditions remain uncertain. Networks classified differently under securities regulations face varying operational constraints. OVL's regulatory positioning across major jurisdictions could not be assessed from reference materials. Evolving global regulatory frameworks introduce ongoing compliance considerations for both assets.
VI. Conclusion: Which Is the Better Buy?
📌 Investment Value Summary:
-
OVL Characteristics: Represents exposure to decentralized data derivatives innovation with a dynamic mint-and-burn token model. Limited available information constrains comprehensive evaluation. Suitable for investors seeking early-stage protocol exposure within risk-appropriate portfolio allocations.
-
SOL Characteristics: Established Layer 1 blockchain with demonstrated ecosystem development, including 180+ decentralized applications and leadership in DePIN sector (46.5% market share). Network improvements addressing historical stability concerns and client diversity initiatives represent technical progression. Institutional interest signals and potential ETF pathways indicate evolving market positioning.
✅ Investment Considerations:
-
Newer Market Participants: May prioritize networks with established track records, comprehensive documentation, and broader liquidity profiles. Understanding fundamental blockchain concepts, risk management principles, and portfolio sizing discipline remains essential before allocating capital.
-
Experienced Market Participants: Could evaluate both assets within broader portfolio construction frameworks, considering correlation characteristics, rebalancing thresholds, and risk-adjusted return expectations. Due diligence regarding protocol mechanics, competitive positioning, and catalyst timelines informs allocation decisions.
-
Institutional Participants: Assessment criteria typically encompass custody infrastructure availability, regulatory classification clarity, liquidity depth for position scaling, and integration with existing portfolio management systems. SOL's institutional adoption indicators and potential ETF developments may align with certain institutional mandate requirements.
⚠️ Risk Notice: Cryptocurrency markets exhibit elevated volatility. Price predictions involve significant uncertainty. This analysis does not constitute investment recommendations. Participants should conduct independent research, assess personal risk tolerance, and consider consulting qualified financial advisors before making investment decisions.
VII. FAQ
Q1: What are the main differences between OVL and SOL in terms of their core functionality?
SOL serves as a high-performance Layer 1 blockchain protocol, while OVL functions as a decentralized data derivatives protocol token. SOL provides infrastructure for decentralized applications across DeFi, NFT, gaming, and payment systems, processing transactions through its Delegated Proof of Stake and Proof of History consensus mechanism. OVL enables on-chain trading of real-world metrics (such as ETH burn rates, streaming statistics, and gaming assets) without counterparties, utilizing a dynamic mint-and-burn token model. The fundamental distinction lies in SOL operating as foundational blockchain infrastructure versus OVL facilitating derivatives trading on specific data feeds.
Q2: How do the liquidity profiles of OVL and SOL compare for investors?
SOL demonstrates significantly higher liquidity with $72,158,848.78 in 24-hour trading volume compared to OVL's $14,364.32. This substantial difference means SOL investors can execute larger position sizes with minimal price impact, while OVL traders may encounter wider bid-ask spreads and elevated price volatility during order execution. For portfolio rebalancing or position exits, SOL's deeper liquidity provides more favorable execution conditions, particularly during periods of market stress. Investors considering OVL should account for potential slippage costs and longer timeframes required for position adjustments.
Q3: What is Solana's track record regarding network stability and technical reliability?
Solana has demonstrated continuous uptime since February 2024, addressing previous stability concerns that affected the network. The blockchain has implemented client diversity initiatives, including Firedancer development by Jump Crypto and Sig by Syndica, to reduce single-client dependencies and enhance decentralization. Communication layer improvements such as DoubleZero represent ongoing performance optimization. While the network's high-throughput architecture requires ongoing technical maintenance, these developments indicate progress toward improved reliability. Historical downtime events occurred prior to 2024, but recent operational metrics show sustained network availability.
Q4: How does the institutional adoption landscape differ between OVL and SOL?
SOL has secured notable institutional attention, evidenced by BlackRock's BUIDL fund expansion to the Solana network following Ethereum. Market indicators suggest potential pathways toward spot ETF approval in certain jurisdictions, with prediction markets assigning meaningful probabilities to such developments. The network's enterprise applications span multiple sectors including decentralized finance, gaming, and payment infrastructure. OVL's institutional adoption status cannot be adequately assessed from available information, with limited documentation regarding enterprise partnerships, institutional holdings, or regulatory engagement. This disparity in institutional recognition represents a significant differentiation factor between the two assets.
Q5: What risk factors should investors consider when evaluating OVL versus SOL?
Both assets face cryptocurrency market volatility, but risk profiles differ substantially. SOL carries technical complexity risk despite recent stability improvements, regulatory classification uncertainty across jurisdictions, and correlation with broader crypto market cycles. OVL presents limited liquidity risk with constrained trading volumes, insufficient publicly available information regarding technical architecture and security audits, unclear regulatory positioning, and early-stage protocol maturity. SOL's established ecosystem and higher liquidity partially mitigate certain risks, while OVL's nascent status introduces elevated uncertainty. Investors should assess these factors within their personal risk tolerance frameworks.
Q6: How do the supply mechanisms of OVL and SOL impact long-term value dynamics?
SOL employs an inflationary tokenomics model with decreasing inflation rates that stabilize at 1.5% annually, creating predictable supply expansion under a Delegated Proof of Stake consensus framework. This controlled inflation incentivizes network validators while gradually increasing circulating supply. OVL utilizes a dynamic mint-and-burn mechanism tied to its data derivatives protocol, though specific parameters regarding supply caps, inflation schedules, or distribution models remain unclear from available materials. The mint-and-burn approach theoretically creates supply responsiveness to protocol activity, potentially generating deflationary pressure during high utilization periods. These contrasting supply mechanics fundamentally shape price cycle characteristics and long-term scarcity dynamics.
Q7: What portfolio allocation strategies might investors consider for OVL and SOL exposure?
Conservative investors seeking crypto exposure might consider allocating 70-80% to SOL and 20-30% to OVL within their digital asset allocation, emphasizing established infrastructure over emerging protocols. Aggressive investors with higher risk tolerance could explore 40-50% SOL and 50-60% OVL allocations, accepting elevated volatility for potential asymmetric returns from early-stage opportunities. Both approaches assume these percentages represent only the crypto portion of a broader diversified portfolio. Risk management should incorporate stablecoin reserves for opportunistic rebalancing, options strategies for downside protection, and cross-asset diversification across multiple blockchain networks. Individual circumstances including investment timeframe, liquidity needs, and risk capacity should guide allocation decisions rather than prescriptive frameworks.
Q8: What factors could influence OVL and SOL price trajectories through 2031?
Multiple variables will shape long-term price dynamics for both assets. For SOL, institutional capital flows, potential ETF approvals, ecosystem expansion metrics (developer activity, TVL growth, DApp adoption), technical upgrade implementations, and regulatory clarity across major jurisdictions represent key drivers. Macroeconomic conditions including interest rate environments, dollar strength, and risk asset sentiment will influence both tokens. For OVL, protocol adoption rates, trading volume growth on the data derivatives platform, competitive positioning within the decentralized derivatives sector, and broader acceptance of on-chain data trading concepts will prove critical. Network effects, technological developments, and unforeseen market catalysts introduce significant uncertainty into any long-term forecast framework.
Share
Content
Introduction: Investment Comparison Between OVL and SOL
I. Historical Price Comparison and Current Market Status
II. Core Factors Influencing Investment Value: OVL vs SOL
III. 2026-2031 Price Forecast: OVL vs SOL
IV. Investment Strategy Comparison: OVL vs SOL
V. Comparative Risk Analysis
VI. Conclusion: Which Is the Better Buy?
VII. FAQ
How to Buy Cryptocurrency


Trending Cryptocurrencies


What Is a Phantom Wallet: A Guide for Solana Users in 2025

Solana Price in 2025: SOL Token Analysis and Market Outlook

How Does Solana's Proof of History Work?

Solana (SOL) : Low Fees, Memecoins, and the way to moon

Is Solana a Good Investment?

Solana in 2025: Ecosystem Growth and DeFi Dominance

What is MOBI: A Comprehensive Guide to Amazon's E-Book File Format and Its Uses
What is ALMANAK: A Comprehensive Guide to Digital Calendar and Event Management Systems
Proof of Work vs Proof of Stake: Which Is Superior?
What is RWAINC: A Comprehensive Guide to Real-World AI and Networking Capabilities
The Most Promising Cryptocurrencies: Where to Invest