SDN vs SOL: Understanding the Key Differences Between Software-Defined Networking and Service-Oriented Landscape

Introduction: Investment Comparison Between SDN and SOL
In the cryptocurrency market, the comparison between SDN and SOL has consistently been a topic of interest for investors. Both assets exhibit notable differences in market capitalization ranking, application scenarios, and price performance, representing distinct positioning within the crypto asset landscape.
Shiden Network (SDN): Launched in 2021, Shiden Network has positioned itself as a multi-chain decentralized application layer on Kusama Network, supporting Ethereum Virtual Machine, WebAssembly, and Layer2 solutions for applications including DeFi and NFT.
Solana (SOL): Established in 2018 by former engineers from Qualcomm, Intel, and Dropbox, Solana has been recognized as a high-performance blockchain protocol focused on providing scalability without compromising decentralization or security.
This article will provide a comprehensive analysis of the investment value comparison between SDN and SOL, examining historical price trends, supply mechanisms, institutional adoption, technological ecosystems, and future projections, while attempting to address the question that concerns investors:
"Which is the better buy right now?"
I. Historical Price Comparison and Current Market Status
Historical Price Trends of SDN (Coin A) and SOL (Coin B)
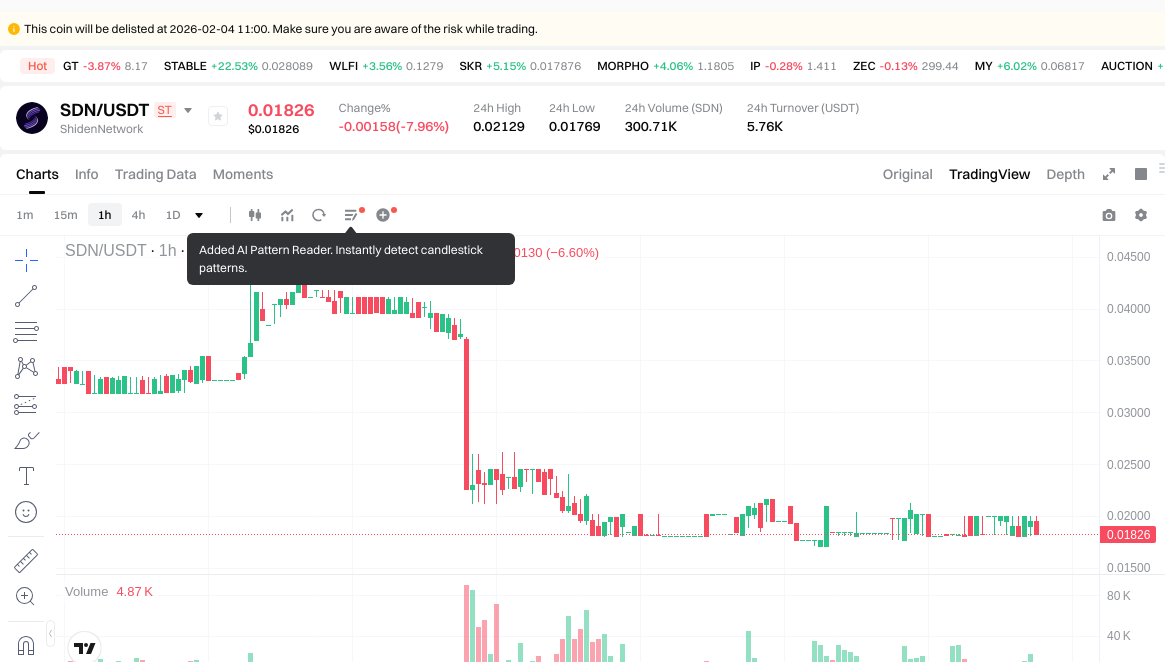
- 2021: SDN experienced a significant upward movement, with its price reaching a peak of $8.36 in September 2021. This period reflected increased activity within the Kusama ecosystem.
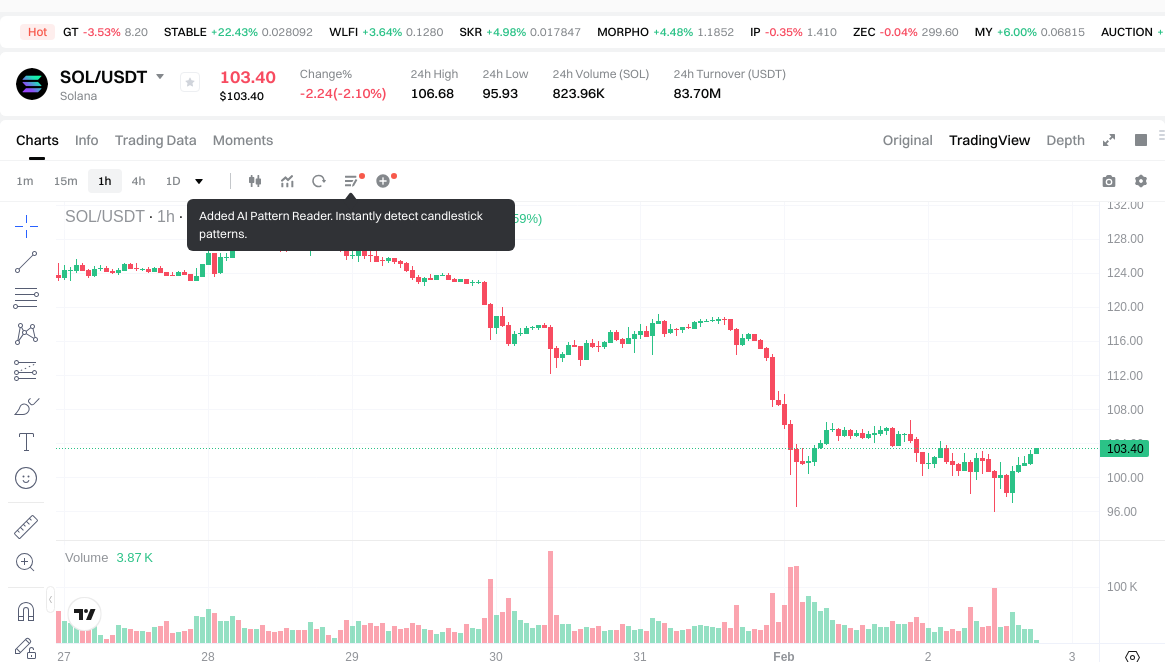
- 2021: SOL benefited from substantial ecosystem growth and adoption, with its price rising to approximately $253 in November 2021, driven by the broader crypto market momentum and increased developer activity.
- Comparative analysis: During the market cycle from late 2021 to early 2026, SDN declined from its high of $8.36 to $0.02, representing a substantial correction. Meanwhile, SOL experienced similar volatility, falling from its previous highs but maintaining relatively stronger market positioning.
Current Market Status (2026-02-02)
- SDN current price: $0.02
- SOL current price: $103.18
- 24-hour trading volume: SDN recorded $5,671.90, while SOL registered $83,925,268.14
- Market Sentiment Index (Fear & Greed Index): 14 (Extreme Fear)
View real-time prices:
- Check SDN current price Market Price
- Check SOL current price Market Price
II. Core Factors Affecting SDN vs SOL Investment Value
Supply Mechanism Comparison (Tokenomics)
-
SOL: Solana employs an inflationary token model with an initial inflation rate that decreases over time. The network's tokenomics are designed to balance validator incentives with long-term supply stability, with an estimated annual inflation rate of approximately 0.22% following network upgrades.
-
SDN: Information regarding SDN's supply mechanism is not available in the provided materials.
-
📌 Historical Pattern: Supply mechanisms can significantly influence price cycles, with deflationary or fixed-supply models typically associated with potential scarcity-driven value appreciation, while inflationary models may face downward pressure without corresponding demand growth.
Institutional Adoption and Market Application
-
Institutional Holdings: SOL has attracted notable attention from institutional investors, including hedge funds and family offices that have begun incorporating SOL into their investment portfolios. Reference materials indicate growing institutional capital inflows, particularly through crypto-focused investment vehicles.
-
Enterprise Adoption: SOL demonstrates substantial application across DeFi protocols (such as Raydium and Serum), NFT platforms, and Web3 infrastructure. The network's low transaction costs and high throughput have attracted developers and users in these sectors. Enterprise adoption information for SDN is not available in the provided materials.
-
National Policies: Regulatory frameworks continue to evolve globally, with various jurisdictions developing compliance requirements for digital assets. Monitoring regulatory developments remains essential for assessing long-term viability.
Technology Development and Ecosystem Building
-
SOL Technology Upgrades: Solana utilizes an innovative consensus mechanism combining Proof of History (PoH) with Proof of Stake (PoS), enabling the network to process thousands of transactions per second. The platform's architecture focuses on increasing throughput and reducing latency. However, the network has encountered stability challenges and security incidents that have affected user confidence.
-
SDN Technology Development: Specific information regarding SDN's technological framework is not available in the provided materials.
-
Ecosystem Comparison: Solana has established a robust ecosystem encompassing DeFi applications, NFT marketplaces, and Web3 projects. Data indicates that Solana maintains approximately 5 million daily active users, with substantial transaction volumes across decentralized exchanges. The platform has attracted various projects, including DePIN initiatives and AI Agent deployments. Comparative ecosystem information for SDN is not available.
Macroeconomic Environment and Market Cycles
-
Performance in Inflationary Environments: Digital assets demonstrate varying responses to macroeconomic conditions. Materials suggest that during periods of market uncertainty, certain assets may serve as alternative stores of value, though market volatility remains significant.
-
Macroeconomic Monetary Policy: Interest rate adjustments, US dollar index movements, and broader monetary policy shifts can influence crypto asset valuations. Market sentiment remains sensitive to these factors.
-
Geopolitical Factors: Cross-border transaction demand and international developments may affect adoption patterns, though specific impacts vary by asset and use case.
III. 2026-2031 Price Forecast: SDN vs SOL
Short-term Forecast (2026)
- SDN: Conservative $0.0161 - $0.0183 | Optimistic $0.0183 - $0.0217
- SOL: Conservative $86.70 - $103.22 | Optimistic $103.22 - $106.32
Medium-term Forecast (2028-2029)
- SDN may enter a gradual recovery phase, with estimated price range of $0.0139 - $0.0256 in 2028 and $0.0219 - $0.0332 in 2029
- SOL may enter a growth expansion phase, with estimated price range of $62.19 - $145.48 in 2028 and $67.98 - $146.23 in 2029
- Key drivers: institutional capital inflows, ETF developments, ecosystem expansion
Long-term Forecast (2030-2031)
- SDN: Base scenario $0.0256 - $0.0281 (2030), $0.0165 - $0.0305 (2031) | Optimistic scenario $0.0329 (2030), $0.0449 (2031)
- SOL: Base scenario $105.68 - $137.25 (2030), $88.79 - $155.77 (2031) | Optimistic scenario $174.30 (2030), $176.03 (2031)
Disclaimer
Price predictions are based on historical data analysis and market trend assessments. Cryptocurrency markets are highly volatile and subject to various risk factors. These forecasts do not constitute investment advice. Users should conduct independent research and risk assessment before making any investment decisions.
SDN:
| Year | Predicted High Price | Predicted Average Price | Predicted Low Price | Price Change |
|---|---|---|---|---|
| 2026 | 0.0217294 | 0.01826 | 0.0160688 | -8 |
| 2027 | 0.020994435 | 0.0199947 | 0.015595866 | 0 |
| 2028 | 0.025618209375 | 0.0204945675 | 0.0139363059 | 2 |
| 2029 | 0.03320119935 | 0.0230563884375 | 0.021903569015625 | 15 |
| 2030 | 0.032910688855687 | 0.02812879389375 | 0.025597202443312 | 40 |
| 2031 | 0.044864019820836 | 0.030519741374718 | 0.016480660342348 | 52 |
SOL:
| Year | Predicted High Price | Predicted Average Price | Predicted Low Price | Price Change |
|---|---|---|---|---|
| 2026 | 106.3166 | 103.22 | 86.7048 | 0 |
| 2027 | 117.340496 | 104.7683 | 61.813297 | 1 |
| 2028 | 145.48126138 | 111.054398 | 62.19046288 | 8 |
| 2029 | 146.2253258466 | 128.26782969 | 67.9819497357 | 24 |
| 2030 | 174.303153765741 | 137.2465777683 | 105.679864881591 | 33 |
| 2031 | 176.025598316733165 | 155.7748657670205 | 88.791673487201685 | 51 |
IV. Investment Strategy Comparison: SDN vs SOL
Long-term vs Short-term Investment Strategies
-
SDN: May appeal to investors with a high risk tolerance seeking opportunities in emerging multi-chain application platforms, though current trading volumes and market positioning suggest limited near-term momentum.
-
SOL: May suit investors interested in established blockchain ecosystems with demonstrated developer activity, substantial DeFi and NFT infrastructure, and institutional interest, while maintaining awareness of network stability considerations.
Risk Management and Asset Allocation
-
Conservative Investors: A potential allocation framework might consider SOL 10-15% as part of a diversified crypto portfolio, with minimal or no exposure to SDN given its current market dynamics. The majority allocation should remain in traditional assets or stablecoins.
-
Aggressive Investors: May allocate SOL 20-30% within their crypto portfolio, with speculative positions in assets like SDN not exceeding 1-2% if pursued at all, recognizing the elevated risk profile.
-
Hedging Tools: Portfolio protection strategies may include stablecoin reserves (30-50% of crypto allocation), options contracts for downside protection, and cross-asset diversification across multiple blockchain ecosystems to mitigate concentration risk.
V. Potential Risk Comparison
Market Risks
-
SDN: Faces substantial market liquidity challenges, with 24-hour trading volume of $5,671.90 indicating limited market depth. Price volatility remains elevated, and recovery potential depends on broader ecosystem developments within Kusama Network that are currently uncertain.
-
SOL: Subject to broader crypto market cycles and sentiment shifts, as reflected in the current Fear & Greed Index of 14 (Extreme Fear). Historical price corrections demonstrate significant volatility, with movements influenced by macroeconomic conditions, institutional flows, and competitive dynamics within the Layer 1 blockchain landscape.
Technical Risks
-
SDN: Specific technical risk factors are not available in the provided materials, though general considerations for emerging blockchain projects include scalability challenges, network adoption barriers, and ecosystem development uncertainties.
-
SOL: Network stability incidents have historically affected user confidence and operational continuity. The platform's high-performance architecture, while enabling substantial throughput, has encountered technical challenges requiring ongoing development attention. Security considerations remain relevant for any blockchain infrastructure.
Regulatory Risks
- Regulatory frameworks continue to evolve across jurisdictions, with varying approaches to digital asset classification, trading requirements, and compliance standards. Both SDN and SOL face potential impacts from regulatory developments, though assets with greater institutional adoption and clearer use cases may encounter more defined regulatory pathways. Monitoring policy changes across major markets remains essential for risk assessment.
VI. Conclusion: Which Is the Better Buy?
📌 Investment Value Summary:
-
SDN Considerations: Currently trading at $0.02 with limited market liquidity and trading volume, SDN presents a speculative opportunity that requires careful evaluation of risk tolerance and portfolio objectives. The asset's potential recovery depends on factors not clearly established in current market conditions.
-
SOL Strengths: Demonstrates established infrastructure with approximately 5 million daily active users, substantial ecosystem development across DeFi and NFT sectors, growing institutional interest, and technological innovation through its Proof of History consensus mechanism. The network maintains active developer engagement and cross-sector applications.
✅ Investment Considerations:
-
Novice Investors: May consider beginning with educational research into blockchain fundamentals before allocation decisions. If pursuing crypto exposure, focusing on established assets with demonstrated use cases and liquidity may align with risk management principles. Any investment should represent only a small portion of overall portfolio, with thorough understanding of volatility implications.
-
Experienced Investors: Could evaluate SOL within a diversified crypto allocation strategy, considering factors including technological development trajectory, ecosystem growth metrics, institutional adoption trends, and correlation with broader market cycles. Position sizing should reflect individual risk parameters and portfolio objectives. SDN allocation would require acceptance of elevated speculation risk.
-
Institutional Investors: May assess SOL as part of digital asset allocation frameworks, incorporating due diligence on regulatory compliance, custody solutions, liquidity profiles, and integration with existing investment mandates. Consideration of blockchain infrastructure exposure should align with institutional risk management protocols and fiduciary responsibilities.
⚠️ Risk Disclosure: Cryptocurrency markets exhibit extreme volatility and are subject to various risk factors including market, technical, regulatory, and liquidity risks. This analysis does not constitute investment advice, financial recommendation, or solicitation to buy or sell any asset. Investors should conduct independent research, assess personal risk tolerance, and consult qualified financial advisors before making investment decisions. Past performance does not indicate future results.
VII. FAQ
Q1: What is the main difference between SDN and SOL in terms of market positioning?
SOL operates as an established Layer 1 blockchain with substantial institutional adoption and daily active users exceeding 5 million, while SDN functions as a multi-chain application layer on Kusama Network with significantly lower market liquidity and trading volume ($5,671.90 vs $83,925,268.14 in 24-hour volume). The fundamental distinction lies in SOL's position as a high-performance blockchain infrastructure protocol versus SDN's role as an application-focused platform within a specific ecosystem. SOL demonstrates broader market recognition, institutional capital inflows, and extensive ecosystem development across DeFi, NFT, and Web3 sectors, whereas SDN remains concentrated within the Kusama ecosystem with limited visibility in current market conditions.
Q2: Which asset presents lower risk for conservative investors?
SOL presents comparatively lower risk due to established market infrastructure, demonstrated liquidity depth, institutional adoption patterns, and operational ecosystem with measurable user activity. Conservative investors considering crypto exposure might evaluate SOL at 10-15% of their crypto portfolio allocation as part of a diversified strategy, while maintaining the majority position in traditional assets or stablecoins. SDN's current trading volume of $5,671.90, combined with price decline from $8.36 to $0.02, indicates elevated speculation risk unsuitable for conservative investment profiles. Risk management principles suggest focusing on assets with demonstrated use cases, market depth, and established track records rather than speculative positions in lower-liquidity alternatives.
Q3: How do the supply mechanisms of SDN and SOL affect long-term investment value?
SOL employs an inflationary token model with decreasing inflation rate over time, currently estimated at approximately 0.22% annually following network upgrades. This mechanism balances validator incentives with long-term supply stability, potentially supporting sustained network security while minimizing excessive supply dilution. The structured inflation approach allows for predictable supply expansion aligned with network growth requirements. Information regarding SDN's supply mechanism remains unavailable in current materials, creating uncertainty for long-term valuation assessment. Generally, transparent and predictable supply mechanisms contribute to investor confidence, while unclear tokenomics may introduce additional risk factors. Investors evaluating long-term holdings should prioritize assets with well-documented supply frameworks that demonstrate alignment between token distribution and ecosystem development objectives.
Q4: What technological advantages does SOL offer compared to SDN?
SOL utilizes an innovative consensus mechanism combining Proof of History (PoH) with Proof of Stake (PoS), enabling processing of thousands of transactions per second with low latency and reduced transaction costs. This architectural design addresses scalability challenges that affect many blockchain protocols, supporting high-throughput applications across DeFi, NFT, and Web3 sectors. The platform's technical infrastructure has attracted substantial developer activity and ecosystem expansion, though historical network stability incidents indicate ongoing technical refinement requirements. Specific technical specifications for SDN are not available in provided materials, limiting direct comparison. However, Solana's demonstrated capability to support approximately 5 million daily active users with operational DeFi protocols and NFT marketplaces indicates practical implementation of technical advantages. Technological assessment should consider both theoretical capabilities and operational track records when evaluating blockchain infrastructure investments.
Q5: How should investors interpret the current Fear & Greed Index of 14 (Extreme Fear)?
The Fear & Greed Index reading of 14 indicates extreme fear sentiment across crypto markets, historically associated with potential market bottoms or continuation of downward trends depending on underlying fundamentals. Extreme fear conditions may present accumulation opportunities for assets with strong fundamentals, established use cases, and resilient ecosystems, though timing market sentiment remains challenging. SOL's current price of $103.18 during this sentiment phase reflects broader market pressure affecting most crypto assets regardless of individual project fundamentals. Contrarian investors might view extreme fear as potential entry points, while risk-averse participants may prefer waiting for sentiment stabilization and confirmation of trend reversal. Investment decisions should prioritize fundamental analysis over sentiment indicators alone, recognizing that extreme fear can persist or intensify before market recovery. Dollar-cost averaging strategies may help mitigate timing risk during volatile sentiment periods.
Q6: What factors should institutional investors prioritize when comparing SDN and SOL?
Institutional investors should prioritize regulatory compliance frameworks, custody solution availability, liquidity depth for position entry and exit, operational track record, and alignment with fiduciary responsibilities. SOL demonstrates institutional adoption indicators including hedge fund and family office participation, established custody infrastructure through major providers, sufficient market depth to support institutional-size allocations, and clearer regulatory classification pathways due to operational history. SDN's limited trading volume ($5,671.90 daily) presents significant challenges for institutional-size positions, creating execution difficulties and concentration risks. Additional institutional considerations include network security audit history, developer ecosystem sustainability, governance frameworks, and correlation profiles with traditional asset classes. Institutions must conduct comprehensive due diligence incorporating legal review, operational risk assessment, and integration planning with existing investment mandates before digital asset allocation decisions.
Q7: What are the key price prediction differences between SDN and SOL through 2031?
Price forecasts indicate divergent trajectories: SDN projects conservative range of $0.0160-$0.0449 through 2031 with gradual recovery assumptions, while SOL estimates range from $86.70-$176.03 over the same period reflecting stronger growth potential. SDN forecasts suggest limited near-term momentum with possible expansion in 2029-2031 contingent on ecosystem development factors not clearly established. SOL projections incorporate institutional capital inflows, ETF developments, and ecosystem expansion as potential growth drivers, though significant volatility remains embedded in estimates. The substantial difference in predicted ranges reflects current market positioning disparities, liquidity profiles, and adoption trajectories. Investors should recognize that cryptocurrency price predictions carry elevated uncertainty given market volatility, technological evolution, regulatory developments, and competitive dynamics. These forecasts provide potential scenarios rather than guaranteed outcomes and should not constitute sole basis for investment decisions.
Q8: How do network stability concerns affect SOL's investment thesis?
Historical network stability incidents affecting SOL represent operational risks requiring consideration within investment analysis, though they must be evaluated against ongoing development responses and ecosystem resilience. Network outages or performance degradation can impact user confidence, developer retention, and institutional adoption momentum in the short term. However, SOL's demonstrated ability to maintain approximately 5 million daily active users and substantial DeFi/NFT ecosystem activity following previous incidents indicates user base stability and recovery capability. Technical infrastructure development remains ongoing, with network upgrades aimed at addressing identified vulnerabilities. Investors should assess whether stability concerns represent temporary growing challenges within high-performance blockchain architecture or fundamental design limitations. Comparative analysis with alternative Layer 1 protocols regarding uptime, transaction finality, and operational continuity provides context for evaluating these risks within overall investment thesis and position sizing decisions.
Share
Content
Introduction: Investment Comparison Between SDN and SOL
I. Historical Price Comparison and Current Market Status
II. Core Factors Affecting SDN vs SOL Investment Value
III. 2026-2031 Price Forecast: SDN vs SOL
IV. Investment Strategy Comparison: SDN vs SOL
V. Potential Risk Comparison
VI. Conclusion: Which Is the Better Buy?
VII. FAQ
How to Buy Cryptocurrency


Trending Cryptocurrencies


2025 SUI coin: price, buying guide, and Staking rewards

How to Buy Crypto: A Step-by-Step Guide with Gate.com

HNT Price in 2025: Helium Network Token Value and Market Analysis

What is SwissCheese (SWCH) and How Does It Democratize Investment?

Cardano (ADA) Price Analysis and Outlook for 2025

How to Invest in Metaverse Crypto

Is NFT Dead? A Guide to NFT Use Cases

What Is an Airdrop in Cryptocurrency?

What is GMRT: Understanding the Giant Metrewave Radio Telescope and Its Role in Modern Astronomy
What is DEAI: Decentralized Ethical AI and Its Impact on the Future of Technology

What is LOULOU: A Comprehensive Guide to the Emerging Fashion and Lifestyle Brand