This comprehensive article compares SEI and OP, two distinct blockchain solutions competing for investor attention in the crypto market. SEI, launched in August 2023, functions as a Layer 1 blockchain specializing in trading infrastructure with current price of $0.1257, while OP operates as an Ethereum Layer 2 solution established in May 2022, trading at $0.3606. The analysis examines historical price trajectories, tokenomics mechanisms, institutional adoption patterns, and technological ecosystems to address critical investment questions. OP demonstrates superior ecosystem maturity with 327+ deployed DApps and $2.86 billion Total Value Locked, processing over 230 million transactions with 37% active address growth. SEI presents emerging infrastructure opportunities in decentralized exchange optimization. Through 2031 price predictions, investment strategy frameworks, and comprehensive risk assessments, this guide provides actionable insights for conservative, aggressive, and institutional investors evaluatin
Introduction: Investment Comparison Between SEI and OP
In the cryptocurrency market, the comparison between SEI vs OP has consistently been a topic of interest for investors. Both assets exhibit notable differences in market cap ranking, application scenarios, and price performance, while representing distinct positioning within the crypto asset landscape.
SEI: Launched in August 2023, this project positions itself as a Layer 1 blockchain dedicated to trading infrastructure, aiming to provide optimized exchange services for digital assets including gaming assets, social networking, and NFTs. Currently ranked #99 by market capitalization with a trading price of $0.1257.
OP (Optimism): Introduced in May 2022, this project functions as a low-cost, high-speed Ethereum Layer 2 blockchain solution designed to address scalability challenges. It ranks #110 by market capitalization with a current price of $0.3606.
This article will comprehensively analyze the investment value comparison between SEI vs OP through multiple dimensions including historical price trajectories, supply mechanisms, technical ecosystems, and future outlook, attempting to address investors' primary concern:
"Which asset presents a more compelling investment case based on current market conditions?"
I. Historical Price Comparison and Current Market Status
SEI vs OP Historical Price Trends
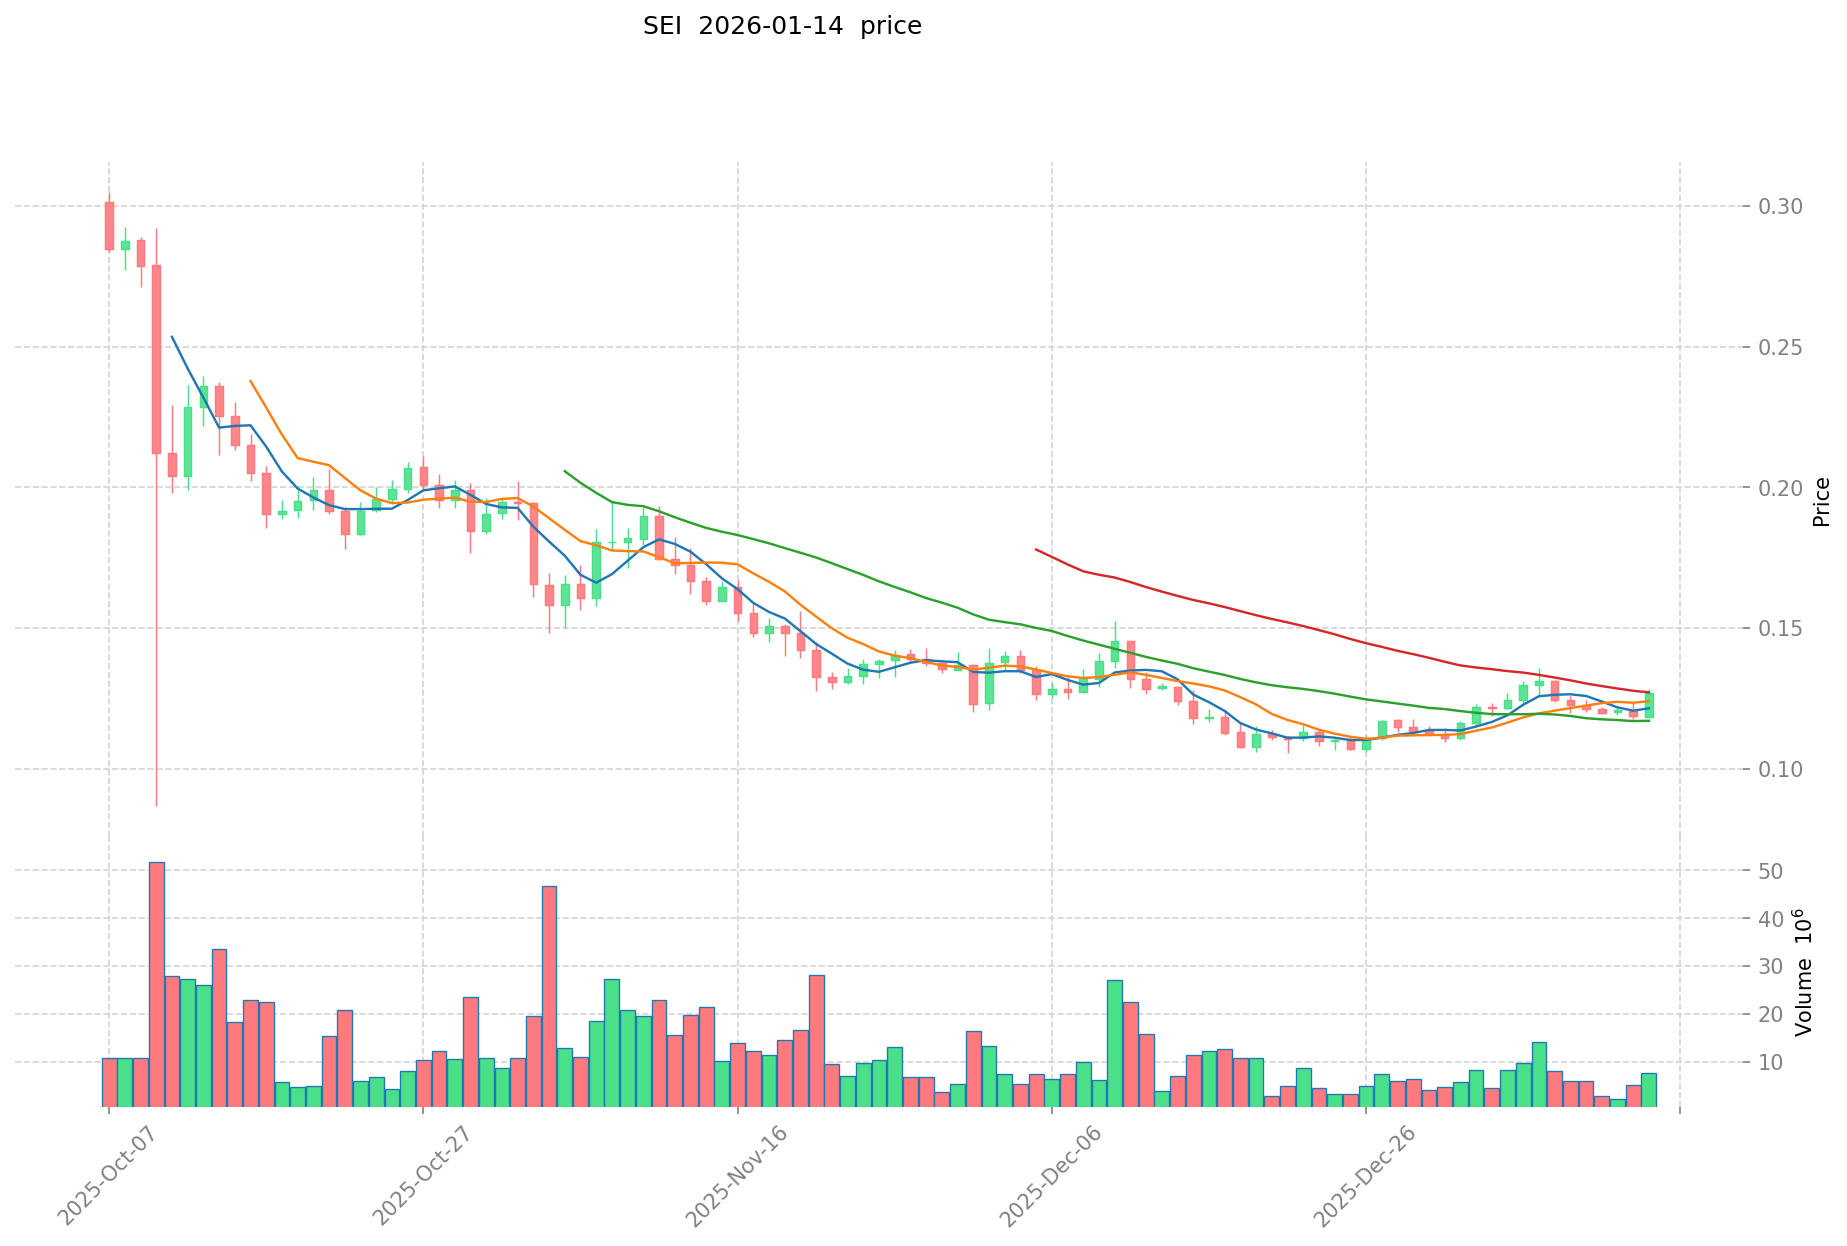
- 2024: SEI reached its all-time high of $1.14 on March 16, 2024, driven by market momentum during the broader crypto rally period.
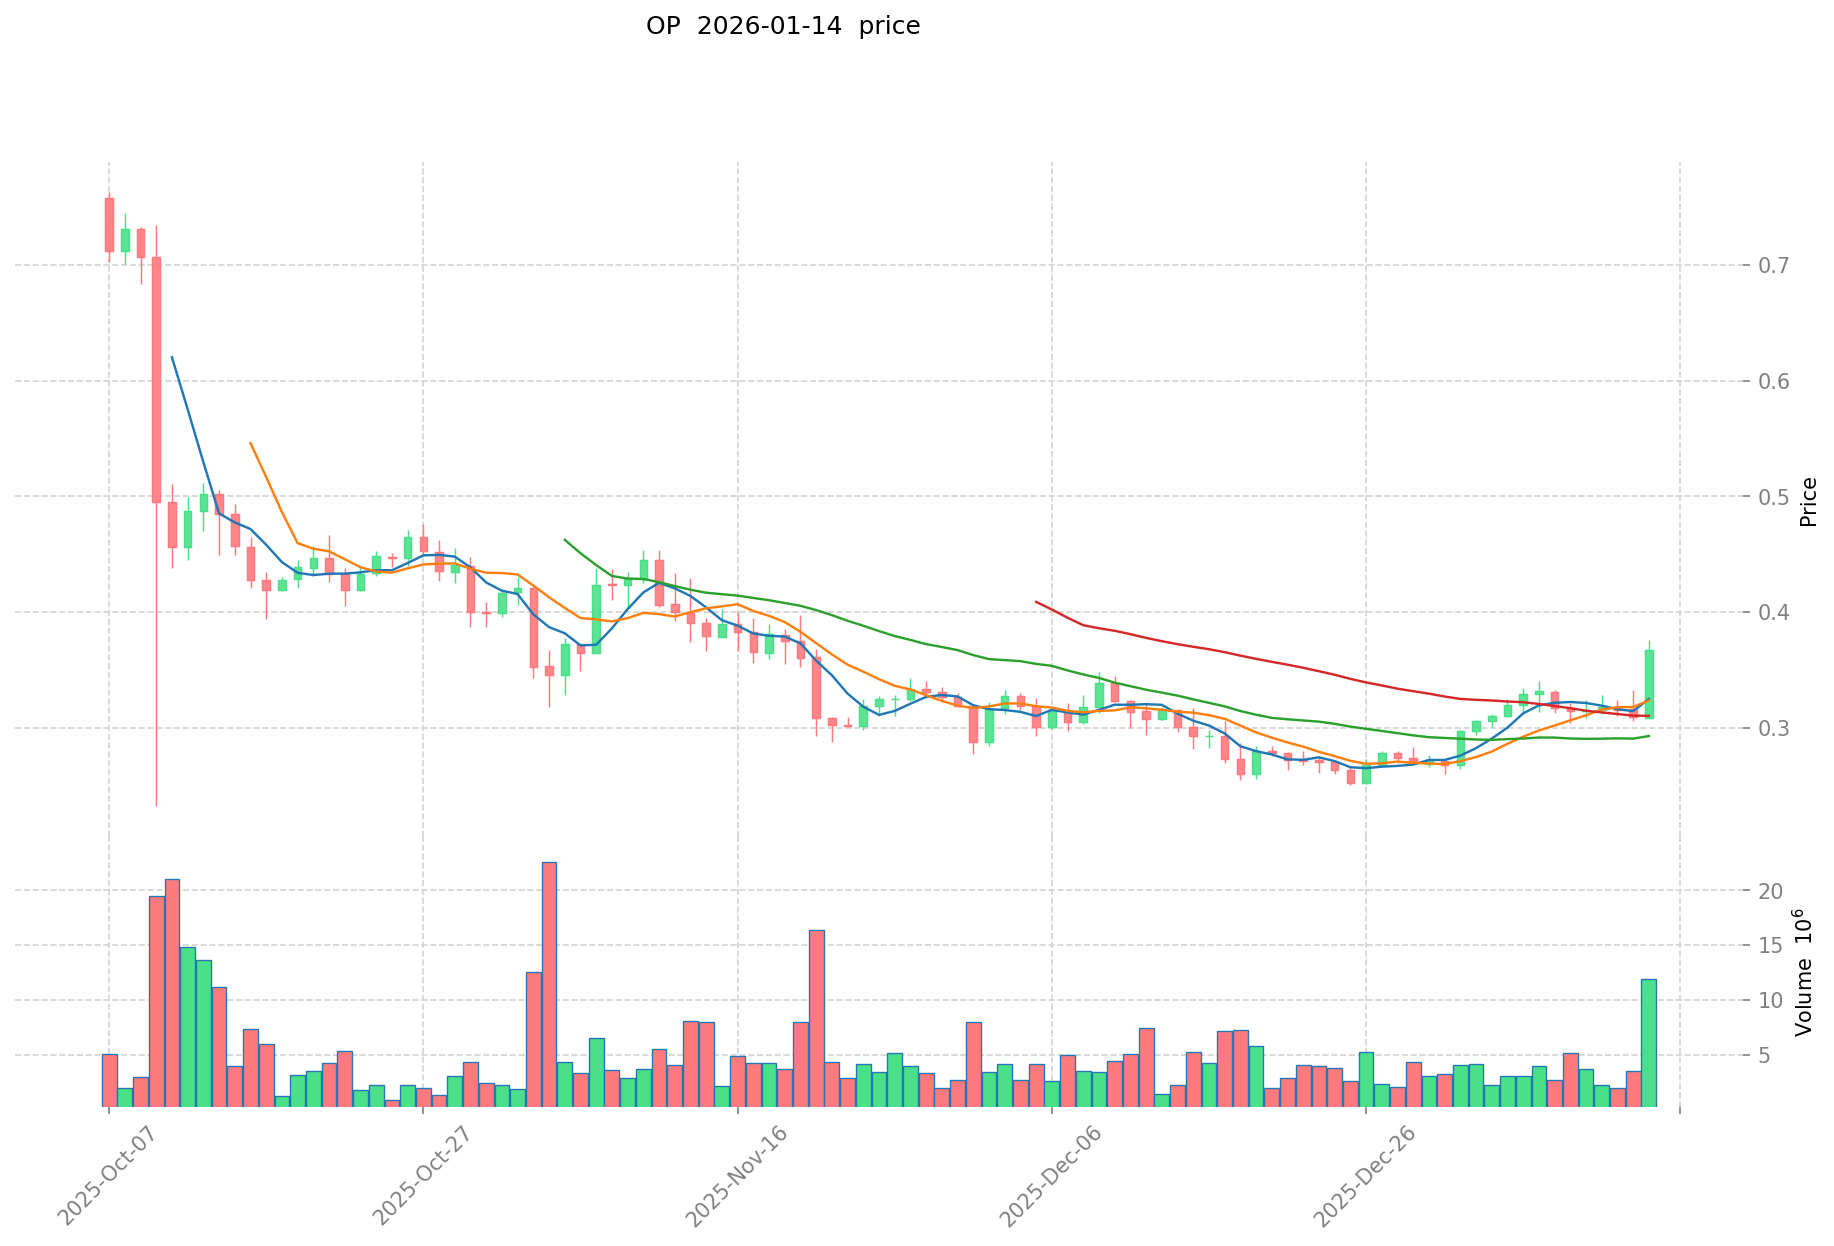
- 2024: OP achieved its historical peak of $4.84 on March 6, 2024, benefiting from increased adoption in the Ethereum Layer 2 ecosystem.
- Comparative analysis: During the 2024-2025 market cycle, SEI declined from its peak of $1.14 to a low of $0.0868 (recorded in October 2025), representing significant volatility. Meanwhile, OP experienced a similar downtrend, falling from $4.84 to $0.251922 (recorded in December 2025), showing comparable market pressure across Layer 1 and Layer 2 solutions.
Current Market Status (January 14, 2026)
- SEI current price: $0.1257
- OP current price: $0.3606
- 24-hour trading volume: SEI $1,213,238 vs OP $5,203,343
- Market sentiment index (Fear & Greed Index): 48 (Neutral)
Click to view real-time prices:
II. Core Factors Influencing SEI vs OP Investment Value
Supply Mechanism Comparison (Tokenomics)
-
SEI: Features a supply mechanism with specific allocations for ecosystem development, community incentives, and staking rewards. The tokenomics structure aims to balance growth with controlled inflation through mechanisms tied to network participation and validator incentives.
-
OP: Total supply of 4.29 billion tokens, with distribution allocated to ecosystem development, community incentives, and protocol development. The token distribution model emphasizes long-term ecosystem sustainability through structured release schedules.
-
📌 Historical Pattern: Supply mechanisms have historically influenced price cycles through unlock events and staking participation rates. Controlled token releases and ecosystem allocation strategies tend to correlate with sustained network activity and price stability during different market phases.
Institutional Adoption and Market Application
-
Institutional Holdings: Available data suggests varying levels of institutional interest in both assets. SEI has attracted attention from certain investment entities focusing on high-performance blockchain infrastructure, while OP benefits from its position within the Ethereum Layer-2 ecosystem, drawing interest from institutions invested in Ethereum scaling solutions.
-
Enterprise Adoption: SEI focuses on providing infrastructure for decentralized exchanges and trading applications, positioning itself for adoption in DeFi trading environments. OP serves as a scaling solution for Ethereum-based applications, with adoption spanning DeFi protocols, NFT platforms, and general-purpose decentralized applications seeking lower transaction costs.
-
Regulatory Landscape: Both projects operate within evolving regulatory frameworks. The regulatory approach varies by jurisdiction, with some regions showing more openness to Layer-1 innovations like SEI, while others focus on Layer-2 solutions like OP due to their connection to established networks like Ethereum.
Technology Development and Ecosystem Building
-
SEI Technical Upgrades: SEI implements optimistic parallelization strategies and performance optimizations aimed at improving transaction throughput and execution speed. The technical architecture focuses on order book efficiency and trading-specific optimizations, targeting high-frequency trading use cases.
-
OP Technical Development: OP utilizes Rollup technology to achieve approximately 90% reduction in gas fees compared to Ethereum mainnet, with theoretical TPS exceeding 2,000. The network has processed over 230 million transactions and continues to develop scaling infrastructure through collaborations with other Layer-2 projects.
-
Ecosystem Comparison: SEI's ecosystem centers on decentralized exchange infrastructure and trading applications, with development focused on DeFi trading efficiency. OP's ecosystem encompasses 327+ deployed DApps with Total Value Locked reaching $2.86 billion, covering diverse applications including DeFi protocols, NFT platforms, and smart contract applications. The active address growth of 37% over six months indicates expanding user adoption.
Macroeconomic Environment and Market Cycles
-
Performance in Inflationary Environments: Both assets exhibit characteristics influenced by broader crypto market sentiment and macroeconomic conditions. The correlation with traditional inflation hedges varies based on market phase and investor risk appetite.
-
Macroeconomic Monetary Policy: Interest rate adjustments and dollar index movements affect capital flows into crypto assets. Layer-2 tokens like OP have shown sensitivity to capital rotation from Bitcoin during bullish phases, while high-performance Layer-1 projects like SEI may attract investors seeking alternative infrastructure plays.
-
Geopolitical Factors: Cross-border transaction demand and international developments influence adoption patterns. Both projects benefit from increasing interest in decentralized infrastructure, though the impact varies based on their specific use cases and geographic adoption patterns.
III. 2026-2031 Price Prediction: SEI vs OP
Short-term Prediction (2026)
- SEI: Conservative $0.116-$0.126 | Optimistic $0.126-$0.150
- OP: Conservative $0.325-$0.361 | Optimistic $0.361-$0.405
Mid-term Prediction (2028-2029)
- SEI may enter a consolidation phase, with estimated price range of $0.138-$0.214
- OP may enter a growth phase, with estimated price range of $0.246-$0.541
- Key drivers: institutional capital inflows, ETF developments, ecosystem expansion
Long-term Prediction (2031)
- SEI: Base scenario $0.140-$0.233 | Optimistic scenario $0.233-$0.321
- OP: Base scenario $0.483-$0.514 | Optimistic scenario $0.514-$0.735
View detailed price predictions for SEI and OP
Disclaimer
SEI:
| Year |
Predicted High Price |
Predicted Average Price |
Predicted Low Price |
Price Change |
| 2026 |
0.150059 |
0.1261 |
0.116012 |
0 |
| 2027 |
0.202976865 |
0.1380795 |
0.111844395 |
9 |
| 2028 |
0.20122325535 |
0.1705281825 |
0.138127827825 |
35 |
| 2029 |
0.21375707676375 |
0.185875718925 |
0.1524180895185 |
47 |
| 2030 |
0.265755809133018 |
0.199816397844375 |
0.129880658598843 |
58 |
| 2031 |
0.321244822814401 |
0.232786103488696 |
0.139671662093218 |
85 |
OP:
| Year |
Predicted High Price |
Predicted Average Price |
Predicted Low Price |
Price Change |
| 2026 |
0.404544 |
0.3612 |
0.32508 |
0 |
| 2027 |
0.39818688 |
0.382872 |
0.29481144 |
6 |
| 2028 |
0.429582384 |
0.39052944 |
0.2460335472 |
8 |
| 2029 |
0.54127380384 |
0.410055912 |
0.37725143904 |
13 |
| 2030 |
0.5517712351872 |
0.47566485792 |
0.3186954548064 |
31 |
| 2031 |
0.734616806571648 |
0.5137180465536 |
0.482894963760384 |
42 |
IV. Investment Strategy Comparison: SEI vs OP
Long-term vs Short-term Investment Strategies
-
SEI: Suitable for investors focusing on trading infrastructure innovation and high-performance blockchain applications. The asset may appeal to those seeking exposure to specialized Layer-1 solutions targeting decentralized exchange infrastructure and order book optimization. Short-term traders might find opportunities in the asset's volatility patterns, while long-term holders could position for potential ecosystem expansion in trading-focused DeFi applications.
-
OP: Suitable for investors seeking exposure to Ethereum Layer-2 scaling solutions and established DeFi ecosystem participation. The asset attracts those interested in the broader Ethereum ecosystem growth, with its extensive DApp deployment (327+ applications) and substantial Total Value Locked ($2.86 billion) providing ecosystem stability indicators. Long-term investors may benefit from the ongoing development of Layer-2 infrastructure and increasing adoption across diverse application categories.
Risk Management and Asset Allocation
-
Conservative Investors: SEI 30% vs OP 70% - This allocation favors the more established Layer-2 ecosystem with demonstrated transaction volume and broader application deployment, while maintaining exposure to alternative infrastructure through SEI.
-
Aggressive Investors: SEI 50% vs OP 50% - This balanced approach provides equal exposure to both the emerging high-performance Layer-1 trading infrastructure and the established Layer-2 scaling solution, capturing potential upside from both categories.
-
Hedging Tools: Stablecoin allocation (USDT, USDC) for liquidity management during volatile periods, options strategies for downside protection, cross-asset combinations pairing Layer-1 and Layer-2 exposure to diversify technological risk, and portfolio rebalancing based on market cycle phases.
V. Potential Risk Comparison
Market Risks
-
SEI: Faces market risks associated with competition from other high-performance blockchain platforms and trading-focused infrastructure projects. Price volatility has been notable, with significant drawdowns from peak levels ($1.14 to $0.0868), indicating sensitivity to broader market sentiment shifts. Trading volume fluctuations and market cap ranking changes may impact liquidity conditions.
-
OP: Subject to market risks tied to Ethereum ecosystem performance and Layer-2 competition from alternative scaling solutions. The asset experienced substantial price correction from its peak ($4.84 to $0.251922), reflecting broader market pressures on Layer-2 tokens. Correlation with Ethereum mainnet developments and capital rotation patterns between different Layer-2 solutions present ongoing market considerations.
Technical Risks
-
SEI: Network scalability testing during high-volume trading periods, validator network decentralization levels, and the technical implementation of parallelization strategies present ongoing considerations. The relatively newer launch (August 2023) means the network has less operational history compared to more established projects.
-
OP: Rollup technology dependencies and coordination with Ethereum mainnet upgrades create technical considerations. Network congestion during periods of high activity, bridge security between Layer-1 and Layer-2, and the complexity of maintaining compatibility with evolving Ethereum standards represent ongoing technical factors. The extensive DApp ecosystem (327+ applications) requires continuous infrastructure maintenance and upgrade coordination.
Regulatory Risks
- Global Regulatory Impact: Both assets face evolving regulatory frameworks across different jurisdictions. SEI, as a Layer-1 blockchain, may encounter regulatory scrutiny related to infrastructure classification and validator operations. OP, connected to the Ethereum ecosystem, benefits from regulatory clarity in jurisdictions that have established frameworks for Ethereum-related projects, but may face restrictions in regions with stringent cryptocurrency regulations. Cross-border transaction capabilities and compliance requirements vary by geographic market, affecting adoption patterns and institutional participation for both assets.
VI. Conclusion: Which Is the Better Buy?
📌 Investment Value Summary:
-
SEI Advantages: Specialized positioning in trading infrastructure with technical optimizations for order book efficiency and high-frequency trading applications. The focus on decentralized exchange infrastructure provides differentiated exposure within the Layer-1 category. Lower current price point ($0.1257) may present entry opportunities for those seeking exposure to emerging trading-focused blockchain solutions.
-
OP Advantages: Established presence in the Ethereum Layer-2 ecosystem with substantial Total Value Locked ($2.86 billion) and extensive DApp deployment (327+ applications). Transaction cost reduction (approximately 90% compared to Ethereum mainnet) and processing capacity (theoretical TPS exceeding 2,000) demonstrate functional scaling utility. Active address growth of 37% over six months indicates expanding user adoption and network effects.
✅ Investment Recommendations:
-
New Investors: Consider starting with OP due to its more established ecosystem presence, higher transaction volume, and connection to the broader Ethereum infrastructure. The extensive DApp deployment provides multiple use case validations. Allocation should remain modest within overall portfolio (10-20%), with emphasis on understanding Layer-2 fundamentals before expanding exposure.
-
Experienced Investors: May explore diversified allocation between both assets, with OP forming the core Layer-2 exposure (60-70%) while SEI provides alternative infrastructure exposure (30-40%). Active monitoring of ecosystem development milestones, technical upgrades, and adoption metrics can inform rebalancing decisions. Consider implementing staged entry strategies rather than single large positions.
-
Institutional Investors: Should conduct comprehensive due diligence on both projects' technical infrastructure, token distribution schedules, and regulatory compliance frameworks. OP's larger ecosystem and established track record may align with institutional risk parameters, while SEI could serve as a smaller allocation for exposure to specialized trading infrastructure. Custody solutions, liquidity analysis, and regulatory considerations should inform allocation decisions.
⚠️ Risk Warning: The cryptocurrency market exhibits high volatility. This article does not constitute investment advice. Investors should conduct independent research, assess their risk tolerance, and consider consulting financial professionals before making investment decisions. Past performance does not guarantee future results, and both assets carry substantial risks including market volatility, technological uncertainties, and regulatory changes.
VII. FAQ
Q1: What is the main difference between SEI and OP in terms of blockchain architecture?
SEI is a Layer 1 blockchain specifically designed for trading infrastructure, while OP is a Layer 2 scaling solution built on Ethereum. SEI focuses on optimizing order book efficiency and high-frequency trading applications through its native blockchain architecture and parallelization strategies. In contrast, OP utilizes Rollup technology to scale Ethereum's capabilities, achieving approximately 90% reduction in gas fees compared to the mainnet while maintaining compatibility with the broader Ethereum ecosystem. This fundamental architectural difference means SEI operates as an independent blockchain network, whereas OP functions as an extension of Ethereum's infrastructure.
Q2: Which asset has demonstrated stronger ecosystem development to date?
OP has demonstrated more extensive ecosystem development with 327+ deployed DApps and $2.86 billion in Total Value Locked. The network has processed over 230 million transactions and shows a 37% increase in active addresses over six months, indicating robust user adoption across diverse application categories including DeFi protocols, NFT platforms, and general-purpose smart contracts. SEI, launched more recently in August 2023, focuses on a more specialized ecosystem centered on decentralized exchange infrastructure and trading applications, resulting in a narrower but more targeted development approach compared to OP's broader ecosystem footprint.
Q3: How do the price volatility patterns compare between SEI and OP?
Both assets have experienced significant volatility from their respective peaks. SEI declined approximately 92.4% from its all-time high of $1.14 (March 2024) to its low of $0.0868 (October 2025), while OP fell approximately 94.8% from its peak of $4.84 (March 2024) to $0.251922 (December 2025). The similar magnitude of drawdowns suggests both Layer 1 and Layer 2 solutions faced comparable market pressures during the correction phase. However, OP's current 24-hour trading volume of $5,203,343 significantly exceeds SEI's $1,213,238, indicating potentially greater liquidity and market depth for OP during volatile periods.
Q4: What are the projected price trends for both assets through 2031?
Price predictions suggest diverging trajectories for the two assets. SEI's conservative estimates range from $0.116-$0.126 in 2026, expanding to $0.140-$0.233 by 2031, with optimistic scenarios reaching $0.321. OP's projections show a conservative range of $0.325-$0.361 in 2026, potentially reaching $0.483-$0.514 by 2031, with optimistic scenarios approaching $0.735. These forecasts reflect OP's larger established ecosystem and higher current price point, while SEI's projections factor in its emerging position in trading infrastructure. However, these predictions carry substantial uncertainty due to market volatility, technological developments, and evolving competitive landscapes.
Q5: Which asset is more suitable for risk-averse investors?
OP presents characteristics that may appeal more to risk-averse investors, primarily due to its established ecosystem presence, substantial Total Value Locked ($2.86 billion), and connection to the broader Ethereum infrastructure. The extensive DApp deployment (327+ applications) provides multiple validation points for the network's utility and adoption. Additionally, OP's higher trading volume suggests better liquidity for position entry and exit. Risk-averse investors might consider a portfolio allocation favoring OP (70%) over SEI (30%), though both assets remain high-risk investments within the cryptocurrency category and should represent only a modest portion of overall investment portfolios.
Q6: How does institutional adoption differ between SEI and OP?
Institutional adoption patterns reflect the different market positions of each asset. OP benefits from its connection to the Ethereum ecosystem, attracting institutional interest from entities already invested in Ethereum scaling solutions and seeking exposure to Layer 2 infrastructure. The network's established track record, substantial transaction processing history (over 230 million transactions), and extensive DApp ecosystem provide validation points that institutional investors typically require. SEI attracts attention from institutions focusing specifically on high-performance blockchain infrastructure and trading-focused applications, representing a more specialized institutional interest profile. The regulatory landscape also affects institutional participation, with some jurisdictions showing greater clarity for Ethereum-related projects like OP.
Q7: What are the primary technical risks associated with each blockchain?
SEI's technical risks center on its relatively newer network launch (August 2023), meaning less operational history for stress-testing during extreme market conditions. The implementation of parallelization strategies and validator network decentralization levels require ongoing monitoring as the network scales. For OP, technical risks involve Rollup technology dependencies and coordination requirements with Ethereum mainnet upgrades, which create interdependencies with Ethereum's development roadmap. Bridge security between Layer 1 and Layer 2, network congestion during high-activity periods, and the complexity of maintaining compatibility with evolving Ethereum standards represent ongoing technical considerations. Both networks face infrastructure maintenance challenges, though of different natures due to their distinct architectural approaches.
Q8: How should investors approach portfolio allocation between SEI and OP?
Portfolio allocation should reflect individual risk tolerance and investment objectives. Conservative investors might consider a 30% SEI / 70% OP allocation, favoring the more established ecosystem while maintaining exposure to alternative infrastructure. Aggressive investors seeking balanced exposure to both Layer 1 and Layer 2 innovations could implement a 50% / 50% split. New investors are generally advised to start with OP due to its established presence and higher liquidity, keeping initial cryptocurrency allocation modest (10-20% of overall portfolio). Experienced investors may implement staged entry strategies with regular rebalancing based on ecosystem development milestones and market cycle phases. Regardless of allocation, both assets should be viewed as high-risk components within a diversified investment portfolio, with position sizing reflecting tolerance for substantial volatility.
* The information is not intended to be and does not constitute financial advice or any other recommendation of any sort offered or endorsed by Gate.