This comprehensive article compares STT (Statter Network) and ENJ (Enjin Coin), two distinct blockchain tokens serving different market segments. STT, launched in 2023, positions itself as metaverse infrastructure with current price at $0.003263 and limited liquidity of $54,062.43 daily volume. ENJ, operational since 2017, focuses on gaming blockchain with higher trading activity at $377,111.86 and current price at $0.02183. The analysis examines historical price trends, supply mechanisms, institutional adoption, and technological ecosystems, with price forecasts through 2031. For experienced investors, ENJ offers established market presence and lower volatility, while STT appeals to higher-risk tolerance investors exploring emerging metaverse sectors. Both tokens present substantial cryptocurrency market risks including regulatory uncertainty and extreme current market fear sentiment. Investors should prioritize comprehensive due diligence and risk assessment through Gate exchange platforms before any invest
Introduction: Investment Comparison Between STT and ENJ
In the cryptocurrency market, the comparison between STT vs ENJ has always been a topic that investors cannot avoid. The two not only have obvious differences in market cap ranking, application scenarios, and price performance, but also represent different crypto asset positioning.
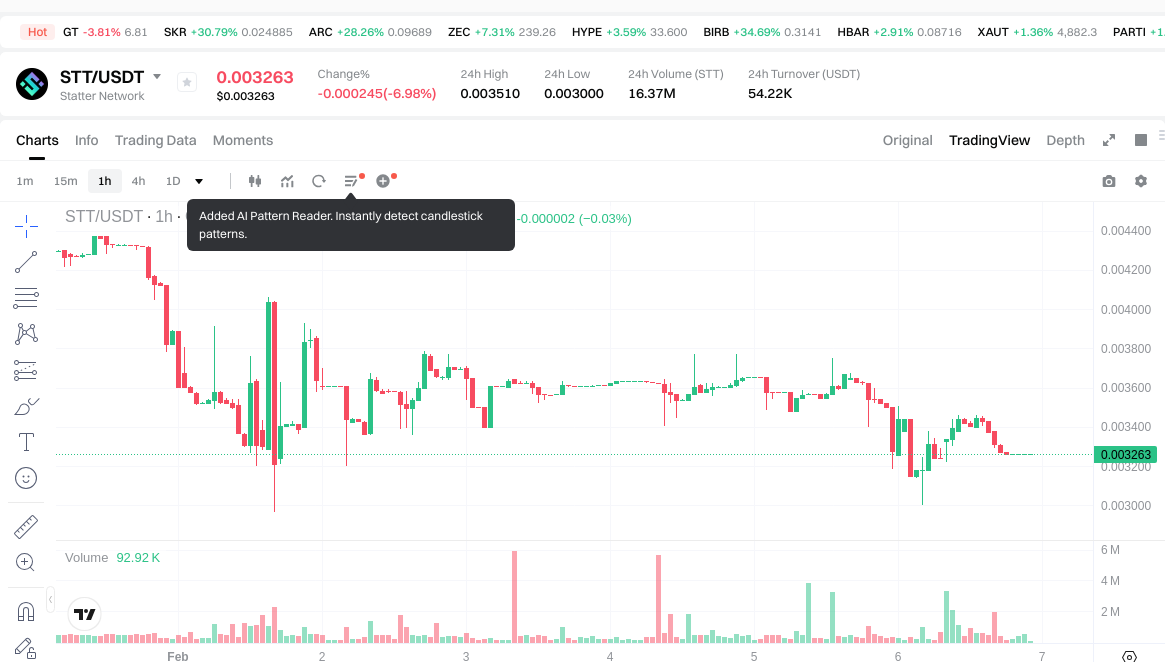
Statter Network (STT): Launched in 2023, it has gained market recognition by positioning itself as the world's first full-service public blockchain platform for the metaverse ecosystem, aiming to build high-performance and high-security infrastructure for metaverse developers, creators, and players.
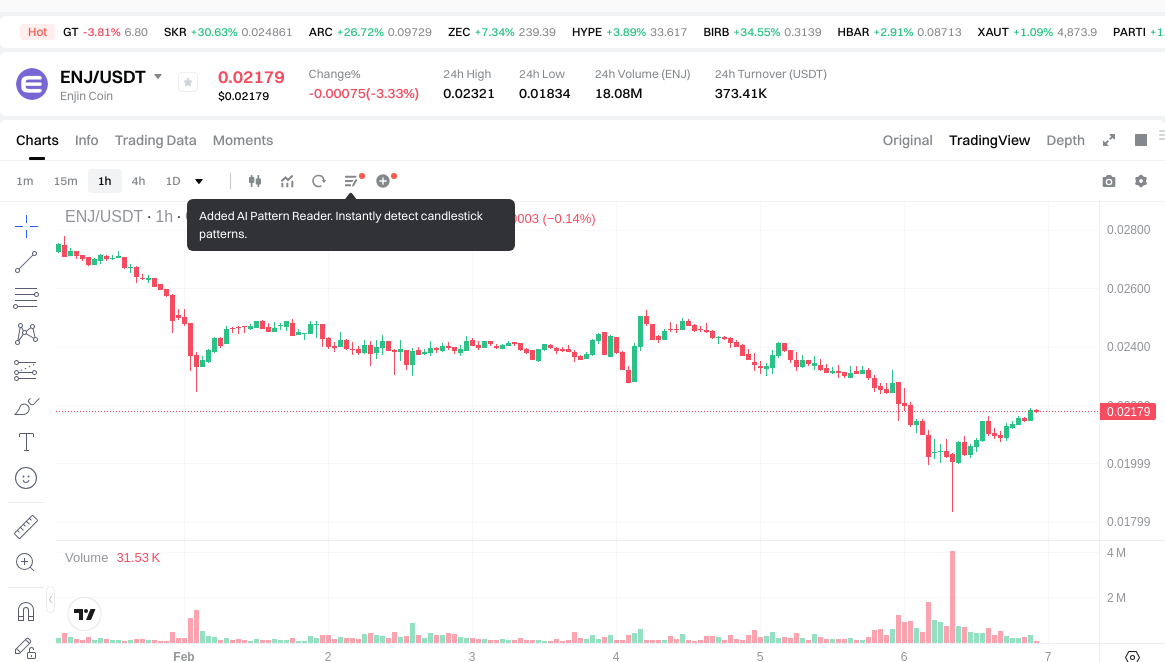
Enjin Coin (ENJ): Since its launch in 2017, it has been recognized as a gaming-focused blockchain platform that enables players, content creators, and game publishers to add virtual goods and provide value for games and communities.
This article will comprehensively analyze the investment value comparison between STT vs ENJ around historical price trends, supply mechanisms, institutional adoption, technical ecosystem, and future predictions, and attempt to answer the question that investors are most concerned about:
"Which is the better buy right now?"
I. Historical Price Comparison and Current Market Status
Statter Network (STT) and Enjin Coin (ENJ) Historical Price Trends
- April 2024: STT experienced a notable price movement, reaching $1.43 during a period of market activity.
- November 2021: ENJ was influenced by broader market momentum, with its price reaching $4.82 during a period of elevated interest in gaming and metaverse-related tokens.
- Comparative Analysis: During different market cycles, STT has shown volatility from its April 2024 level of $1.43 to a lower range of $0.00261, while ENJ has experienced fluctuations from its November 2021 level of $4.82 to a lower range of $0.01865964.
Current Market Situation (2026-02-06)
- STT Current Price: $0.003263
- ENJ Current Price: $0.02183
- 24-Hour Trading Volume: STT recorded $54,062.43, while ENJ recorded $377,111.86
- Market Sentiment Index (Fear & Greed Index): 9 (Extreme Fear)
View real-time prices:
- Check STT current price Market Price
- Check ENJ current price Market Price
II. Core Factors Influencing STT vs ENJ Investment Value
The investment value comparison between STT and ENJ requires examination across multiple dimensions, including supply mechanisms, institutional adoption, technological development, and macroeconomic conditions. However, the provided reference materials do not contain specific information regarding these tokens' characteristics, making a comprehensive analysis challenging within the current data scope.
Supply Mechanism Comparison (Tokenomics)
Understanding the supply dynamics of digital assets forms a foundational element in evaluating their potential value trajectory. Different supply models, such as fixed supply caps, inflationary schedules, or deflationary mechanisms, can significantly influence market behavior and price formation over time. The interplay between circulating supply, total supply, and emission rates often creates distinct market cycles and investor expectations.
Institutional Adoption and Market Application
Institutional participation in digital asset markets has evolved considerably, with various entities exploring different tokens for specific use cases. The degree of institutional interest, corporate implementation, and regulatory frameworks across jurisdictions can substantially affect the adoption trajectory of different assets. Cross-border payment infrastructure, settlement systems, and portfolio allocation strategies represent key areas where institutional involvement may materialize.
Technology Development and Ecosystem Building
Technological advancement remains a critical factor in the long-term viability of digital assets. Protocol upgrades, scalability improvements, and security enhancements contribute to the foundational strength of blockchain networks. Ecosystem development across various sectors, including decentralized finance, digital collectibles, payment systems, and programmable contract platforms, reflects the practical utility and adoption potential of different networks.
Macroeconomic Context and Market Cycles
Broader economic conditions influence digital asset markets through multiple channels. Inflationary pressures, monetary policy adjustments, interest rate environments, and currency market dynamics create varying conditions for different asset classes. Additionally, geopolitical developments and international trade patterns may affect demand for specific digital assets, particularly those with cross-border transaction capabilities or alternative store-of-value characteristics.
III. 2026-2031 Price Forecast: STT vs ENJ
Short-term Forecast (2026)
- STT: Conservative $0.00186 - $0.00326 | Optimistic $0.00326 - $0.00450
- ENJ: Conservative $0.0133 - $0.0218 | Optimistic $0.0218 - $0.0244
Mid-term Forecast (2028-2029)
- STT may enter a consolidation phase, with projected prices ranging from $0.00322 to $0.00691
- ENJ may enter a growth phase, with projected prices ranging from $0.0195 to $0.0445
- Key drivers: institutional capital inflows, ETF developments, ecosystem expansion
Long-term Forecast (2030-2031)
- STT: Baseline scenario $0.00382 - $0.00579 | Optimistic scenario $0.00579 - $0.00909
- ENJ: Baseline scenario $0.0264 - $0.0375 | Optimistic scenario $0.0375 - $0.0476
View detailed price predictions for STT and ENJ
Disclaimer: Price forecasts are based on historical data analysis and market modeling. Cryptocurrency markets are highly volatile and subject to various unpredictable factors including regulatory changes, technological developments, and macroeconomic conditions. These projections should not be considered as investment advice, and actual prices may differ significantly from forecasted ranges.
STT:
| Year |
Predicted High Price |
Predicted Average Price |
Predicted Low Price |
Price Change |
| 2026 |
0.00450294 |
0.003263 |
0.00185991 |
0 |
| 2027 |
0.005047861 |
0.00388297 |
0.0020968038 |
19 |
| 2028 |
0.004867302895 |
0.0044654155 |
0.00321509916 |
36 |
| 2029 |
0.0069062116123 |
0.0046663591975 |
0.003779750949975 |
43 |
| 2030 |
0.007580033880419 |
0.0057862854049 |
0.003818948367234 |
77 |
| 2031 |
0.009089097114016 |
0.006683159642659 |
0.003608906207036 |
104 |
ENJ:
| Year |
Predicted High Price |
Predicted Average Price |
Predicted Low Price |
Price Change |
| 2026 |
0.0243824 |
0.02177 |
0.0132797 |
0 |
| 2027 |
0.034383538 |
0.0230762 |
0.018230198 |
5 |
| 2028 |
0.03217745328 |
0.028729869 |
0.01953631092 |
31 |
| 2029 |
0.0444623452644 |
0.03045366114 |
0.025885611969 |
39 |
| 2030 |
0.047571664066794 |
0.0374580032022 |
0.028468082433672 |
71 |
| 2031 |
0.045916020325256 |
0.042514833634497 |
0.026359196853388 |
94 |
IV. Investment Strategy Comparison: STT vs ENJ
Long-term vs Short-term Investment Strategies
-
STT: May appeal to investors interested in emerging metaverse infrastructure projects with higher risk tolerance. The token's positioning in the metaverse ecosystem suggests potential alignment with investors exploring early-stage blockchain platforms, though market data indicates considerable price volatility.
-
ENJ: May suit investors focusing on established gaming-focused blockchain platforms with a longer operational history since 2017. The token's association with virtual goods and gaming communities could attract those interested in the intersection of blockchain technology and digital entertainment sectors.
Risk Management and Asset Allocation
-
Conservative Investors: A cautious approach might consider minimal exposure to highly volatile assets, with potential allocation considerations favoring more established tokens with longer track records and higher liquidity levels.
-
Aggressive Investors: Those with higher risk appetite exploring emerging sectors might consider diversified positions across different blockchain use cases, though volatility and market conditions warrant careful position sizing.
-
Hedging Tools: Stablecoin reserves, derivatives instruments where available, and cross-asset diversification strategies may help manage exposure to price fluctuations in volatile market conditions.
V. Potential Risk Comparison
Market Risk
-
STT: Price movements have shown significant volatility, with the current price of $0.003263 reflecting substantial variation from previous levels. Trading volume of $54,062.43 suggests relatively limited liquidity, which may amplify price swings during periods of market stress.
-
ENJ: Historical price fluctuations and current trading volume of $377,111.86 indicate more established market presence, though the asset remains subject to broader cryptocurrency market dynamics and sentiment shifts, as evidenced by the current Extreme Fear market sentiment reading.
Technical Risk
-
STT: As a platform launched in 2023, the network faces typical challenges associated with newer blockchain infrastructure, including ecosystem development requirements and the need to demonstrate long-term technical viability.
-
ENJ: Operational since 2017, the platform has accumulated technical experience, though ongoing development requirements and competitive pressures in the gaming blockchain sector present continuous challenges.
Regulatory Risk
Global regulatory frameworks for digital assets continue to evolve across different jurisdictions. Both gaming-focused and metaverse-oriented blockchain platforms face potential regulatory considerations regarding virtual asset classifications, cross-border operations, and compliance requirements. Regulatory developments in major markets could influence adoption trajectories and operational parameters for both networks.
VI. Conclusion: Which Is the Better Buy?
📌 Investment Value Summary:
-
STT Characteristics: Positioned as metaverse-focused infrastructure with a 2023 launch date, representing an emerging sector approach. Current market metrics show limited trading volume and significant price volatility from previous levels.
-
ENJ Characteristics: Established gaming blockchain platform operational since 2017, with focus on virtual goods and gaming communities. Demonstrates longer operational track record and relatively higher trading volume compared to STT.
✅ Investment Considerations:
-
New Investors: Should prioritize understanding fundamental blockchain concepts, market volatility characteristics, and risk management principles before considering exposure to any digital assets. Educational resources and gradual familiarization with market dynamics form important preliminary steps.
-
Experienced Investors: May evaluate both assets within broader portfolio context, considering factors such as sector exposure preferences, risk-reward profiles, liquidity requirements, and alignment with individual investment frameworks.
-
Institutional Participants: Typically conduct comprehensive due diligence encompassing technical infrastructure assessment, regulatory compliance frameworks, custody solutions, and strategic fit within institutional mandates before considering positions in digital assets.
⚠️ Risk Disclaimer: Cryptocurrency markets exhibit extreme volatility and involve substantial risk of loss. This analysis does not constitute investment advice, financial recommendations, or solicitation to buy or sell any assets. Market conditions, regulatory environments, and technological factors can change rapidly and unpredictably. Individuals should conduct independent research, assess personal risk tolerance, and consult qualified financial advisors before making investment decisions. Past performance does not indicate future results.
VII. FAQ
Q1: What is the primary difference between STT and ENJ in terms of their blockchain focus?
STT (Statter Network) positions itself as metaverse infrastructure launched in 2023, while ENJ (Enjin Coin) operates as a gaming-focused platform established in 2017. STT targets metaverse developers, creators, and players with full-service public blockchain capabilities, whereas ENJ specifically enables virtual goods integration for games and gaming communities, representing distinct sectors within the broader blockchain ecosystem.
Q2: How do the current trading volumes of STT and ENJ compare, and what does this indicate?
ENJ demonstrates significantly higher trading volume at $377,111.86 compared to STT's $54,062.43 as of February 6, 2026. This substantial difference indicates that ENJ has greater market liquidity and established trading activity, which typically translates to easier entry and exit positions with potentially lower slippage, while STT's limited volume suggests a less liquid market that may experience amplified price movements during trading activity.
Q3: What are the projected price ranges for STT and ENJ by 2031?
By 2031, STT's price forecasts range from $0.00361 (low scenario) to $0.00909 (optimistic scenario), while ENJ projects range from $0.0264 (baseline low) to $0.0476 (optimistic high). However, these projections represent modeling exercises based on historical data and should not be interpreted as guaranteed outcomes, as cryptocurrency markets remain highly unpredictable and subject to numerous external factors including regulatory changes and technological developments.
Q4: Which token might be more suitable for conservative investors?
Neither token may be particularly suitable for conservative investors seeking capital preservation, as both exhibit substantial volatility characteristics typical of cryptocurrency markets. However, if considering exposure between the two, ENJ's longer operational history since 2017, higher trading volume, and more established market presence may present relatively lower risk compared to STT's emerging status since 2023, though both remain speculative assets requiring careful risk assessment.
Q5: What key risks should investors consider when evaluating STT versus ENJ?
Investors should evaluate market risk (STT shows higher volatility with limited liquidity, while ENJ demonstrates more established but still volatile trading patterns), technical risk (STT faces challenges as newer infrastructure requiring ecosystem development, while ENJ maintains longer operational track record but faces competitive pressures), and regulatory risk (both tokens face evolving global regulatory frameworks affecting virtual assets, gaming platforms, and metaverse applications across different jurisdictions).
Q6: How has the market sentiment affected both STT and ENJ currently?
The current market sentiment index stands at 9, indicating "Extreme Fear" conditions affecting the broader cryptocurrency market. This pessimistic sentiment environment impacts both STT (current price $0.003263) and ENJ (current price $0.02183), contributing to suppressed valuations and cautious investor behavior. Such extreme fear conditions historically present both heightened risk and potential opportunity depending on subsequent market recovery patterns and fundamental project developments.
* The information is not intended to be and does not constitute financial advice or any other recommendation of any sort offered or endorsed by Gate.