The article offers a detailed comparative analysis of SWEAT and GRT, two leading platforms in fitness-to-earn and Web3 rewards. It evaluates their market trajectories, historical performance, supply mechanisms, and market positioning, aiming to guide investors on which token might be a better buy currently. Through examining price trends and future predictions, it caters to both novice and experienced crypto investors focusing on SWEAT's move-to-earn concept and GRT's blockchain indexing infrastructure. The content is structured to provide historical data evaluations, technical and ecosystem insights, and investment strategy recommendations, catering to readers seeking informed crypto investment strategies with a risk management outlook.
Introduction: SWEAT vs GRT Investment Comparison
In the cryptocurrency market, the comparison between SWEAT and GRT has been an unavoidable topic for investors. The two not only show significant differences in market cap ranking, application scenarios, and price performance, but also represent different positions in the crypto asset landscape.
SWEAT (SWEAT): Launched in 2016, it has gained market recognition for its unique approach to incentivizing physical activity and reducing global carbon footprint.
GRT (GRT): Introduced in 2020, it has been hailed as the "Google of blockchains" for its role in indexing and querying blockchain data.
This article will comprehensively analyze the investment value comparison between SWEAT and GRT, focusing on historical price trends, supply mechanisms, institutional adoption, technical ecosystems, and future predictions, attempting to answer the question investors care about most:
"Which is the better buy right now?"
I. Price History Comparison and Current Market Status
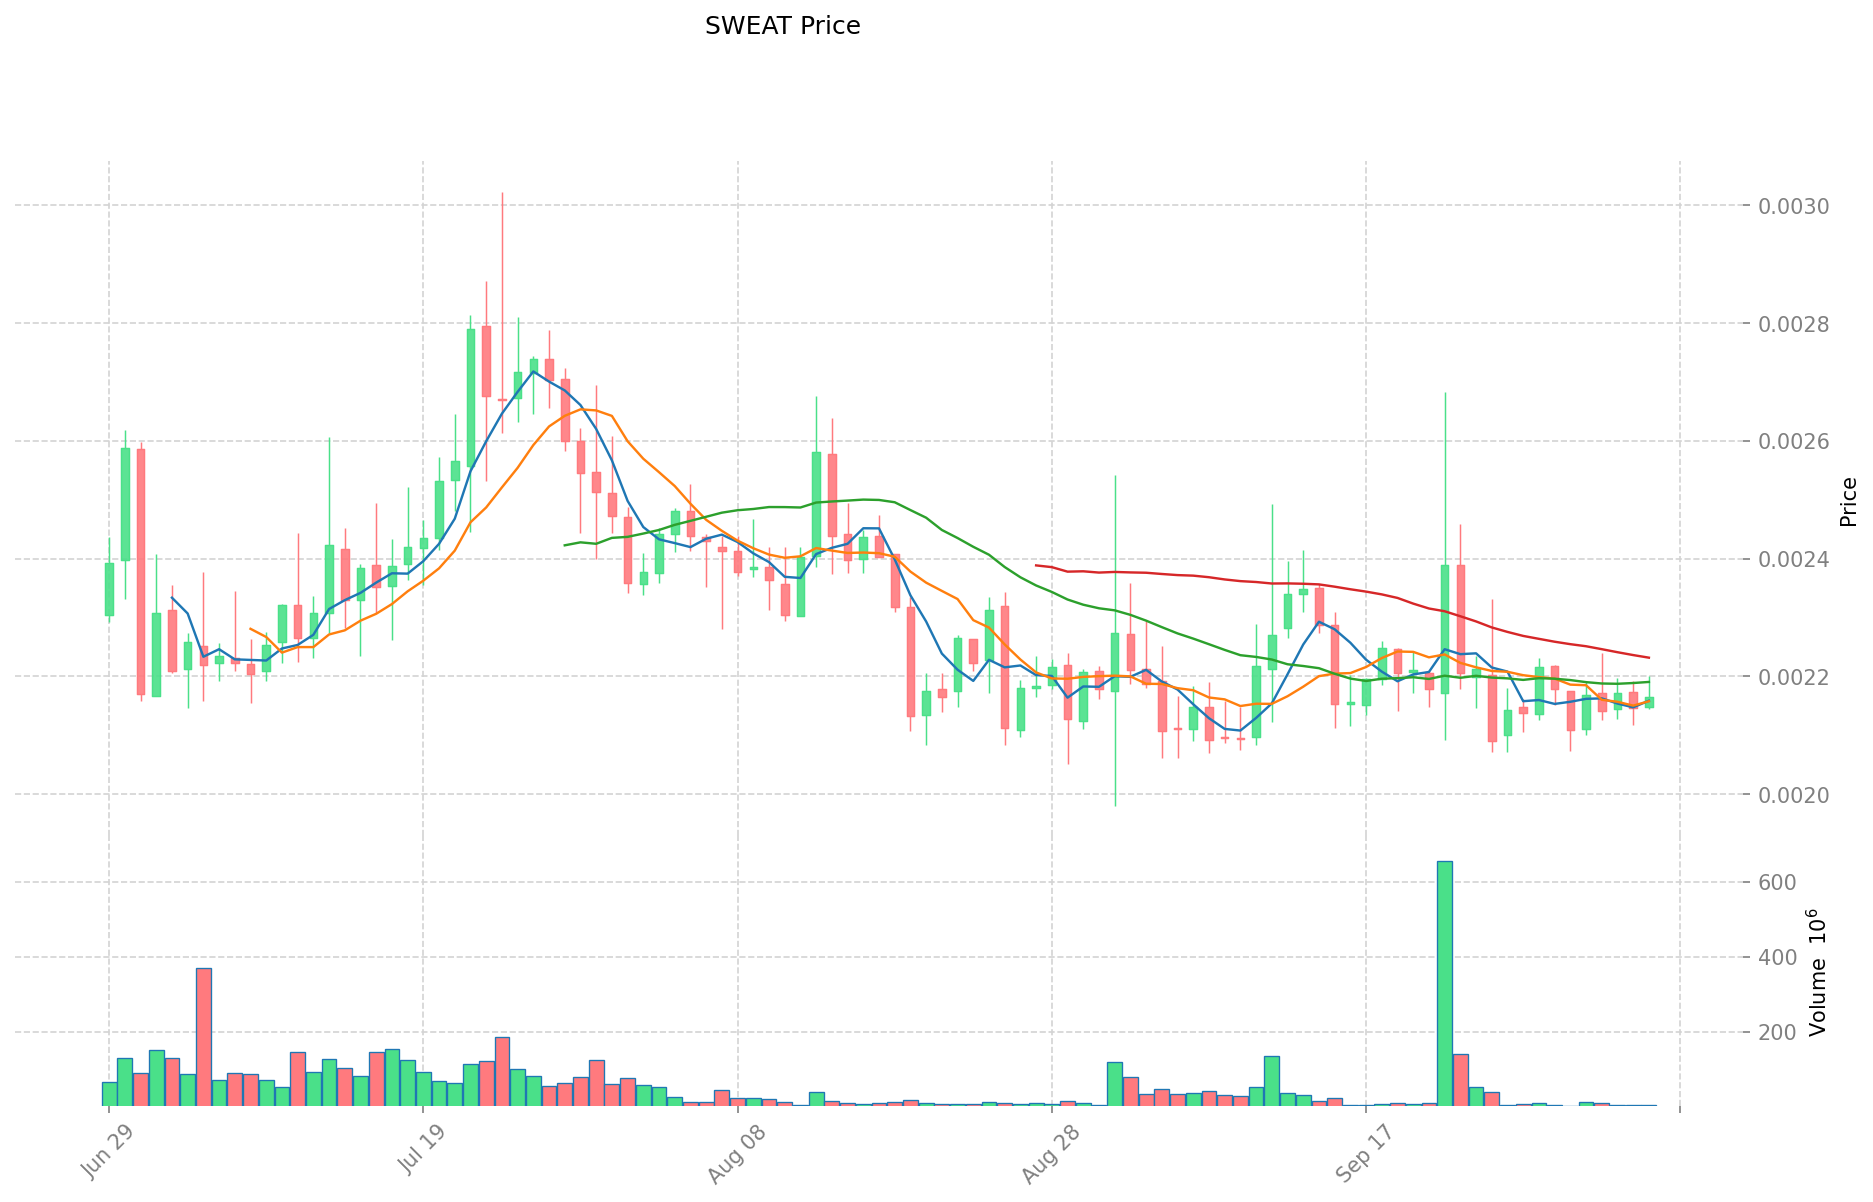
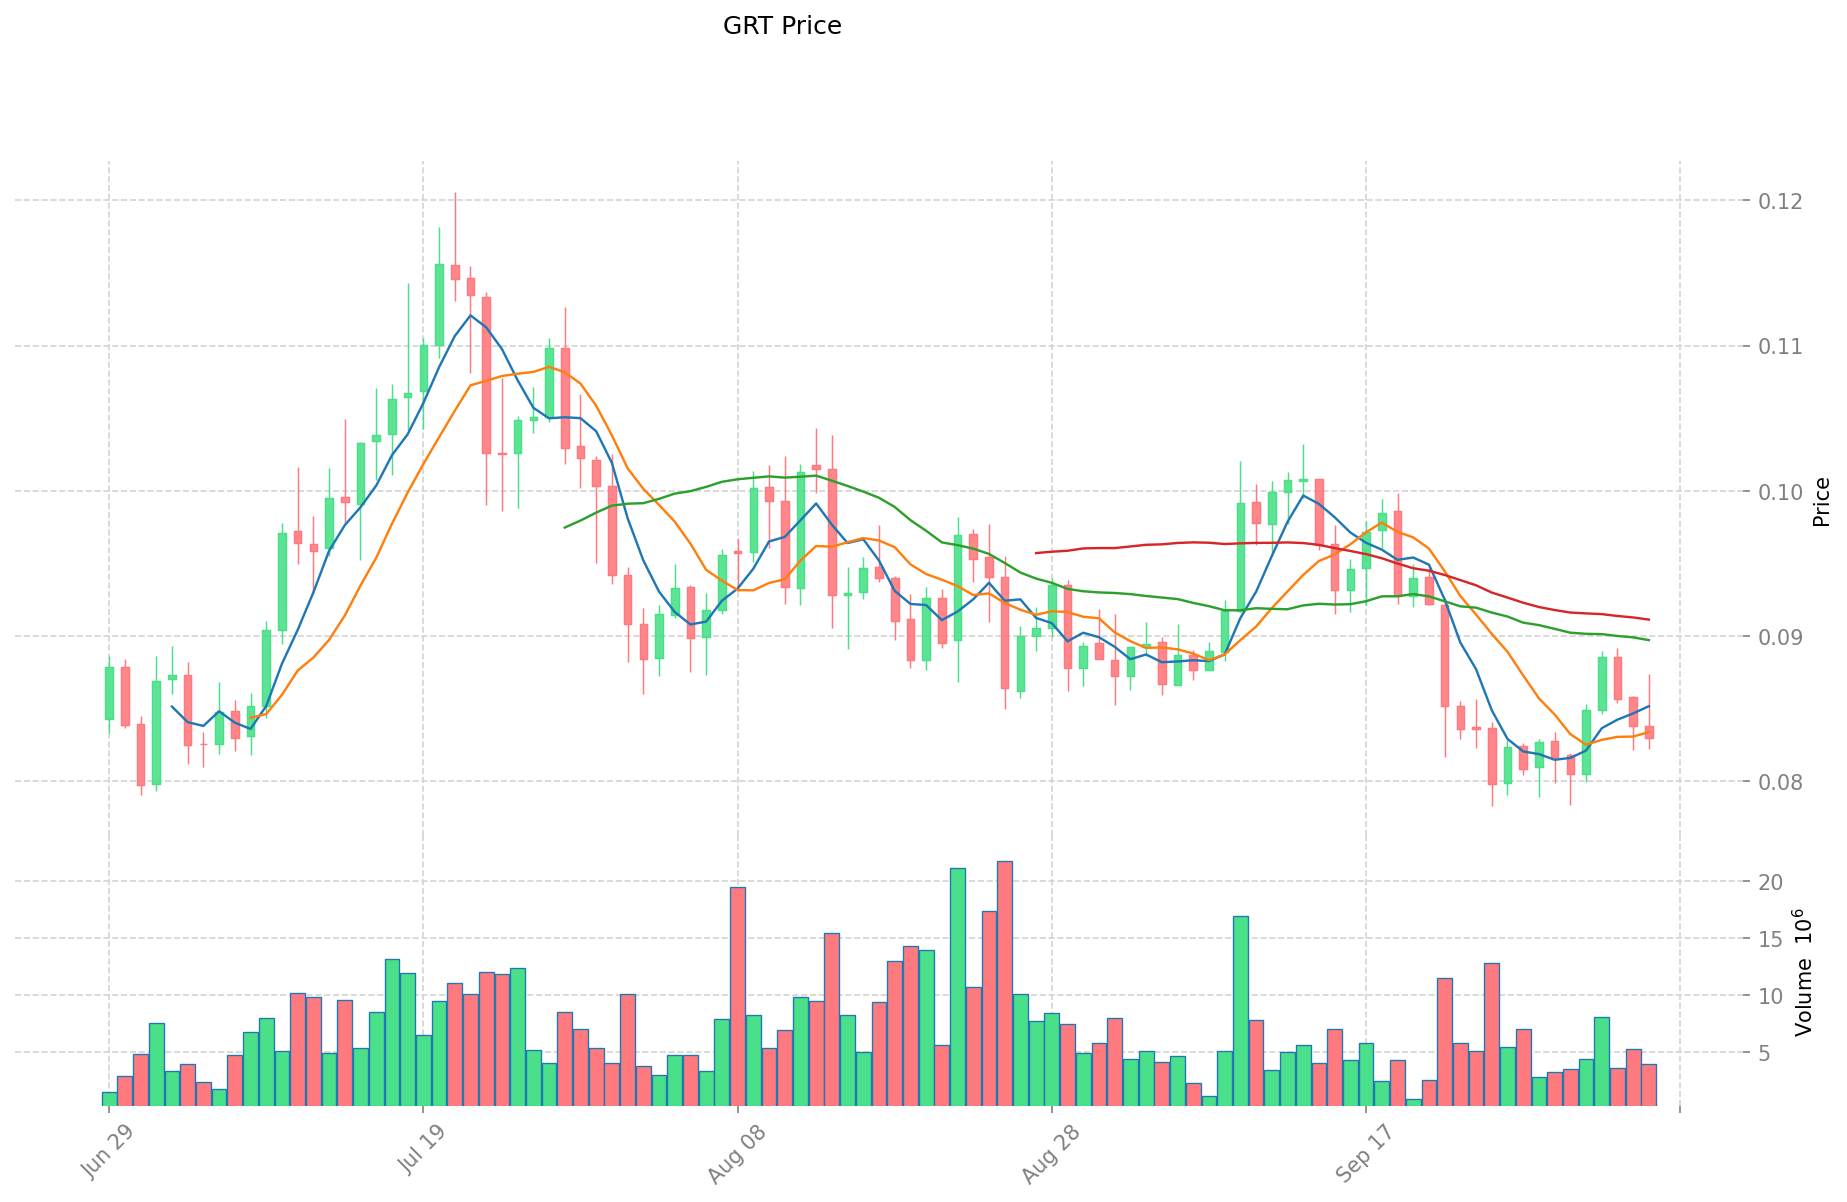
SWEAT (Coin A) and GRT (Coin B) Historical Price Trends
- 2022: SWEAT launched at $0.007, reaching an all-time high of $0.091476 shortly after.
- 2021: GRT experienced significant growth, reaching an all-time high of $2.84 in February.
- Comparative analysis: During the 2022-2025 crypto market cycle, SWEAT declined from its ATH of $0.091476 to a low of $0.00200185, while GRT fell from its peak of $2.84 to a low of $0.052051.
Current Market Situation (2025-10-06)
- SWEAT current price: $0.002165
- GRT current price: $0.08299
- 24-hour trading volume: SWEAT $8,683.39 vs GRT $366,910.80
- Market Sentiment Index (Fear & Greed Index): 74 (Greed)
Click to view real-time prices:
- Check SWEAT current price Market Price
- Check GRT current price Market Price
Investment Value Analysis: SWEAT vs GRT
I. Key Factors Affecting SWEAT vs GRT Investment Value
Supply Mechanism Comparison (Tokenomics)
- SWEAT: High-risk token with significant price uncertainty
- GRT: Limited information available in the provided context
- 📌 Historical Pattern: Both tokens show high volatility typical of cryptocurrency markets
Institutional Adoption and Market Applications
- Institutional Holdings: Insufficient data in the provided context
- Trading Volume: SWEAT shows 24-hour trading volume of ¥47,322,700 CNY across major exchanges including OKX, Bitget, MEXC, and Gate
- Exchange Presence: SWEAT is listed on multiple exchanges with varying risk ratings (all marked as "High")
Technical Development and Ecosystem Building
- SWEAT appears to be part of the "move-to-earn" ecosystem based on context clues
- Current pricing: SWEAT trading at approximately ¥0.01733 CNY
- Market signals: Both tokens classified as high-risk investments
Macroeconomic Factors and Market Cycles
- Risk Profile: SWEAT specifically mentioned as a "high-risk token"
- Future Outlook: Potential for price rebounds exists but with "extreme uncertainty"
- Investment Timing: The importance of entry and exit timing is highlighted for cryptocurrency investments
III. 2025-2030 Price Prediction: SWEAT vs GRT
Short-term Prediction (2025)
- SWEAT: Conservative $0.0011869 - $0.002158 | Optimistic $0.002158 - $0.0030212
- GRT: Conservative $0.079325 - $0.0835 | Optimistic $0.0835 - $0.107715
Mid-term Prediction (2027)
- SWEAT may enter a growth phase, with prices expected in the range of $0.00169204464 - $0.00435544824
- GRT may enter a consolidation phase, with prices expected in the range of $0.06626555825 - $0.119963510625
- Key drivers: Institutional capital inflow, ETF, ecosystem development
Long-term Prediction (2030)
- SWEAT: Base scenario $0.00410857814367 - $0.005916352526884 | Optimistic scenario $0.005916352526884+
- GRT: Base scenario $0.144937771331578 - $0.179722836451156 | Optimistic scenario $0.179722836451156+
View detailed price predictions for SWEAT and GRT
Disclaimer: The above predictions are based on historical data and market analysis. Cryptocurrency markets are highly volatile and subject to rapid changes. These forecasts should not be considered as financial advice. Always conduct your own research before making investment decisions.
SWEAT:
| 年份 |
预测最高价 |
预测平均价格 |
预测最低价 |
涨跌幅 |
| 2025 |
0.0030212 |
0.002158 |
0.0011869 |
0 |
| 2026 |
0.003677232 |
0.0025896 |
0.001735032 |
19 |
| 2027 |
0.00435544824 |
0.003133416 |
0.00169204464 |
44 |
| 2028 |
0.0040814310108 |
0.00374443212 |
0.0032951002656 |
72 |
| 2029 |
0.00430422472194 |
0.0039129315654 |
0.003756414302784 |
80 |
| 2030 |
0.005916352526884 |
0.00410857814367 |
0.003040347826315 |
89 |
GRT:
| 年份 |
预测最高价 |
预测平均价格 |
预测最低价 |
涨跌幅 |
| 2025 |
0.107715 |
0.0835 |
0.079325 |
0 |
| 2026 |
0.132894425 |
0.0956075 |
0.056408425 |
15 |
| 2027 |
0.119963510625 |
0.1142509625 |
0.06626555825 |
38 |
| 2028 |
0.14287082860625 |
0.1171072365625 |
0.085488282690625 |
41 |
| 2029 |
0.159886510078781 |
0.129989032584375 |
0.100091555089968 |
57 |
| 2030 |
0.179722836451156 |
0.144937771331578 |
0.100007062218788 |
75 |
IV. Investment Strategy Comparison: SWEAT vs GRT
Long-term vs Short-term Investment Strategies
- SWEAT: Suitable for investors interested in move-to-earn ecosystems and physical activity incentives
- GRT: Suitable for investors focused on blockchain infrastructure and data indexing solutions
Risk Management and Asset Allocation
- Conservative investors: SWEAT 10% vs GRT 90%
- Aggressive investors: SWEAT 30% vs GRT 70%
- Hedging tools: Stablecoin allocation, options, cross-currency portfolios
V. Potential Risk Comparison
Market Risk
- SWEAT: High volatility, extreme price uncertainty
- GRT: Subject to overall crypto market trends, potential for significant price fluctuations
Technical Risk
- SWEAT: Ecosystem adoption, platform stability
- GRT: Network congestion, potential vulnerabilities in indexing protocols
Regulatory Risk
- Global regulatory policies may impact both tokens differently, with potential for stricter oversight on move-to-earn and blockchain indexing projects
VI. Conclusion: Which Is the Better Buy?
📌 Investment Value Summary:
- SWEAT advantages: Unique move-to-earn concept, potential for growth in health and fitness sector
- GRT advantages: Essential infrastructure for blockchain data querying, established presence in the market
✅ Investment Advice:
- New investors: Consider a small allocation to GRT as part of a diversified crypto portfolio
- Experienced investors: Balanced approach with higher allocation to GRT, small speculative position in SWEAT
- Institutional investors: Focus on GRT for its infrastructure role, monitor SWEAT for potential future opportunities
⚠️ Risk Warning: Cryptocurrency markets are highly volatile. This article does not constitute investment advice.
None
VII. FAQ
Q1: What are the key differences between SWEAT and GRT?
A: SWEAT is a token focused on incentivizing physical activity and reducing carbon footprint, while GRT is known as the "Google of blockchains" for its role in indexing and querying blockchain data. SWEAT was launched in 2016, while GRT was introduced in 2020. Their market caps, price performances, and use cases differ significantly.
Q2: Which token has shown better price performance historically?
A: Based on the provided data, GRT has shown better historical price performance. It reached an all-time high of $2.84 in February 2021, while SWEAT's all-time high was $0.091476 shortly after its launch in 2022. However, both tokens have experienced significant declines from their peak prices.
Q3: How do the current market situations of SWEAT and GRT compare?
A: As of 2025-10-06, SWEAT is trading at $0.002165, while GRT is trading at $0.08299. GRT has a significantly higher 24-hour trading volume of $366,910.80 compared to SWEAT's $8,683.39. The current market sentiment is leaning towards "Greed" with a Fear & Greed Index of 74.
Q4: What are the price predictions for SWEAT and GRT in 2030?
A: For SWEAT, the base scenario predicts a range of $0.00410857814367 - $0.005916352526884, with an optimistic scenario above $0.005916352526884. For GRT, the base scenario predicts a range of $0.144937771331578 - $0.179722836451156, with an optimistic scenario above $0.179722836451156.
Q5: How should investors allocate their assets between SWEAT and GRT?
A: Conservative investors might consider allocating 10% to SWEAT and 90% to GRT, while aggressive investors might allocate 30% to SWEAT and 70% to GRT. However, these are general suggestions and individual investment strategies should be based on personal risk tolerance and financial goals.
Q6: What are the main risks associated with investing in SWEAT and GRT?
A: Both tokens face market risks such as high volatility and price uncertainty. SWEAT has technical risks related to ecosystem adoption and platform stability, while GRT may face issues with network congestion and potential vulnerabilities in indexing protocols. Both are subject to regulatory risks as global policies on cryptocurrencies continue to evolve.
Q7: Which token is considered a better buy for different types of investors?
A: For new investors, GRT might be a more suitable option as part of a diversified crypto portfolio. Experienced investors might consider a balanced approach with a higher allocation to GRT and a small speculative position in SWEAT. Institutional investors may focus more on GRT for its infrastructure role while monitoring SWEAT for potential future opportunities.
* The information is not intended to be and does not constitute financial advice or any other recommendation of any sort offered or endorsed by Gate.


