TRCL vs QNT: A Comprehensive Comparison of Two Leading Blockchain Infrastructure Providers


Introduction: Investment Comparison Between TRCL and QNT
In the cryptocurrency market, the comparison between TRCL vs QNT remains a focal point for investors. Both assets demonstrate notable differences in market capitalization ranking, application scenarios, and price performance, representing distinct positioning within the crypto asset landscape.
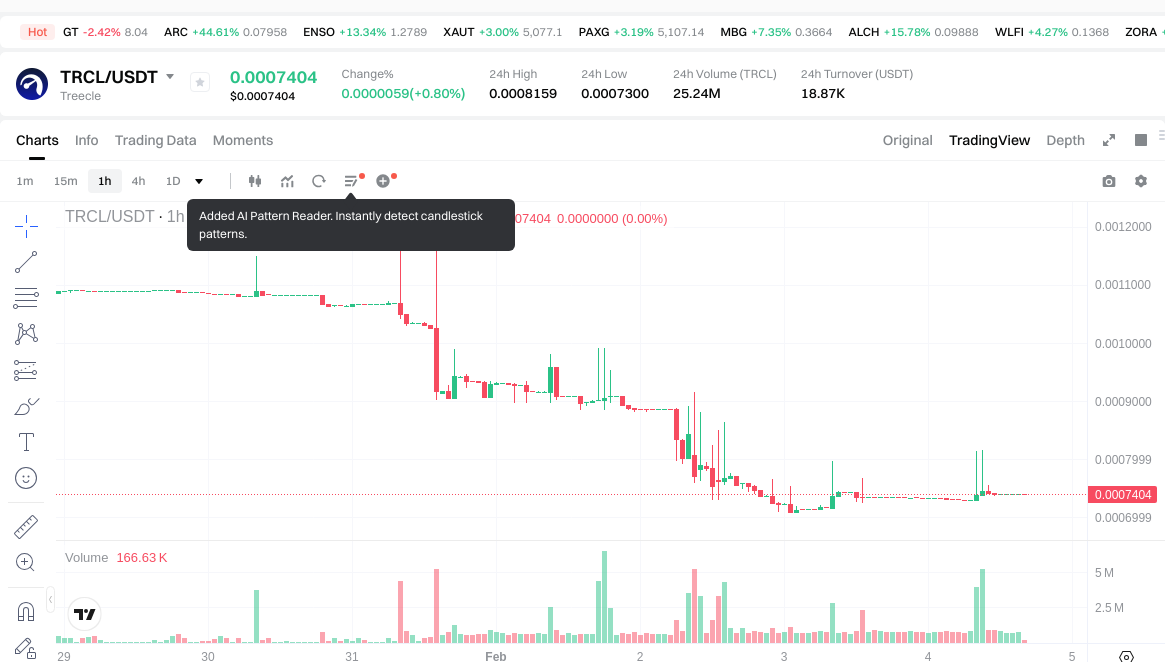
TRCL (Treecle): Launched as a blockchain-based platform targeting the second-hand car service sector, TRCL aims to provide authentic transaction verification through blockchain and hash value technology.
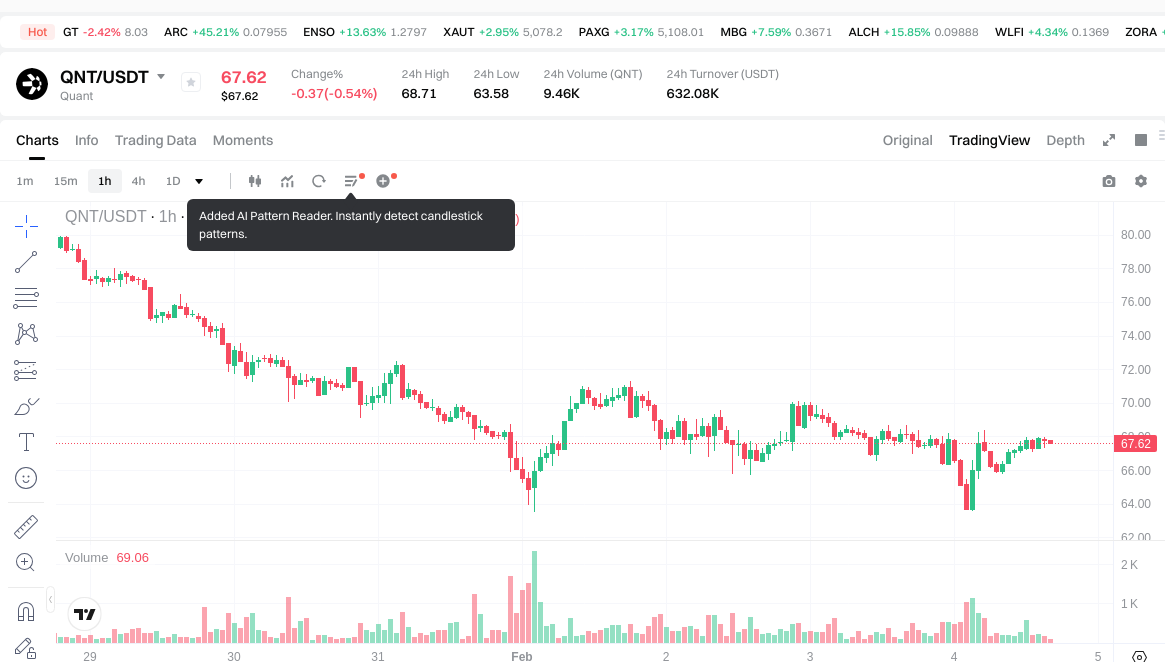
QNT (Quant): Since its inception in 2018, QNT has been recognized for addressing blockchain interoperability through its Overledger operating system, positioning itself as an enterprise-grade infrastructure solution.
This article will comprehensively analyze the investment value comparison between TRCL vs QNT, focusing on historical price trends, supply mechanisms, institutional adoption, technical ecosystems, and future projections, while addressing investors' most pressing question:
"Which asset presents stronger fundamentals for consideration?"
As of February 4, 2026, TRCL ranks at position 2738 with a market cap of approximately $737,943, while QNT holds position 75 with a market cap exceeding $985 million. The substantial disparity in market positioning, liquidity (1 vs 40 exchanges), and holder base (181 vs 160,929) establishes a clear framework for comparative analysis throughout this research.
I. Historical Price Comparison and Current Market Status
TRCL (Coin A) and QNT (Coin B) Historical Price Trends
- 2021: TRCL reached a notable price point during April 2021, when it recorded $0.300077. The token subsequently experienced significant volatility in the following periods.
- 2021: QNT was influenced by market developments in September 2021, with its price reaching $427.42 during a period of broader market momentum.
- Comparative Analysis: During the 2021-2022 market cycle, TRCL declined from $0.300077 to $0.000039, while QNT demonstrated a similar pattern, retreating from $427.42 to $0.215773 before partial recovery.
Current Market Status (2026-02-04)
- TRCL Current Price: $0.0007405
- QNT Current Price: $67.78
- 24-Hour Trading Volume: TRCL $18,911.01 vs QNT $632,725.31
- Market Sentiment Index (Fear & Greed Index): 14 (Extreme Fear)
View real-time prices:
- Check TRCL current price Market Price
- Check QNT current price Market Price
II. Core Factors Influencing TRCL vs QNT Investment Value
Supply Mechanism Comparison (Tokenomics)
- TRCL: The available reference materials do not provide specific information regarding the supply mechanism of TRCL.
- QNT: The available reference materials do not provide specific information regarding the supply mechanism of QNT.
Institutional Adoption and Market Application
- Institutional Holdings: The reference materials indicate that investment value is influenced by market demand and regulatory policies, though specific institutional preference data for either asset is not detailed in the provided sources.
- Enterprise Adoption: Information regarding the specific adoption of TRCL or QNT in cross-border payments, settlements, or investment portfolios is not available in the reference materials.
- National Policies: The materials mention that regulatory policies affect investment value, though specific governmental stances toward TRCL or QNT across different jurisdictions are not elaborated.
Technology Development and Ecosystem Building
- TRCL Technology Upgrades: The reference materials note that technological innovation represents one factor influencing valuation, but specific upgrade details and potential impacts are not provided.
- QNT Technology Development: Similarly, while technology innovation is mentioned as a value driver, concrete development milestones or roadmap information is absent from the materials.
- Ecosystem Comparison: The reference materials do not contain specific information regarding DeFi, NFT, payment systems, or smart contract implementation for either TRCL or QNT.
Macroeconomic Environment and Market Cycles
- Performance in Inflationary Environments: The reference materials mention that macroeconomic trends influence price fluctuations, but do not provide comparative analysis of anti-inflation properties for either asset.
- Macroeconomic Monetary Policy: While the materials indicate that broader economic trends affect valuations, specific analysis of interest rates or dollar index impacts on TRCL or QNT is not available.
- Geopolitical Factors: The reference materials acknowledge that market sentiment and policy monitoring play roles in price movements, though detailed analysis of cross-border transaction demand or international situations is not present.
📌 According to the reference materials, the investment value of both TRCL and QNT appears to be influenced by market demand, technological innovation, and regulatory policies, with price volatility primarily driven by market sentiment and broader market trends. Investors may need to monitor market dynamics and policy developments when evaluating these assets.
III. 2026-2031 Price Prediction: TRCL vs QNT
Short-term Prediction (2026)
- TRCL: Conservative $0.00046 - $0.00074 | Optimistic $0.00074 - $0.0010
- QNT: Conservative $62.87 - $67.60 | Optimistic $67.60 - $96.67
Mid-term Prediction (2028-2029)
- TRCL may enter a consolidation phase with projected price range of $0.00055 - $0.0012
- QNT may enter an expansion phase with projected price range of $52.63 - $137.17
- Key drivers: institutional capital flows, ETF developments, ecosystem growth
Long-term Prediction (2030-2031)
- TRCL: Baseline scenario $0.00081 - $0.0011 | Optimistic scenario $0.0011 - $0.0012
- QNT: Baseline scenario $78.42 - $132.91 | Optimistic scenario $132.91 - $192.72
Disclaimer
TRCL:
| Year | Predicted High Price | Predicted Average Price | Predicted Low Price | Price Change |
|---|---|---|---|---|
| 2026 | 0.0010367 | 0.0007405 | 0.00045911 | 0 |
| 2027 | 0.000959688 | 0.0008886 | 0.000568704 | 20 |
| 2028 | 0.0009703512 | 0.000924144 | 0.00065614224 | 24 |
| 2029 | 0.001240894356 | 0.0009472476 | 0.000549403608 | 27 |
| 2030 | 0.0011487745269 | 0.001094070978 | 0.00088619749218 | 47 |
| 2031 | 0.001188708117597 | 0.00112142275245 | 0.000807424381764 | 51 |
QNT:
| Year | Predicted High Price | Predicted Average Price | Predicted Low Price | Price Change |
|---|---|---|---|---|
| 2026 | 96.668 | 67.6 | 62.868 | 0 |
| 2027 | 109.23822 | 82.134 | 60.77916 | 21 |
| 2028 | 129.1762485 | 95.68611 | 52.6273605 | 41 |
| 2029 | 137.166038685 | 112.43117925 | 61.8371485875 | 65 |
| 2030 | 141.022428133275 | 124.7986089675 | 82.36708191855 | 84 |
| 2031 | 192.720251898061875 | 132.9105185503875 | 78.417205944728625 | 96 |
IV. Investment Strategy Comparison: TRCL vs QNT
Long-term vs Short-term Investment Strategies
- TRCL: May be considered by investors with higher risk tolerance who are exploring early-stage blockchain projects in niche sectors such as automotive services. The limited liquidity and lower market capitalization suggest this asset remains in an experimental phase.
- QNT: May appeal to investors interested in enterprise blockchain infrastructure and cross-chain interoperability solutions. The relatively established market position and broader exchange availability could support medium to long-term holding strategies.
Risk Management and Asset Allocation
- Conservative Investors: TRCL 5-10% vs QNT 15-25% (within cryptocurrency portfolio allocation)
- Aggressive Investors: TRCL 15-20% vs QNT 30-40% (within cryptocurrency portfolio allocation)
- Hedging Tools: Stablecoin allocation for liquidity management, diversified cross-asset positioning, monitoring of market correlation patterns
Note: These allocation ranges represent potential frameworks within a diversified cryptocurrency portfolio and should be adjusted based on individual risk profiles and investment objectives.
V. Potential Risk Comparison
Market Risks
- TRCL: Faces substantial liquidity constraints with availability on only one exchange, significant concentration risk with 181 holders, and considerable price volatility as evidenced by historical fluctuations. The market cap positioning at rank 2738 indicates limited market depth.
- QNT: While demonstrating broader market acceptance across 40 exchanges and a larger holder base of 160,929, the asset remains subject to cryptocurrency market cycles and sentiment shifts, as reflected in the current Extreme Fear index reading of 14.
Technical Risks
- TRCL: Limited information regarding network infrastructure, scalability solutions, and security audit history presents evaluation challenges for technical risk assessment.
- QNT: Specific details regarding network performance metrics, upgrade protocols, and potential technical vulnerabilities are not available in the reference materials, though the focus on interoperability infrastructure suggests complex technical dependencies.
Regulatory Risks
- Both TRCL and QNT operate within an evolving regulatory landscape where jurisdictional approaches to cryptocurrency classification, taxation, and compliance requirements continue to develop. The automotive services focus of TRCL and enterprise infrastructure positioning of QNT may encounter different regulatory considerations across various markets.
VI. Conclusion: Which Is the Better Buy?
📌 Investment Value Summary:
- TRCL Characteristics: Represents an early-stage project with a specific use case in blockchain-based automotive services, characterized by limited liquidity, concentrated holder base, and substantial price volatility. Current market positioning suggests speculative attributes.
- QNT Characteristics: Demonstrates more established market presence through broader exchange listings, larger community adoption, and positioning in enterprise blockchain interoperability infrastructure. Historical performance shows participation in broader market cycles.
✅ Investment Considerations:
- New Investors: May benefit from focusing on assets with greater liquidity, broader market acceptance, and more accessible information for evaluation. Understanding fundamental blockchain concepts and market dynamics remains essential before considering either asset.
- Experienced Investors: Could evaluate position sizing based on risk-adjusted return expectations, portfolio diversification objectives, and alignment with specific blockchain sector theses. Monitoring technical developments, adoption metrics, and regulatory environments may inform ongoing assessment.
- Institutional Investors: May prioritize assets with sufficient liquidity depth, regulatory clarity, clear use case validation, and established market infrastructure. Due diligence regarding custody solutions, compliance frameworks, and counterparty considerations remains fundamental.
⚠️ Risk Disclosure: Cryptocurrency markets exhibit significant volatility and uncertainty. This content does not constitute investment advice, financial guidance, or recommendations. Individuals should conduct comprehensive research, assess personal risk tolerance, and consider consulting qualified professionals before making investment decisions.
VII. FAQ
Q1: What is the primary difference in market positioning between TRCL and QNT?
QNT holds position 75 with a market cap exceeding $985 million across 40 exchanges, while TRCL ranks at position 2738 with approximately $737,943 market cap on only 1 exchange. QNT targets enterprise blockchain interoperability infrastructure with the Overledger operating system, whereas TRCL focuses on blockchain-based second-hand car service verification. The substantial disparity in holder base (160,929 for QNT vs 181 for TRCL) and trading volume ($632,725.31 vs $18,911.01) reflects QNT's significantly more established market presence and liquidity depth compared to TRCL's early-stage positioning.
Q2: How have TRCL and QNT performed historically from their peak prices?
Both assets experienced significant declines from their historical peaks during the 2021-2022 market cycle. TRCL dropped from $0.300077 in April 2021 to $0.000039 before recovering to the current $0.0007405, representing over 99% decline from peak. QNT retreated from $427.42 in September 2021 to $0.215773 before partial recovery to current $67.78, representing approximately 84% decline from peak. These historical patterns demonstrate the substantial volatility characteristic of cryptocurrency markets and the importance of understanding market cycle dynamics.
Q3: What are the projected price ranges for TRCL and QNT through 2031?
For 2026, TRCL's conservative projection ranges from $0.00046 to $0.00074, with optimistic scenarios reaching $0.0010, while QNT's conservative range spans $62.87 to $67.60, with optimistic projections up to $96.67. By 2031, TRCL's baseline scenario projects $0.00081 to $0.0011 with optimistic potential of $0.0012, whereas QNT's baseline scenario ranges from $78.42 to $132.91 with optimistic projections reaching $192.72. These projections suggest QNT demonstrates higher absolute price potential, while both assets remain subject to market cycles, technological developments, and adoption trends.
Q4: What portfolio allocation strategies might investors consider for TRCL vs QNT?
Conservative investors might consider allocating 5-10% to TRCL versus 15-25% to QNT within their cryptocurrency portfolio, while aggressive investors could allocate 15-20% to TRCL versus 30-40% to QNT. These allocation frameworks reflect TRCL's higher risk profile due to limited liquidity and early-stage positioning, compared to QNT's more established market presence. Investors should adjust these ranges based on individual risk tolerance, investment objectives, and overall portfolio diversification strategy, while maintaining stablecoin positions for liquidity management and implementing hedging tools across different market conditions.
Q5: What are the main liquidity considerations when comparing TRCL and QNT?
TRCL faces substantial liquidity constraints with availability on only 1 exchange, 181 holders, and 24-hour trading volume of $18,911.01, creating challenges for entry and exit execution, particularly for larger position sizes. QNT demonstrates significantly greater liquidity across 40 exchanges with 160,929 holders and $632,725.31 in 24-hour volume, providing more favorable conditions for trade execution and price discovery. The liquidity differential represents a critical factor for risk management, as lower liquidity assets typically experience wider bid-ask spreads, higher slippage, and increased difficulty during market stress periods.
Q6: What technical and regulatory risks differentiate TRCL from QNT?
TRCL's technical risks include limited available information regarding network infrastructure, scalability solutions, and security audit history, combined with concentration risk from its narrow holder base and single exchange listing. QNT, while demonstrating broader market acceptance, carries technical dependencies related to its interoperability infrastructure and complex cross-chain protocols. Both assets face evolving regulatory landscapes, though TRCL's automotive services focus and QNT's enterprise infrastructure positioning may encounter different regulatory considerations across jurisdictions. Investors should monitor regulatory developments in relevant markets and assess compliance frameworks when evaluating either asset.
Q7: Which investor profile might find TRCL or QNT more suitable?
New investors may benefit from focusing on QNT due to greater liquidity, broader exchange availability, and more accessible evaluation information, though comprehensive understanding of blockchain fundamentals remains essential before considering either asset. Experienced investors could evaluate TRCL for speculative exposure to niche blockchain applications while sizing positions according to risk-adjusted expectations, whereas QNT may align with theses around enterprise blockchain infrastructure. Institutional investors typically prioritize sufficient liquidity depth, regulatory clarity, and established market infrastructure, characteristics more aligned with QNT's current positioning compared to TRCL's early-stage profile.
Q8: What market sentiment factors should investors monitor for TRCL and QNT?
As of February 4, 2026, the Fear & Greed Index stands at 14 (Extreme Fear), indicating broader market uncertainty that affects both assets. Investors should monitor market cycle dynamics, institutional capital flows, ETF developments, and ecosystem growth metrics specific to each project's focus area. For TRCL, tracking automotive industry blockchain adoption and platform utilization provides relevant signals, while QNT investors should follow enterprise blockchain deployment trends and cross-chain interoperability developments. Understanding correlation patterns with broader cryptocurrency markets and traditional financial assets helps inform positioning decisions during different market environments.
Share
Content
Introduction: Investment Comparison Between TRCL and QNT
I. Historical Price Comparison and Current Market Status
II. Core Factors Influencing TRCL vs QNT Investment Value
III. 2026-2031 Price Prediction: TRCL vs QNT
IV. Investment Strategy Comparison: TRCL vs QNT
V. Potential Risk Comparison
VI. Conclusion: Which Is the Better Buy?
VII. FAQ
How to Buy Cryptocurrency


Trending Cryptocurrencies


XZXX: A Comprehensive Guide to the BRC-20 Meme Token in 2025

Survey Note: Detailed Analysis of the Best AI in 2025

Detailed Analysis of the Best 10 GameFi Projects to Play and Earn in 2025
Kaspa’s Journey: From BlockDAG Innovation to Market Buzz
Best Crypto Wallets 2025: How to Choose and Secure Your Digital Assets

Popular GameFi Games in 2025
What are the key derivatives market signals showing about funding rates, open interest, and liquidation data in 2026?

How to Use Technical Indicators (MACD, RSI, KDJ) to Predict Crypto Price Movements in 2026

What is Euler (EUL) DeFi Super App: Whitepaper logic, use cases, and technical innovations explained

What are the main security risks and vulnerabilities affecting TRX and TRON smart contracts in 2026?

What is Worldcoin (WLD) and how does its iris biometric verification technology work for digital identity authentication?