Crypto Market Overview
Between January 13 and January 26, 2026, markets faced rising concerns over growth, inflation, and geopolitical risks as Trump escalated efforts to acquire Greenland and used a proposed 10% tariff increase on multiple countries as a negotiation tool. Risk-off sentiment spread, the U.S. dollar weakened, and global risk assets came under pressure, with the crypto market entering a defensive phase.
From a price-action perspective, BTC failed to sustain its 4-hour rebound, weakened again, broke below short-term moving averages, and moved beneath mid-term averages, shifting structure from range-bound to bearish bias. ETH showed even greater weakness, remaining below the MA30 and forming a bearish moving-average alignment.【1】
On-chain and ecosystem flows reflected defensive positioning. Ethereum became the primary capital sink, recording nearly $350 million in net inflows, while high-leverage active networks such as Hyperliquid and StarkNet saw large net outflows, indicating a clear cooling in derivatives risk appetite. Fundamentally, Solana’s staking ratio rose to a record 68.8%, the Ethereum community advanced native DVT integration to strengthen decentralization, and certain sectors such as prediction markets intensified traffic competition via “points + zero-fee” models.
Overall, macro uncertainty continues to dominate market rhythm. Crypto assets exhibit a defensive structure characterized by weakening majors, capital returning to main chains, and leverage contraction. Short-term BTC holders have broadly remained in unrealized loss territory since November 2025; a move back above $98,000 could become key for sentiment repair. Structural opportunities remain, but are limited to a small number of assets with clear fundamentals or event catalysts. The broader market remains in a phase of macro-suppressed, localized rotation.
Overview of Price Performance
This report groups the top 500 tokens by market cap to observe their average performance between January 13 and January 26.
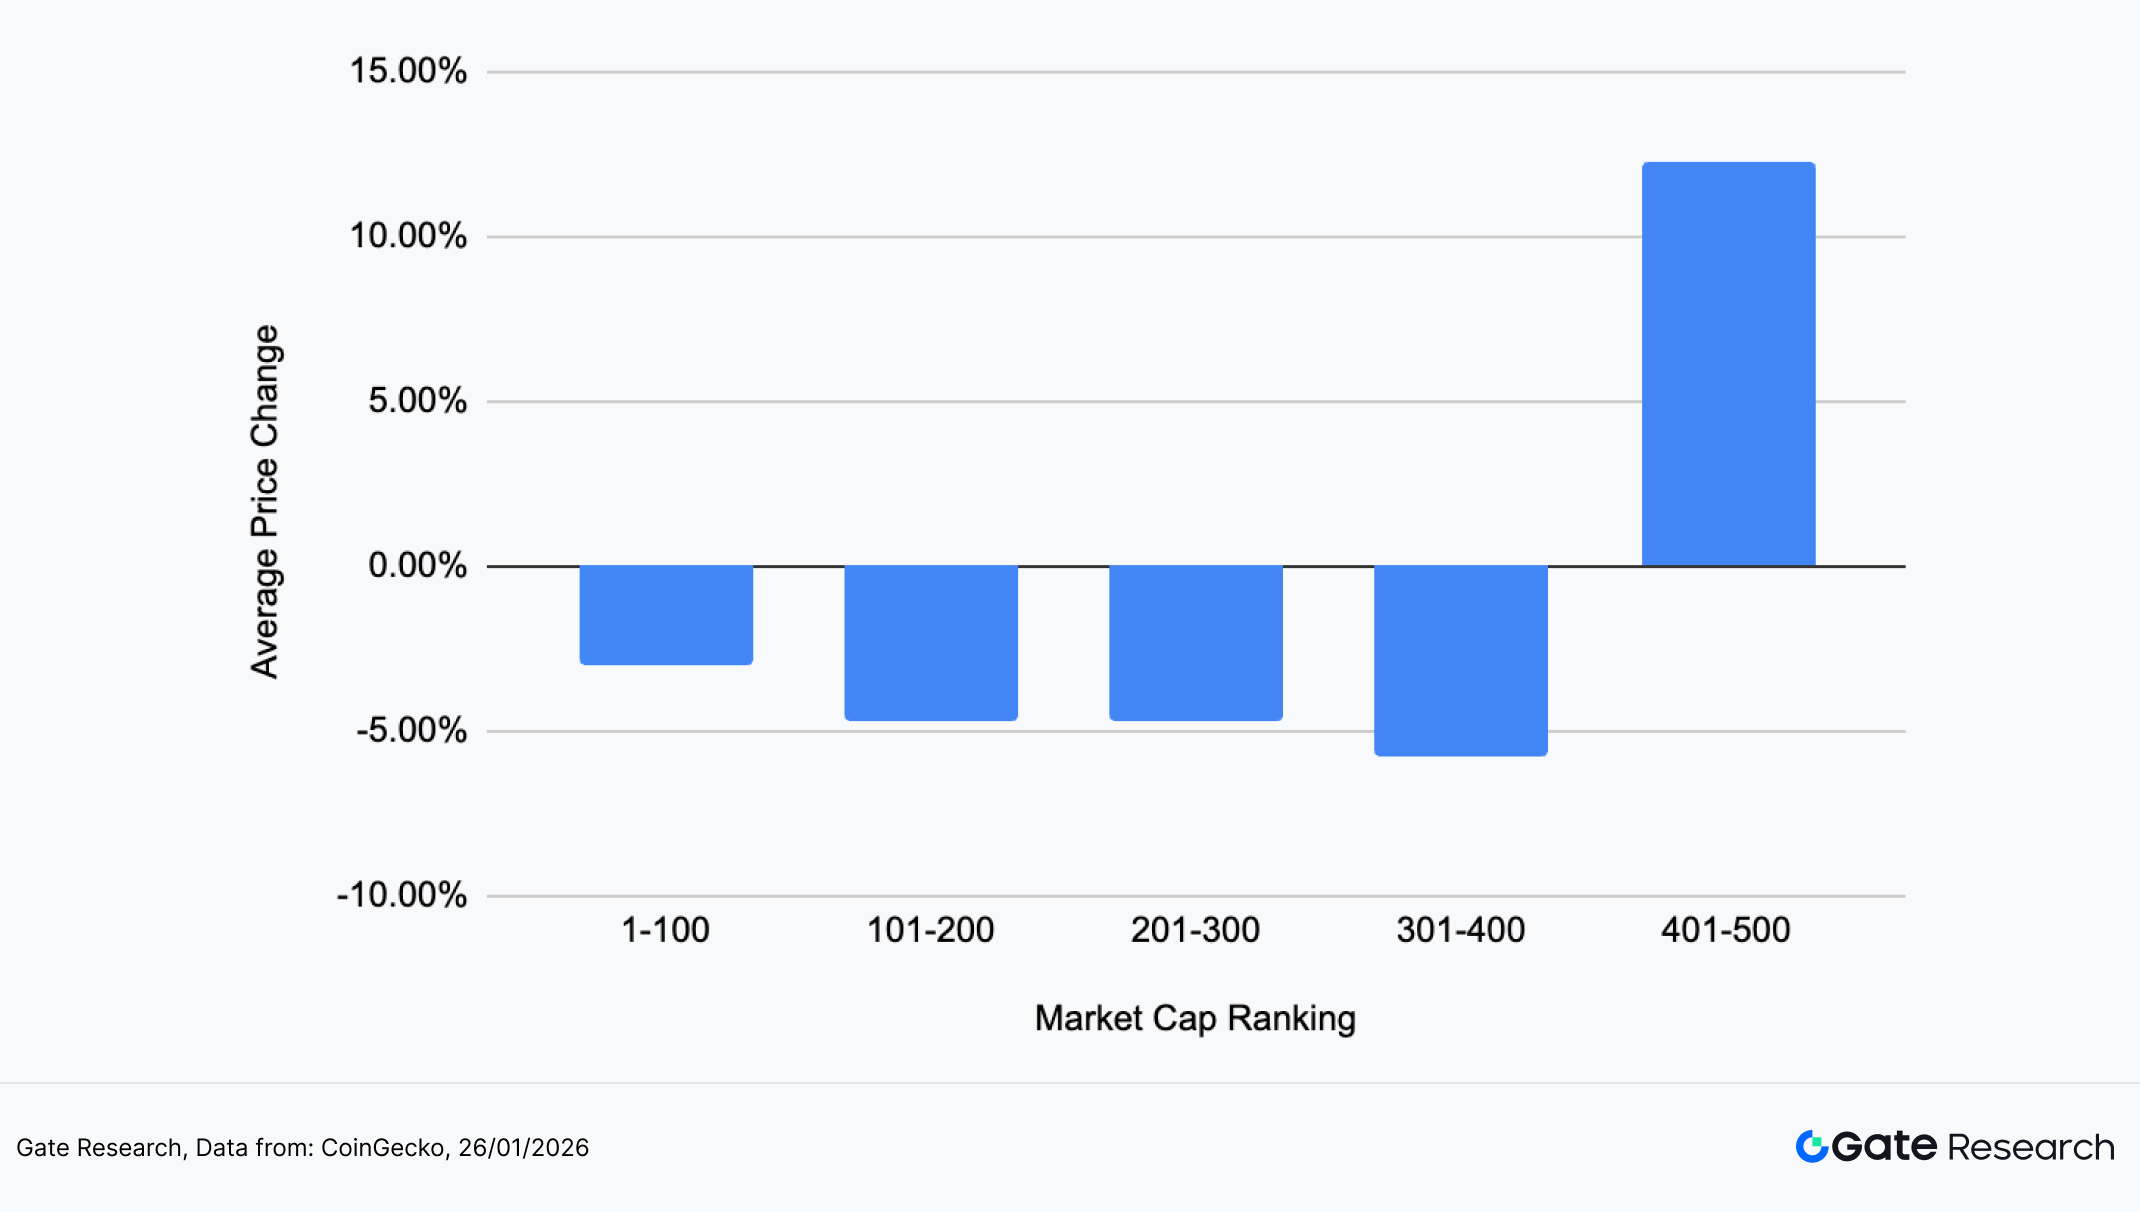
Market-cap structure showed clear divergence. The top 400 tokens declined modestly (around -3% to -6%), with losses slightly widening as market cap decreased, reflecting orderly but persistent outflows from large- and mid-caps during risk-aversion. In contrast, the 401–500 market-cap segment gained an average of +12.28%, the only group with positive returns, showing capital rotating into high-beta small-caps and rising short-term speculative sentiment.
This was not a systemic selloff but rather a “large-cap defense, small-cap activity” rotation. Major assets remained weak but stable, while tail-end small caps experienced strong capital-driven moves. Market style temporarily shifted toward high-beta sectors, with early signs of marginal risk-appetite recovery.
Based on CoinGecko data, the top 500 tokens by market capitalization were divided into groups of 100 (e.g., ranks 1–100, 101–200, etc.). For each group, price changes from January 13 to January 26 were measured and averaged to derive the segment’s mean return. The overall average decline (-1.16%) represents the simple average of individual returns across the top 500 tokens, unweighted by market cap.
Figure 1: Small-cap sectors significantly outperformed while large-cap assets remained broadly weak, highlighting a clearly layered rotational market structure.
Top Gainers and Losers
Over the past two weeks, markets showed strong divergence under overall consolidation, with capital concentrating in high-elasticity themes.
Gainers: Meme Assets Lead — PENGUIN Becomes Breakout Star
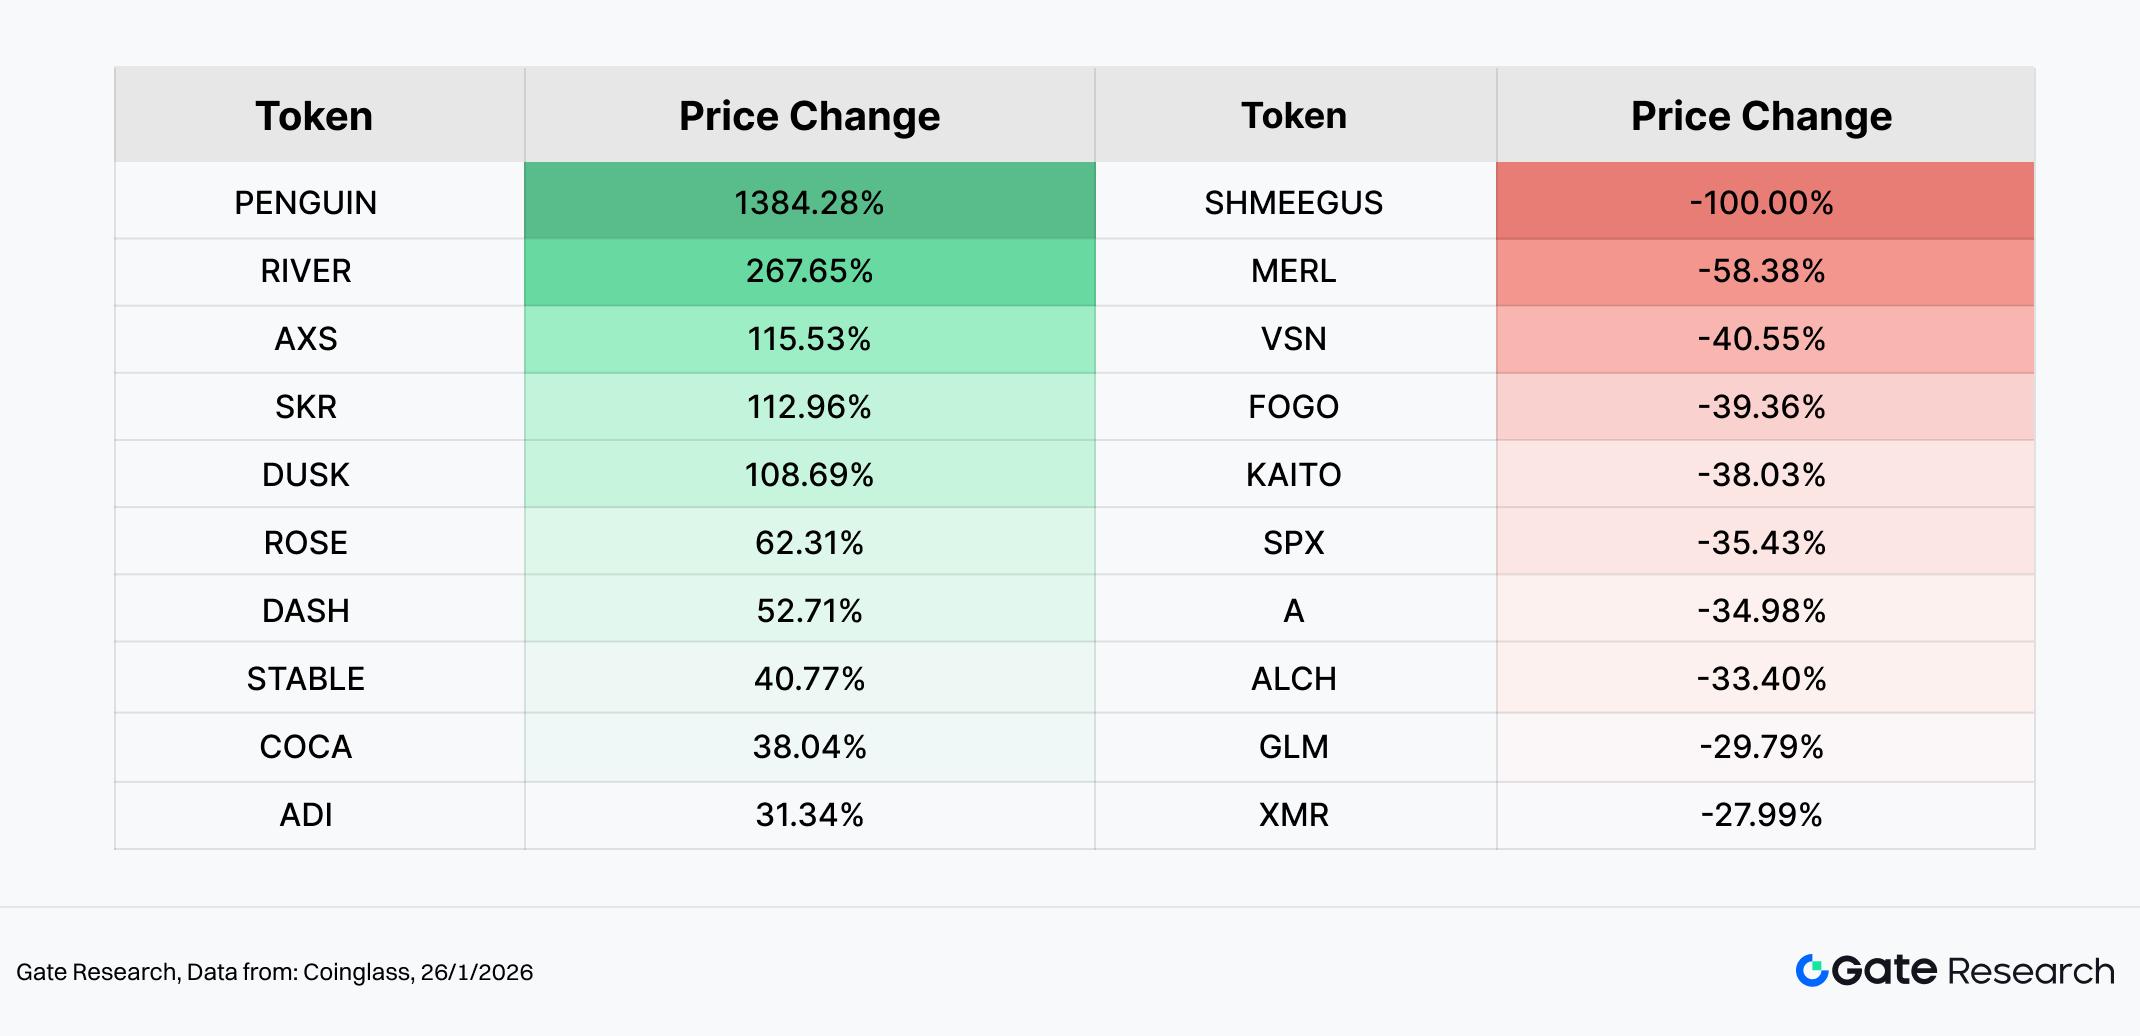
PENGUIN (+1,384.28%) topped the gainers. A Solana-based meme coin built around the “Nietzschean Penguin” community IP, it blends philosophical meme culture with crypto-native humor, creating strong virality and cohesion. Its X (Twitter) account significantly increased activity in late January, pushing official links, community portals, and visual branding, driving renewed attention and inflows.
Drivers included:
- Stronger community mobilization
- High elasticity due to small float
- Meme rotation window during major-asset weakness
Other top performers shared the “mid-small cap + narrative driven” pattern, including RIVER (+267.65%), AXS (+115.53%), SKR (+112.96%), and DUSK (+108.69%), mostly supported by catalysts, narrative recovery, or capital rotation.
Losers: High-Volatility Themes Retrace
SHMEEGUS (-100%) nearly lost all market value, highlighting liquidity risks in ultra-small meme assets. MERL (-58.38%), VSN (-40.55%), and FOGO (-39.36%) also saw sharp pullbacks, mostly among previously overextended narrative tokens reliant on liquidity. Without sustained inflows, speculative sentiment cooled rapidly.
This period’s leaderboard shows rotation toward high-elasticity small caps, driven more by sentiment and liquidity than fundamental improvement. Majors remained weak while volatility rose in fringe sectors, reflecting unstable risk appetite and short-term capital behavior.
Figure 2: PENGUIN surged over 1,380% in the past two weeks, with rising community activity and meme narrative rotation reinforcing each other, making it a focal point of short-term capital speculation.
Relationship Between Market Cap Ranking and Price Performance
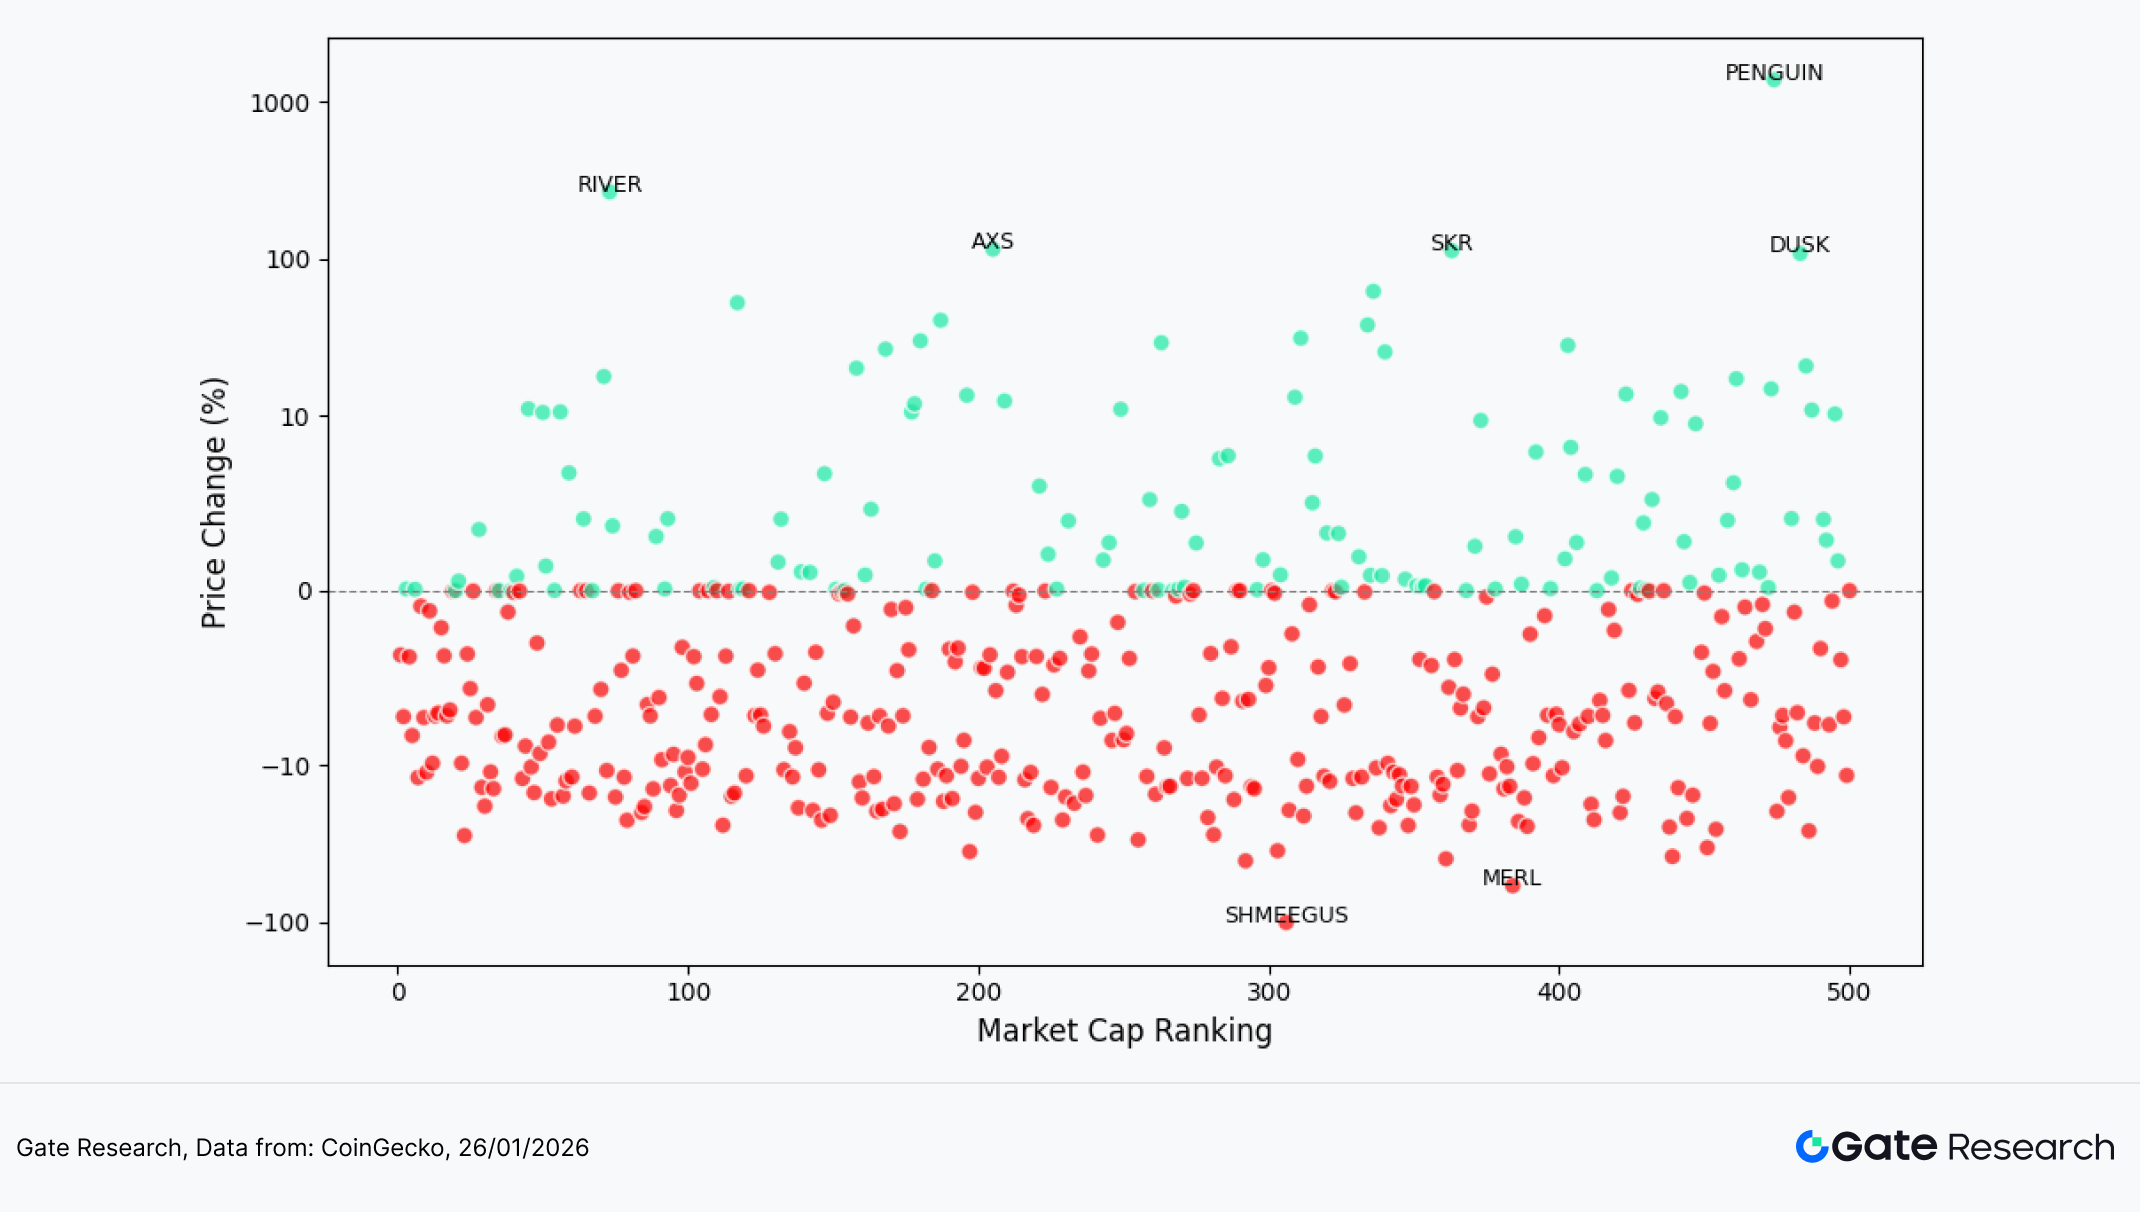
To examine the structural characteristics of token performance in this market phase, this report presents a scatter plot of the top 500 tokens by market capitalization. The horizontal axis represents market cap ranking (larger caps to the left), while the vertical axis shows price performance between January 13 and January 26. Each dot represents a token, with green indicating gains and red indicating declines.
From the overall distribution, negative-return tokens dominate, with a large number of projects clustered in the -5% to -20% range. This indicates that the broader market environment remains weak and that pullbacks are relatively widespread. However, a small number of extreme positive outliers also appear, clearly concentrated in the lower market-cap ranks, forming a high-elasticity structure detached from large-cap trends.
The strongest gainers include PENGUIN, RIVER, AXS, SKR, and DUSK, all located in the mid-to-lower market-cap tiers. Among them, PENGUIN far outperformed others, standing out as a clear outlier and reflecting a typical pattern of community-driven momentum combined with sentiment-fueled capital flows. These assets tend to have smaller market caps and more concentrated token distribution, making them attractive short-term trading vehicles when the broader market lacks a clear narrative. In contrast, large-cap tokens showed price changes clustered around the zero line with reduced volatility, highlighting strengthened defensive characteristics. Meanwhile, the most severe drawdowns were also concentrated in mid-to-lower cap tiers—such as SHMEEGUS and MERL—with declines far exceeding market averages, reflecting the two-sided amplification effect of small-cap assets under liquidity fluctuations.
Overall, the chart clearly illustrates the core features of this market phase: large-cap consolidation with compressed volatility, and highly divergent, high-volatility performance in small caps. Capital has not exited the market entirely amid macro uncertainty, but has rotated from major assets into high-elasticity tokens for short-term trading. This has led to a fat-tailed return distribution among mid-to-lower cap tokens, with market risk appetite characterized by a trading-driven and sentiment-dominated phase.
Figure 3: The scatter plot of market cap ranking versus price performance shows amplified volatility in the small-cap range, with extreme gainers and losers concentrated in mid-to-lower market cap tiers, reflecting pronounced structural divergence.
Top 100 Market Cap Leaders
During this consolidation phase, volatility among the top 100 tokens by market capitalization generally compressed, but internal performance diverged notably as capital rotated quickly between defensive positioning and thematic trades.
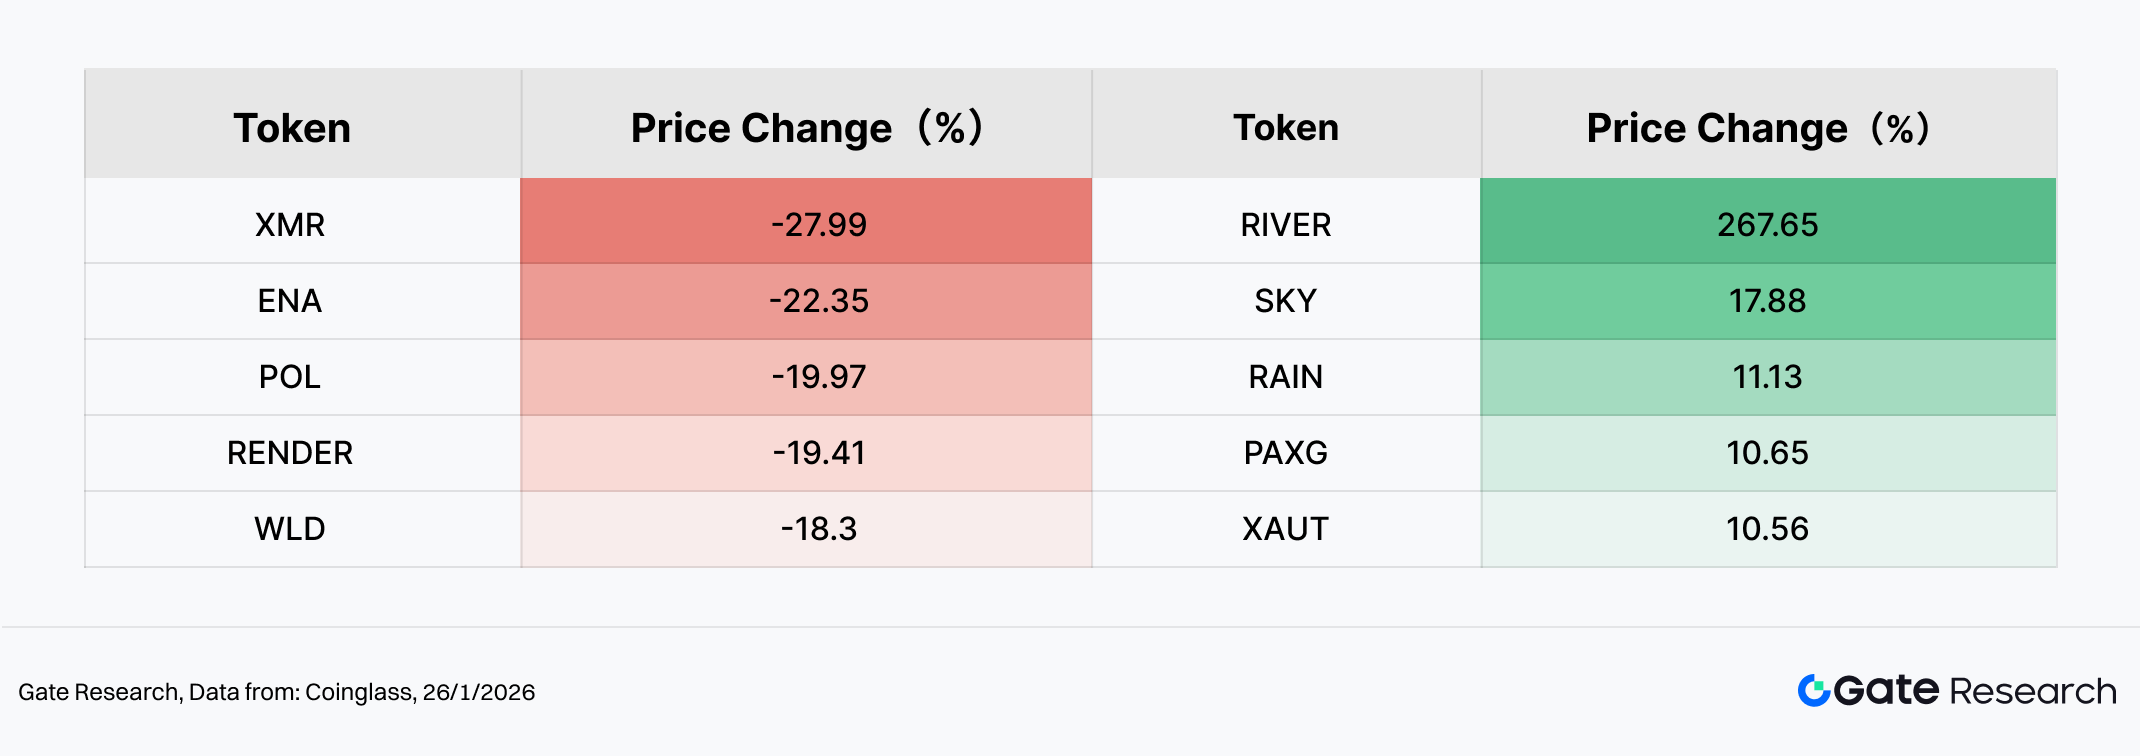
On the upside (excluding stablecoins and LSD tokens), RIVER (+267.65%) led by a wide margin, displaying a classic event-driven, high-elasticity move. As a cross-ecosystem liquidity infrastructure protocol, RIVER recently announced partnerships with U Tech / United Stables to expand multi-chain use cases for the stablecoin $U, and also completed a $12 million strategic financing, strengthening market expectations around real adoption and capital backing. In a choppy market, the narrative of “infrastructure + stablecoin liquidity” tends to attract concentrated capital attention, making RIVER a temporary focal asset. SKY (+17.88%) and RAIN (+11.13%) followed with moderate gains, reflecting selective rotation into mid-cap projects. Meanwhile, PAXG (+10.65%) and XAUT (+10.56%) also ranked among top performers, indicating rising allocation demand for on-chain gold assets as safe-haven alternatives amid macro uncertainty and a weakening dollar.
On the downside, pullbacks within the top 100 were more concentrated in previously strong or high-beta assets. XMR (-27.9%) led declines, as capital retreated from the privacy sector under tightening liquidity conditions. ENA (-22.35%), POL (-19.97%), RENDER (-19.41%), and WLD (-18.30%) followed, most of which had previously traded at narrative-driven premiums or experienced substantial prior rallies, and thus faced clearer valuation compression as risk appetite cooled.
Overall, the top-100 structure reflects a pattern of defensive and select event-driven assets rising, while high-beta narrative tokens retrace. Major heavyweight assets showed limited volatility, but capital began reallocating within the crypto ecosystem: part flowing into safe-haven on-chain gold assets, and part concentrating on select high-elasticity opportunities, while previously popular narrative tokens faced valuation pressure. This suggests the market remains in a phase of risk repricing and style rebalancing.
Figure 4: Among the Top 100, leading gainers included RIVER and two gold-backed tokens (PAXG, XAUT), reflecting the coexistence of on-chain safe-haven demand and structural trading opportunities.
Volume Surge Analysis
Trading Volume Growth Analysis
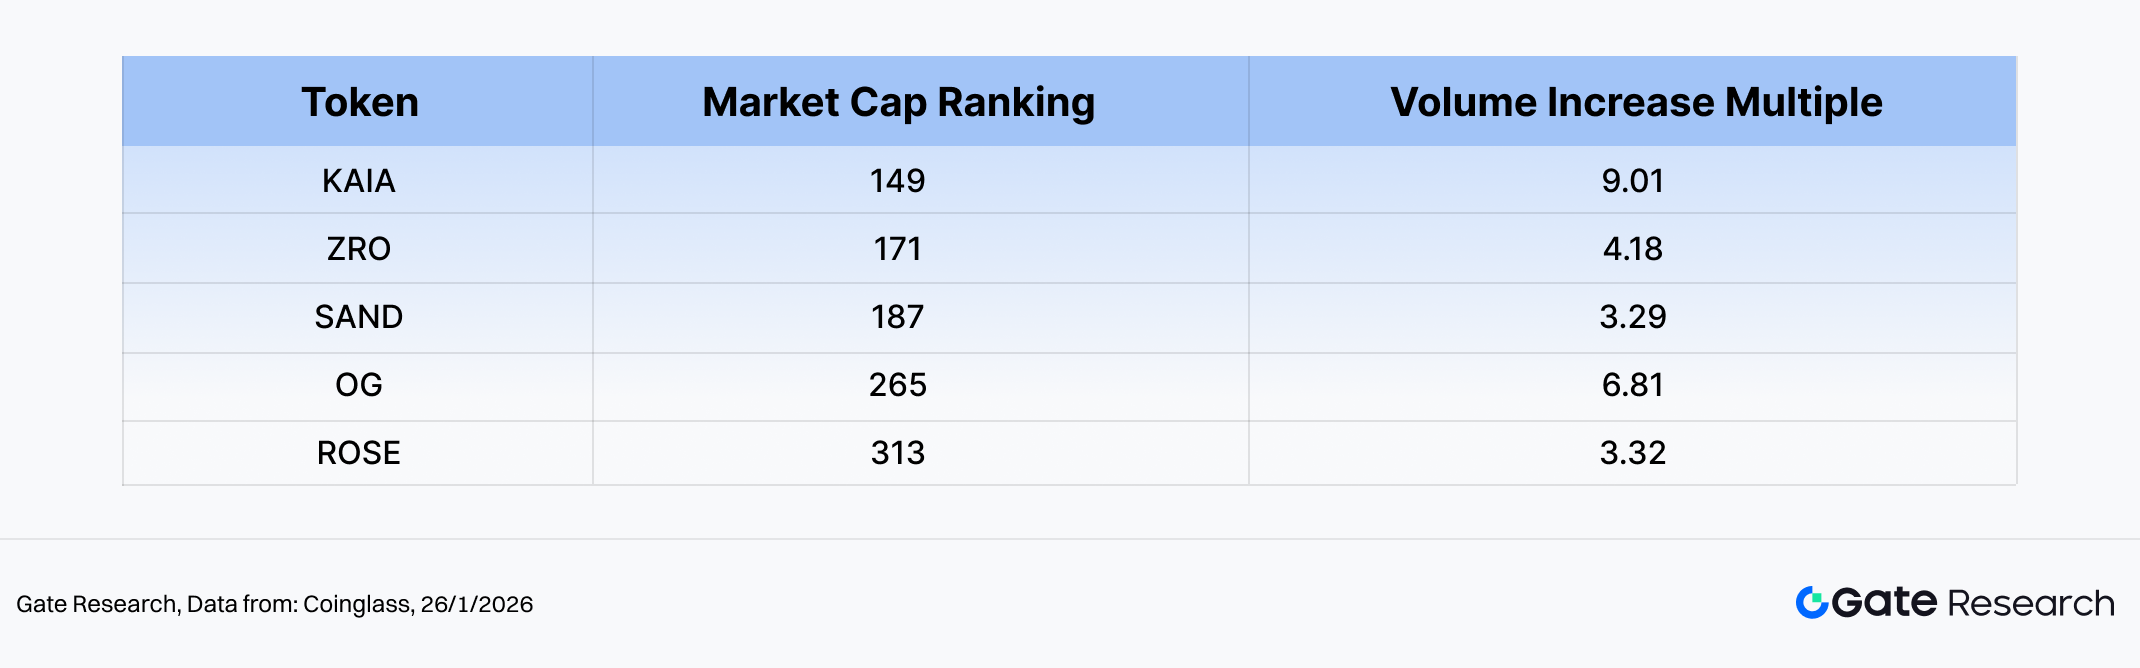
Beyond price performance, several mid-cap tokens showed notable surges in trading volume during this period. Using pre-breakout volume as a baseline, KAIA, ZRO, SAND, OG, and ROSE recorded volume expansions of 3 to 9 times, indicating a phased return of capital and a marginal improvement in overall market activity.
The structure of this volume expansion shows clear stratification. KAIA and ZRO experienced both rising volume and price appreciation, representing actively driven rebounds supported by capital inflows. ROSE, meanwhile, posted the largest price gain despite relatively moderate volume growth, highlighting the high elasticity of mid-cap assets during capital re-engagement phases. In contrast, although OG and SAND saw significant increases in trading activity, their price responses were limited, suggesting liquidity repair rather than aggressive trend-following capital, with buying interest still relatively cautious.
Overall, the tokens showing volume expansion were characterized by “volume up with price gains, but with clear divergence in strength.” This suggests that capital is not merely hedging or exiting the market, but is beginning to selectively position within the mid-cap segment. However, in some cases, price appreciation has yet to fully match the scale of volume growth, indicating that market sentiment currently reflects tentative capital re-entry rather than the start of a broad trend-driven rally.
Figure 5: Tokens such as KAIA, ZRO, and ROSE saw significant volume expansion accompanied by rebounds, indicating phased capital return, though with clearly differentiated strength.
Volume-Price Relationship Analysis
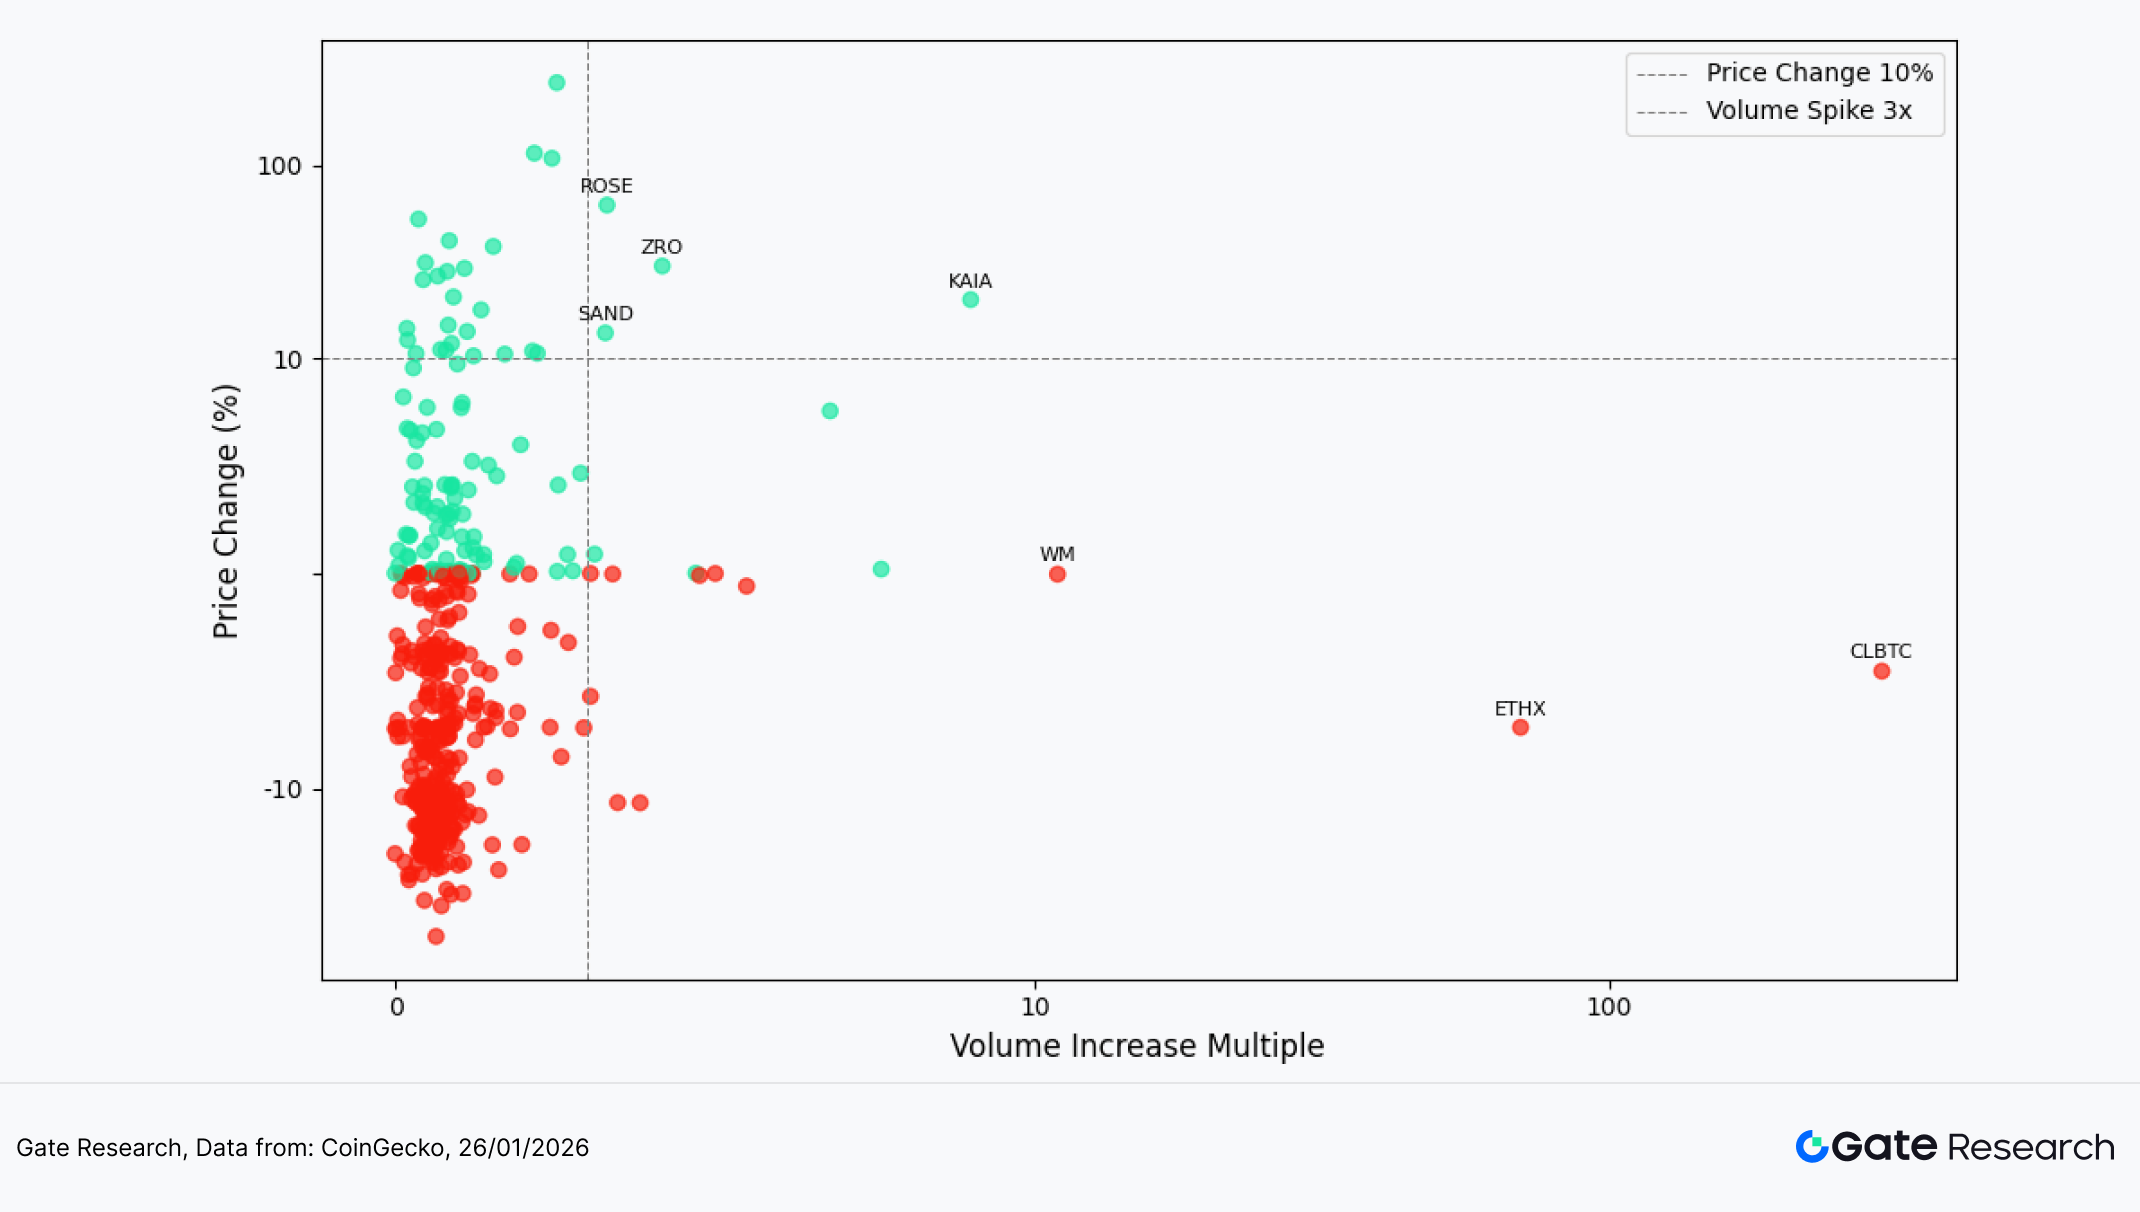
Building on the observation of abnormal volume activity, this report further integrates price performance by plotting a scatter chart of Volume Increase Multiple versus Price Change (%). The horizontal axis represents how many times a token’s trading volume has grown over the past two weeks relative to a baseline period, while the vertical axis shows the percentage price change over the same timeframe. A symmetric logarithmic scale is applied to better illustrate the structural relationship between volume expansion and price movement.
A small number of tokens in the upper-right quadrant display volume–price resonance, including KAIA, ZRO, ROSE, and SAND. These assets experienced significant volume expansion alongside positive price performance, reflecting a phased return of capital into mid-cap, high-elasticity tokens. Among them, ROSE posted the most pronounced gain, indicating a resonance between sentiment-driven momentum and capital inflows. In contrast, the right side of the chart also shows a few large-cap assets (such as ETHX and CLBTC) where volume increased but prices weakened, suggesting that higher trading activity in these cases was driven by rebalancing, hedging, or structural fund flows, rather than trend-following long positioning.
Overall, the market during this period shows a divergent structure characterized by widespread low-volume weakness and limited volume-supported advances. While tokens with sharply rising volume have begun to drive localized rebounds, this dynamic has not yet spread to major assets. The market remains in a tentative capital re-entry phase rather than a broad recovery in risk appetite.
Figure 6: The scatter distribution shows that most tokens remain in a low-volume, weak-price zone, with only a few mid-cap assets experiencing volume–price resonance rebounds.
Correlation Analysis
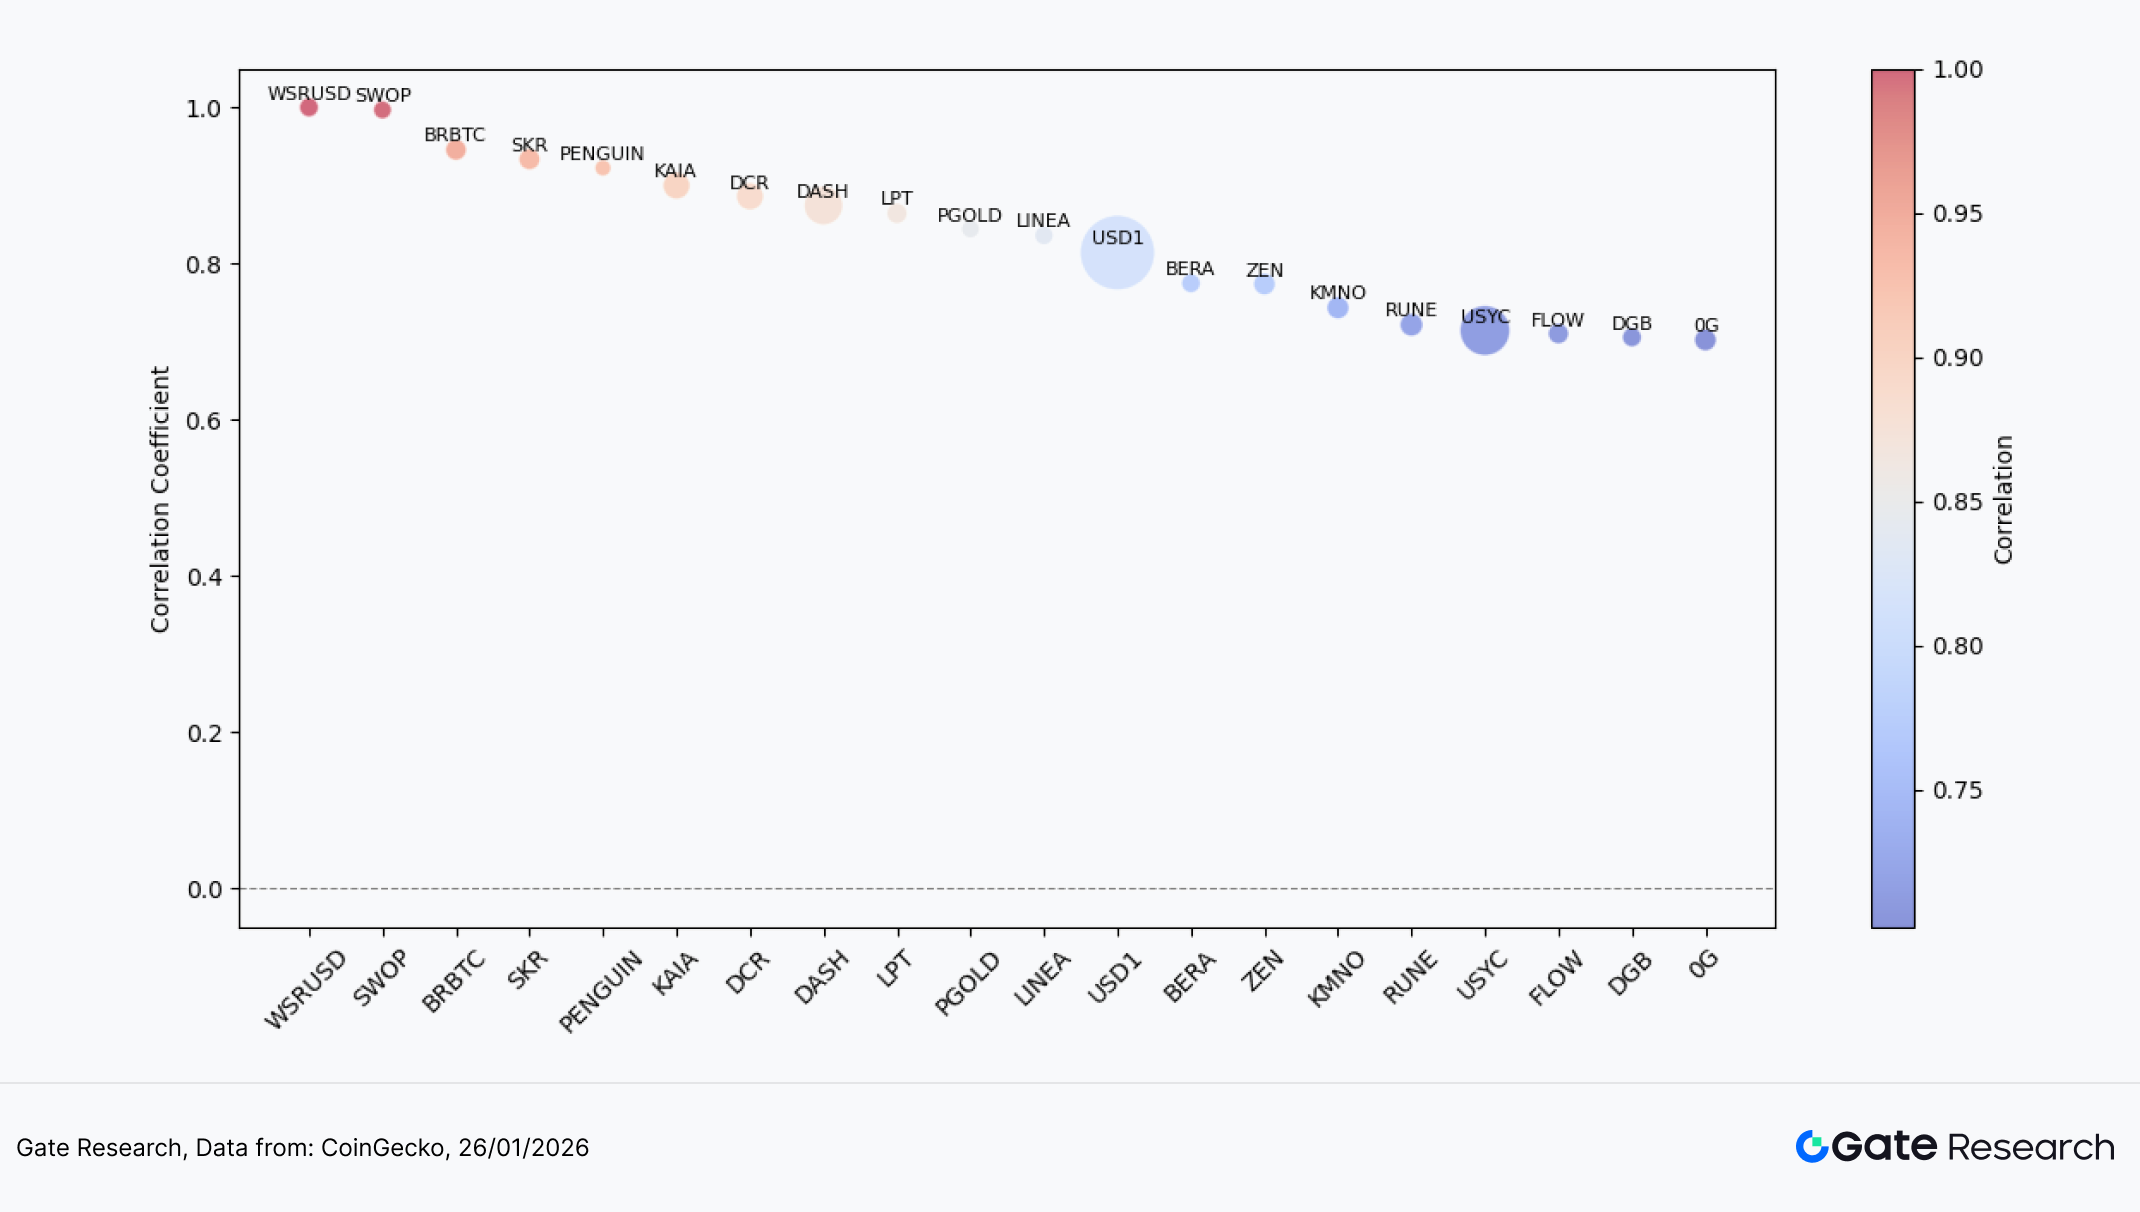
After examining the relationship between trading volume and price performance, this report further analyzes their systematic correlation from a statistical perspective. To measure the impact of capital activity on price volatility, we use “volume growth rate ÷ market capitalization” as a proxy for relative activity, and calculate its correlation with price change. This helps identify which types of tokens in the current market are most sensitive to capital-driven moves.
The chart shows that most tokens exhibit correlations concentrated in the 0.7–0.9 range, indicating that the market remains in a strong liquidity-driven environment—volume expansion is often accompanied by price movement, and sentiment and liquidity significantly influence short-term trends.
Correlation levels also display clear stratification. Tokens such as WSRUSD, SWOP, PENGUIN, KAIA, and DASH fall into the high-correlation zone, where prices are highly sensitive to changes in trading volume, reflecting dominance by sentiment and short-term capital flows. PGOLD, LINEA, USD1, and BERA occupy a middle tier, still influenced by capital flows but with relatively more controlled volatility, aligning more with structural rotation. Meanwhile, RUNE, FLOW, and OG show lower correlation, suggesting their price movements are driven more by project-specific fundamentals or distinct capital structures, with limited amplification from market sentiment. Overall, this indicates that market capital is primarily amplifying volatility in high-elasticity assets, while some functional and mid-cap projects are gradually developing more independent price behavior.
In summary, the market currently exhibits a layered structure in which high-beta assets remain highly capital-driven, while mainstream and utility-oriented tokens show declining correlation. Capital is more inclined to amplify volatility in high-elasticity assets, whereas certain mid-to-large-cap or functional projects display increasing independence. This suggests that although risk appetite has marginally improved, it remains concentrated in sentiment- and trading-driven sectors.
Figure 7: Highly correlated assets are concentrated in high-elasticity and sentiment-driven sectors, while some functional and mid-to-large-cap projects show lower correlation, reflecting a layered capital structure in the market.
In this market phase, the crypto market has maintained a defensive posture under macro pressure. Major assets weakened and capital rotated back to core chains, while market-cap structure showed clear divergence: the top 400 tokens saw modest pullbacks, whereas tail-end small caps rose against the trend as short-term capital rotated into high-elasticity assets. Mid- and small-cap tokens such as PENGUIN and RIVER posted strong gains driven by community momentum and event catalysts, while some previously popular high-beta assets retraced sharply, intensifying sentiment divergence. Volume–price resonance appeared only in a limited number of tokens, with most assets still stuck in low-volume, weak-price territory. Correlation analysis indicates that high-elasticity tokens remain the most sensitive to capital activity. Overall, the market remains in a macro-constrained, localized rotation phase, dominated by short-term trading rather than trend-driven recovery.
Beyond trading activity, several potential airdrop projects continue to advance across popular sectors including NFT marketplaces, browser-based bandwidth-sharing networks, and Web3 interactive platforms. By maintaining engagement and consistent participation, users may secure early positioning during a volatile market and improve their eligibility for future token incentives and airdrops. The following section highlights four noteworthy projects and participation methods to support a systematic approach to capturing Web3 opportunity flows.
Airdrop Highlights
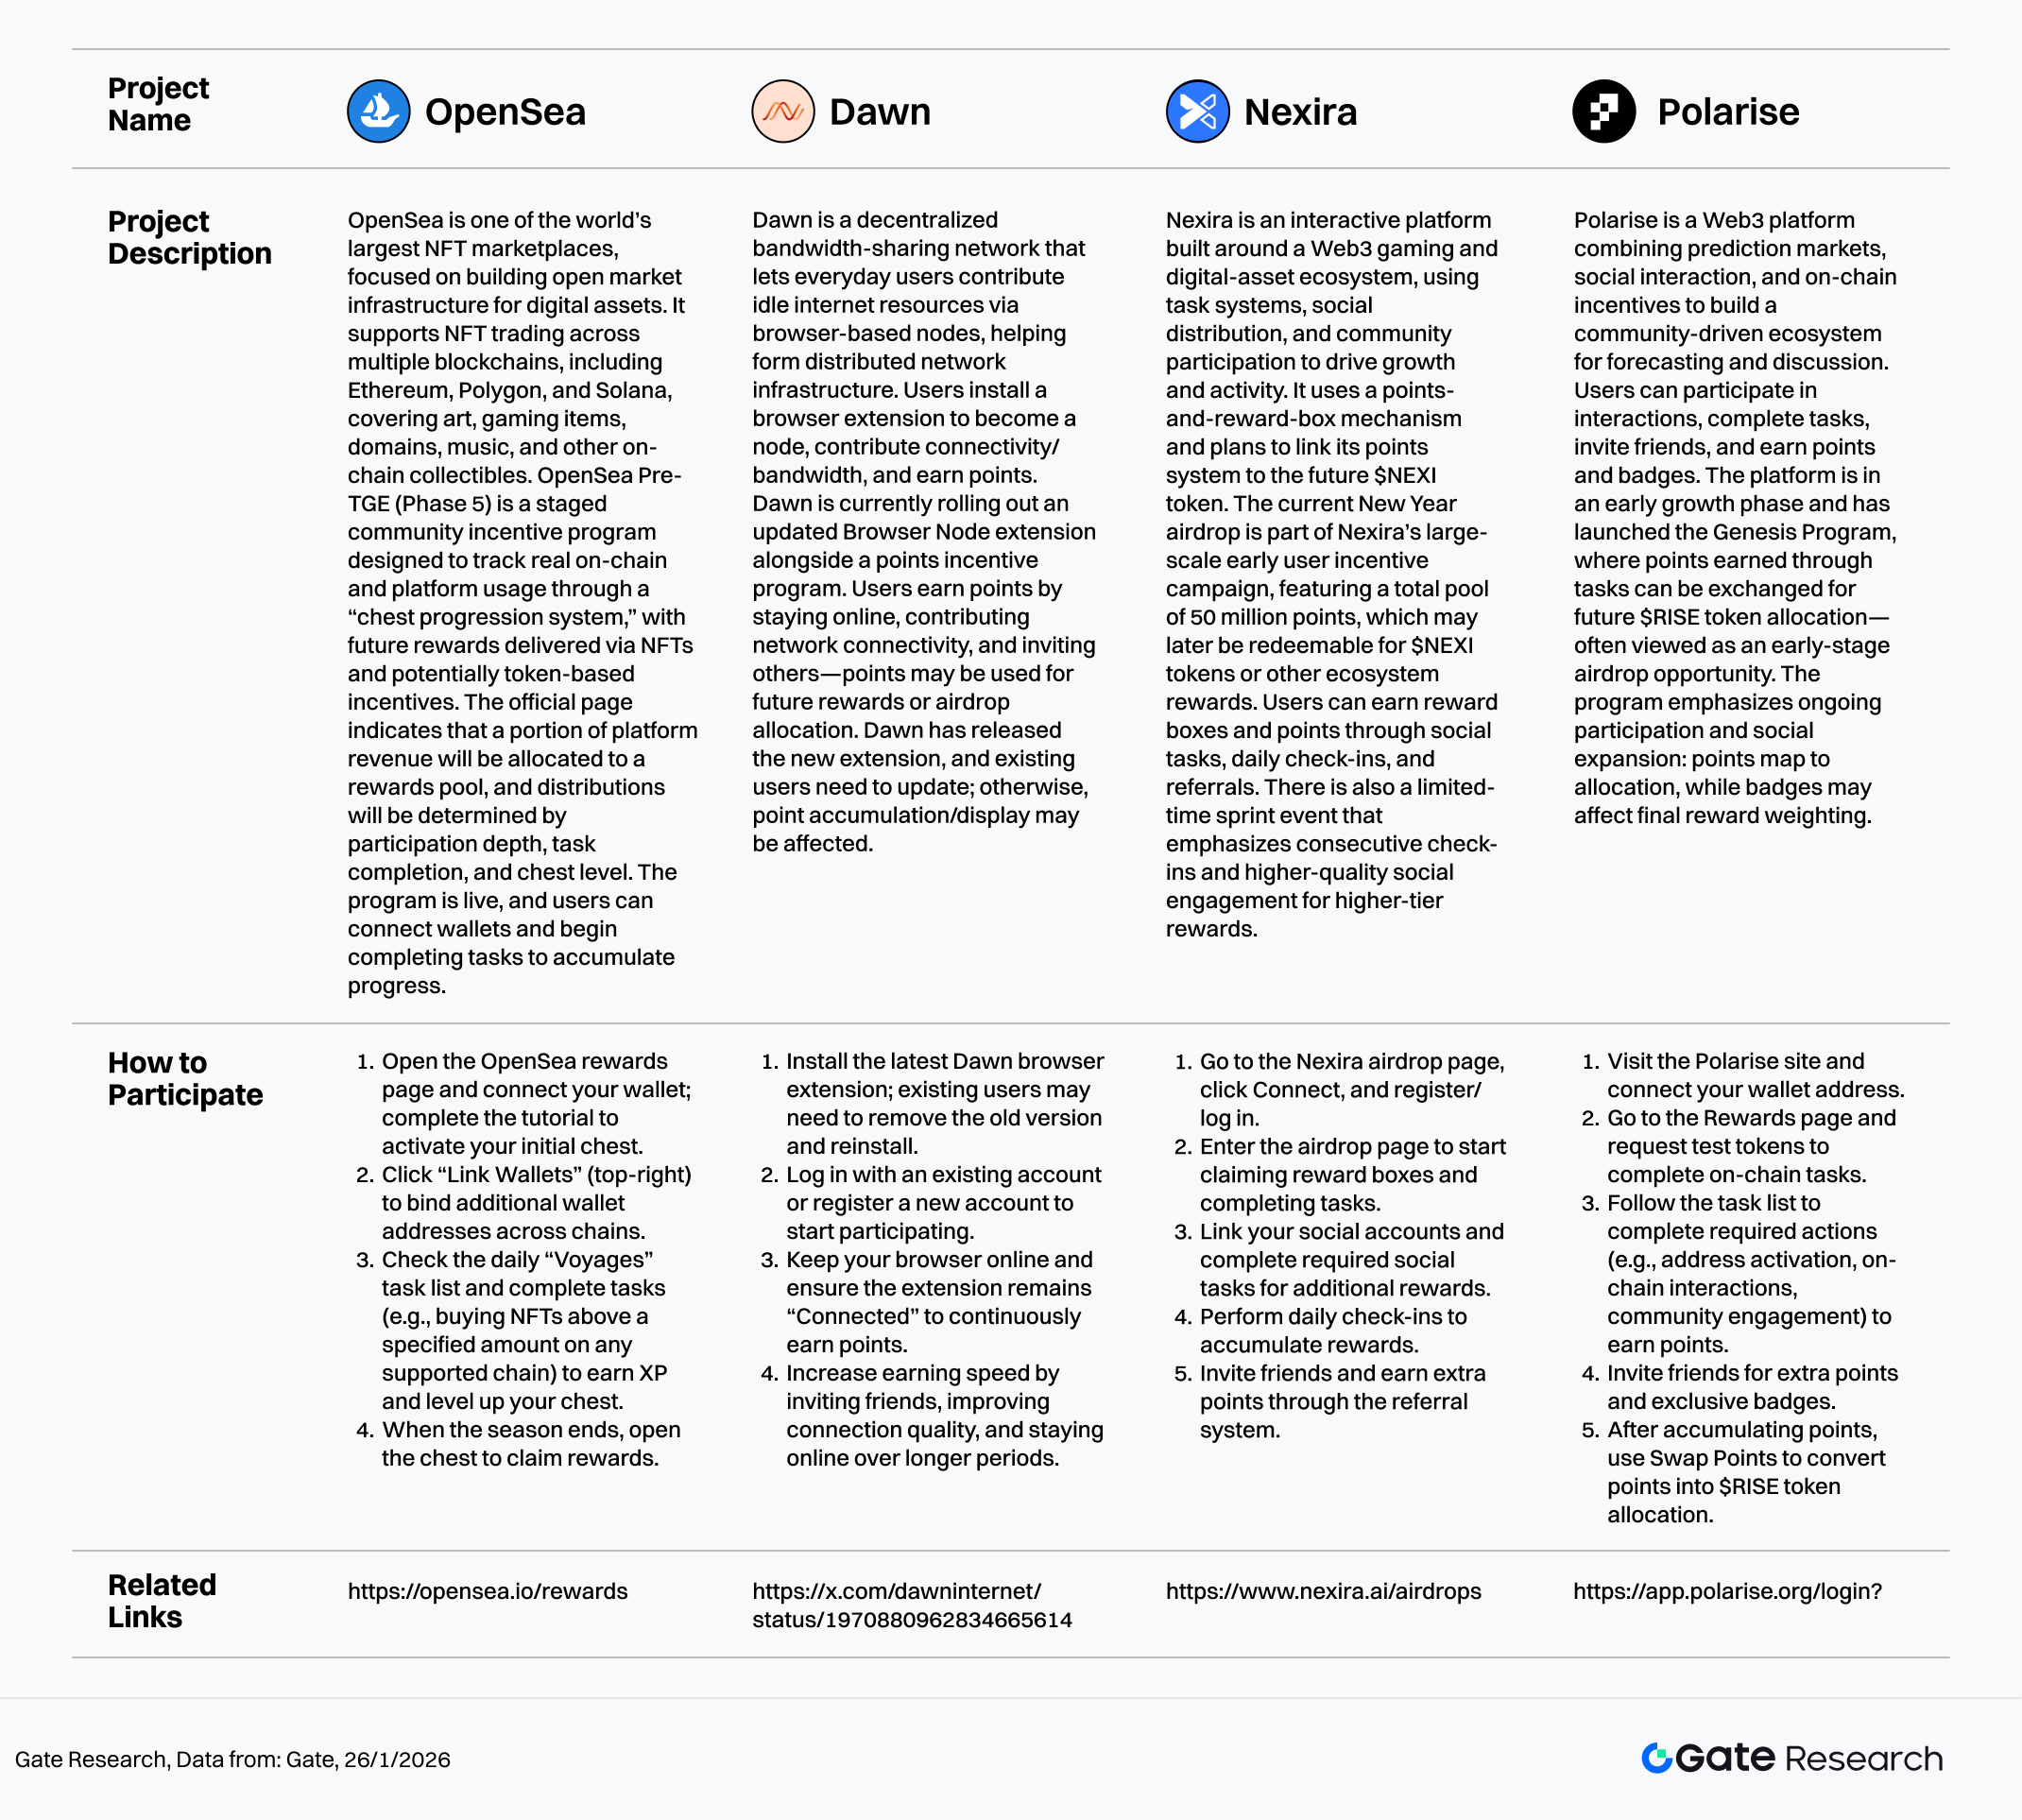
This report identifies several airdrop-potential projects worth monitoring between January 13 and January 26, 2026, including OpenSea (NFT marketplace), Dawn (browser node bandwidth-sharing network), Nexira (Web3 interactive platform), and Polarise (a points-based ecosystem combining prediction markets with social incentives). Users can accumulate points and contribution records by connecting wallets, keeping nodes online, completing on-chain and social tasks, inviting friends, and participating in daily check-ins, thereby increasing their weight and eligibility for potential future airdrop or token incentive allocations.
OpenSea
OpenSea is one of the world’s largest NFT marketplaces, focused on building open market infrastructure for digital assets. It supports NFT trading across multiple blockchains, including Ethereum, Polygon, and Solana, covering art, gaming items, domains, music, and other on-chain collectibles. OpenSea Pre-TGE (Phase 5) is a staged community incentive program designed to track real on-chain and platform usage through a “chest progression system,” with future rewards delivered via NFTs and potentially token-based incentives. The official page indicates that a portion of platform revenue will be allocated to a rewards pool, and distributions will be determined by participation depth, task completion, and chest level. The program is live, and users can connect wallets and begin completing tasks to accumulate progress.【2】
How to Participate:
- Open the OpenSea rewards page and connect your wallet; complete the tutorial to activate your initial chest.
- Click “Link Wallets” (top-right) to bind additional wallet addresses across chains.
- Check the daily “Voyages” task list and complete tasks (e.g., buying NFTs above a specified amount on any supported chain) to earn XP and level up your chest.
- When the season ends, open the chest to claim rewards.
Dawn
Dawn is a decentralized bandwidth-sharing network that lets everyday users contribute idle internet resources via browser-based nodes, helping form distributed network infrastructure. Users install a browser extension to become a node, contribute connectivity/bandwidth, and earn points. Dawn is currently rolling out an updated Browser Node extension alongside a points incentive program. Users earn points by staying online, contributing network connectivity, and inviting others—points may be used for future rewards or airdrop allocation. Dawn has released the new extension, and existing users need to update; otherwise, point accumulation/display may be affected.【3】
How to Participate:
- Install the latest Dawn browser extension; existing users may need to remove the old version and reinstall.
- Log in with an existing account or register a new account to start participating.
- Keep your browser online and ensure the extension remains “Connected” to continuously earn points.
- Increase earning speed by inviting friends, improving connection quality, and staying online over longer periods.
Nexira
Nexira is an interactive platform built around a Web3 gaming and digital-asset ecosystem, using task systems, social distribution, and community participation to drive growth and activity. It uses a points-and-reward-box mechanism and plans to link its points system to the future $NEXI token. The current New Year airdrop is part of Nexira’s large-scale early user incentive campaign, featuring a total pool of 50 million points, which may later be redeemable for $NEXI tokens or other ecosystem rewards. Users can earn reward boxes and points through social tasks, daily check-ins, and referrals. There is also a limited-time sprint event that emphasizes consecutive check-ins and higher-quality social engagement for higher-tier rewards.【4】
How to Participate:
- Go to the Nexira airdrop page, click Connect, and register/log in.
- Enter the airdrop page to start claiming reward boxes and completing tasks.
- Link your social accounts and complete required social tasks for additional rewards.
- Perform daily check-ins to accumulate rewards.
- Invite friends and earn extra points through the referral system.
Polarise
Polarise is a Web3 platform combining prediction markets, social interaction, and on-chain incentives to build a community-driven ecosystem for forecasting and discussion. Users can participate in interactions, complete tasks, invite friends, and earn points and badges. The platform is in an early growth phase and has launched the Genesis Program, where points earned through tasks can be exchanged for future $RISE token allocation—often viewed as an early-stage airdrop opportunity. The program emphasizes ongoing participation and social expansion: points map to allocation, while badges may affect final reward weighting.【5】
How to Participate:
- Visit the Polarise site and connect your wallet address.
- Go to the Rewards page and request test tokens to complete on-chain tasks.
- Follow the task list to complete required actions (e.g., address activation, on-chain interactions, community engagement) to earn points.
- Invite friends for extra points and exclusive badges.
- After accumulating points, use Swap Points to convert points into $RISE token allocation.
Reminder
Airdrop plans and participation methods are subject to change at any time. Therefore, it is recommended that users follow the official channels of the above projects for the latest updates. Additionally, users should exercise caution, be aware of the risks, and conduct thorough research before participating. Gate does not guarantee the distribution of subsequent airdrop rewards.
Conclusion
Looking back at the period from January 13 to January 26, 2026, the crypto market remained under pressure amid rising geopolitical and tariff-related uncertainty. Major assets weakened, capital rotated back to core chains, and overall price action reflected a defensive, range-bound structure. BTC failed to sustain its rebound and turned weaker, while ETH underperformed further. On-chain flows showed net inflows into Ethereum, while capital exited high-leverage, high-activity networks, signaling a cooling in risk appetite.
Market-cap structure displayed clear stratification: the top 400 tokens recorded modest pullbacks, while the 401–500 small-cap segment rose against the trend, as short-term capital shifted toward high-elasticity assets. On the individual token level, PENGUIN, RIVER, AXS, and SKR posted strong gains driven by community momentum and event catalysts, while some previously popular high-beta themes saw sharp retracements, reflecting rapid sentiment rotation. Within the Top 100, RIVER led gains on the back of financing and partnership developments, while on-chain gold assets such as PAXG and XAUT also advanced, highlighting rising safe-haven demand.
Volume–price dynamics indicate that recovery remains uneven. Tokens such as KAIA, ZRO, and ROSE exhibited volume–price resonance, but most assets remain in a low-volume, weak-price zone. Correlation patterns further show that high-elasticity assets are the most sensitive to changes in capital activity, while some functional tokens are beginning to display more independent price behavior. Overall, the market is in a phase characterized by “large-cap defense, small-cap rotation, and volume–price divergence.” Short-term trading dominates, and a broad trend recovery has yet to fully develop, though structural opportunities persist.
In addition, key projects tracked this period — OpenSea, Dawn, Nexira, and Polarise — remain in active incentive phases, covering NFT platform engagement rewards, decentralized bandwidth nodes, social referral–based points systems, and prediction-market-driven community ecosystems. These projects have complementary positioning and clear participation pathways. Users can continue accumulating points, badges, or loot-box levels through on-chain interactions, social linking, referrals, and check-ins, thereby increasing their potential allocation weight for future airdrops or token incentives. Ongoing monitoring of campaign updates and maintaining both early and sustained participation records is recommended.
Reference:
- CoinGecko, https://www.coingecko.com/
- OpenSea, https://opensea.io/rewards
- X, https://x.com/dawninternet/status/1970880962834665614
- Nexira, https://www.nexira.ai/airdrops
- Polarise, https://app.polarise.org/login?
Gate Research is a comprehensive blockchain and cryptocurrency research platform that provides deep content for readers, including technical analysis, market insights, industry research, trend forecasting, and macroeconomic policy analysis.
Disclaimer
Investing in cryptocurrency markets involves high risk. Users are advised to conduct their own research and fully understand the nature of the assets and products before making any investment decisions. Gate is not responsible for any losses or damages arising from such decisions.