Solana Collapse Warning: Could SOL Fall to $120 Amid Bearish Patterns and Capital Outflows?
Background and Current Price Overview

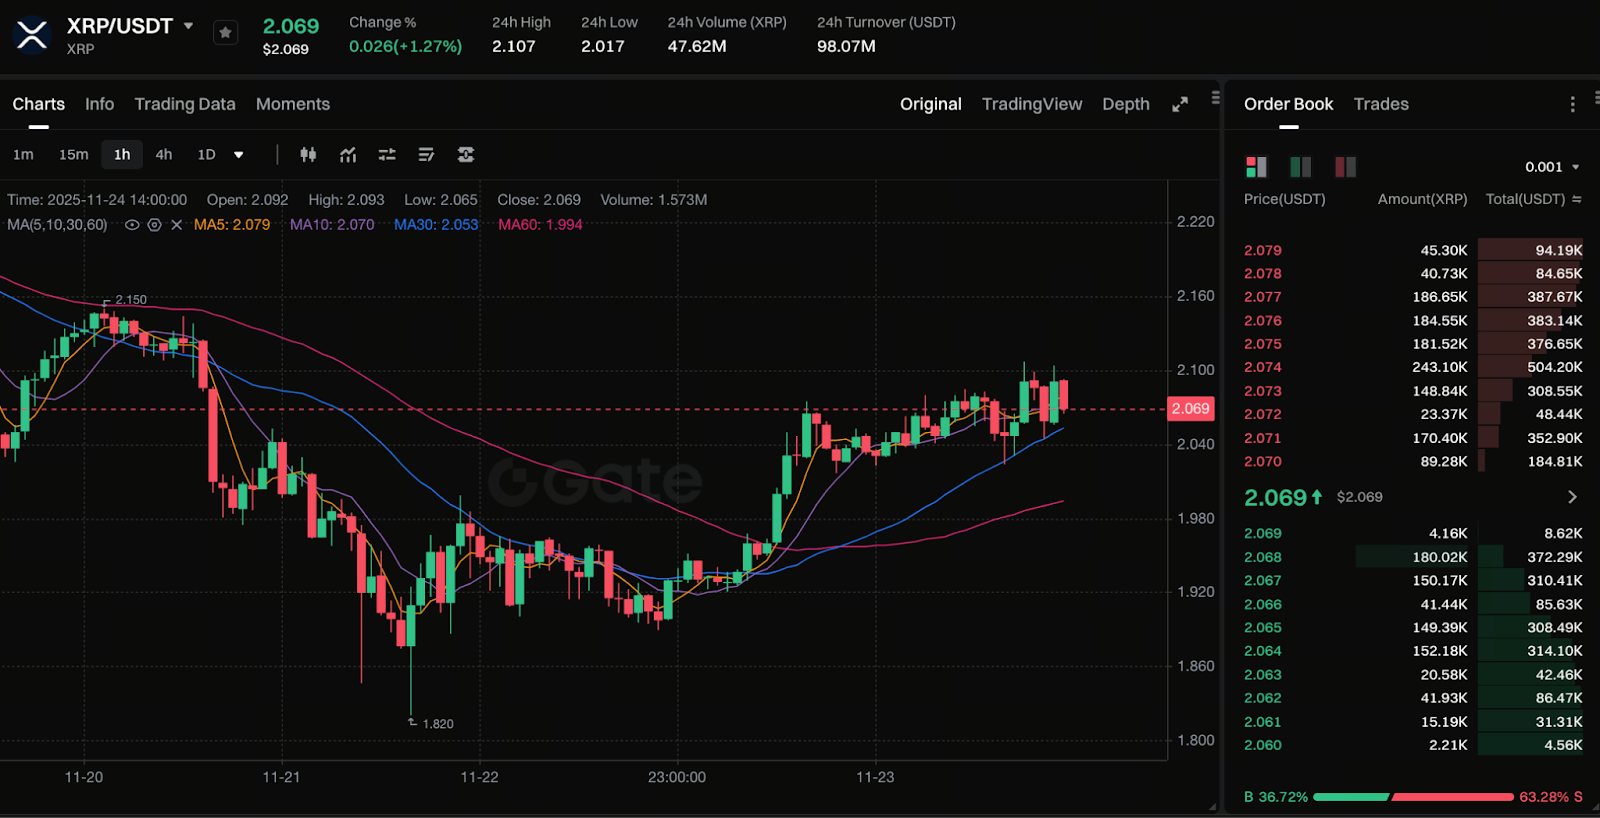
Chart: https://www.gate.com/trade/XRP_USDT
Solana (SOL), a leading Layer-1 blockchain, has seen steady ecosystem growth in recent years. However, the market has turned highly volatile. Recent analysis shows SOL prices under sustained pressure, retreating steadily from last year’s highs. A pronounced rounded top has formed on SOL’s daily chart—a technical formation that often signals a deeper downturn ahead. More concerningly, key on-chain metrics for Solana have deteriorated, which has severely undermined bullish sentiment.
Rounded Top Pattern and Technical Analysis
Technically, SOL’s rounded top pattern is distinct: the price consolidated for an extended period and gradually declined, forming a rounded formation. Simultaneously, analysts highlight that the 50-day Simple Moving Average (SMA) is on the verge of crossing below the 200-day SMA, commonly referred to as a “death cross.” This combination signals weakening buying momentum. If key support fails, selling pressure could accelerate rapidly.
On-Chain Capital Outflow Signals
On-chain data shows that capital is exiting the Solana ecosystem. Specifically, Total Value Locked (TVL) in Solana’s DeFi protocols has dropped steeply from September highs. The stablecoin supply on the network is also falling. Compared to year-to-date peaks, total stablecoin supply has decreased by nearly 20%. This means that not only are funds leaving DeFi protocols, but even stablecoin liquidity—traditionally considered more stable—is also being withdrawn, which is an alarming sign for Solana’s ecosystem health.
ETF Launch Has Not Eased Downward Pressure
Despite expectations that spot Solana ETFs from US asset managers would draw significant inflows, results have fallen short. Analysis reveals these ETFs have not provided immediate support for SOL. Inflows via ETFs have not made up for the outflows from Solana’s ecosystem. Coupled with weakening technicals, this makes SOL increasingly susceptible to further declines.
Worst-Case Scenario: Falling to $120 or Lower
iX Broker and other sources warn that if support breaks, SOL could retrace to $120. If $120 does not hold, SOL could next test $95. Such a decline would not be a minor correction but would signal the full release of structural risk.
Investor Response Strategies
- Short-term traders: Closely track the $120 support level. If the price nears this zone with rising volume, set stop-losses proactively or consider taking profits.
- Medium- to long-term investors: If you believe in Solana’s long-term value, consider averaging in rather than going all-in at once. Maintain a cash or stablecoin reserve to hedge against technical risk.
- Track on-chain data: Prioritize indicators like TVL and stablecoin supply. Also, monitor the rate of ETF inflows as key references for future entry or position increases.
- Risk management: Amid high volatility, strictly manage position sizing and be prepared mentally and financially for potential downside.
Related Articles

Pi Coin Transaction Guide: How to Transfer to Gate.io

Flare Crypto Explained: What Is Flare Network and Why It Matters in 2025

How to Use a Crypto Whale Tracker: Top Tool Recommendation for 2025 to Follow Whale Moves

2025 BTC Price Prediction: BTC Trend Forecast Based on Technical and Macroeconomic Data

What is N2: An AI-Driven Layer 2 Solution
