Trade
Trading Type
Spot
Trade crypto freely
Alpha
Points
Get promising tokens in streamlined on-chain trading
Pre-Market
Trade new tokens before they are officially listed
Margin
Magnify your profit with leverage
Convert & Block Trading
0 Fees
Trade any size with no fees and no slippage
Leveraged Tokens
Get exposure to leveraged positions simply
Futures
Futures
Hundreds of contracts settled in USDT or BTC
Options
HOT
Trade European-style vanilla options
Unified Account
Maximize your capital efficiency
Demo Trading
Futures Kickoff
Get prepared for your futures trading
Futures Events
Participate in events to win generous rewards
Demo Trading
Use virtual funds to experience risk-free trading
Earn
Launch
CandyDrop
Collect candies to earn airdrops
Launchpool
Quick staking, earn potential new tokens
HODLer Airdrop
Hold GT and get massive airdrops for free
Launchpad
Be early to the next big token project
Alpha Points
NEW
Trade on-chain assets and enjoy airdrop rewards!
Futures Points
NEW
Earn futures points and claim airdrop rewards
Investment
Simple Earn
Earn interests with idle tokens
Auto-Invest
Auto-invest on a regular basis
Dual Investment
Buy low and sell high to take profits from price fluctuations
Soft Staking
Earn rewards with flexible staking
Crypto Loan
0 Fees
Pledge one crypto to borrow another
Lending Center
One-Stop Lending Hub
VIP Wealth Hub
Customized wealth management empowers your assets growth
Private Wealth Management
Customized asset management to grow your digital assets
Quant Fund
Top asset management team helps you profit without hassle
Staking
Stake cryptos to earn in PoS products
BTC Staking
HOT
Stake BTC and earn 10% APR
GUSD Minting
Use USDT/USDC to mint GUSD for treasury-level yields
More


- Trending TopicsView More
234.11K Popularity
30.52K Popularity
5.17K Popularity
5.09K Popularity
4.6K Popularity
- Hot Gate FunView More
- MC:$0.1Holders:10.00%
- MC:$3.57KHolders:10.29%
- MC:$3.52KHolders:10.00%
- MC:$3.58KHolders:10.31%
- MC:$3.48KHolders:10.00%
- Pin
November 26 | ETH Trend Analysis
Core Insights
Current Price: $2,951.89 (as of November 26, 09:25)
Short-term outlook: The short-term bias is bullish, with technical indicators showing an upward trend on the 1-hour and 4-hour charts. The RSI is in a neutral to bullish zone, and the MACD maintains a bullish signal. Although the daily chart is still in a downward trend, the oversold state of the RSI provides support for a rebound. The probability of testing the $3,000-$3,050 area upwards in the next 24-48 hours is 60%.
Key Support:
Key Resistance:
Technical Analysis
multi-timeframe structure
The current price is above the short-term moving average but below the daily moving average, showing a pattern of divergence between bulls and bears. The 1-hour and 4-hour charts indicate healthy upward momentum, with RSI values of 57.6 and 58.5 respectively, and the MACD histogram is positive. The daily chart shows an RSI of 37.5, which is in the oversold area, providing a technical basis for a potential rebound.
Key Price Level Analysis
The technical analysis shows that a breakout above $2,987 (the upper Bollinger Band on the 4-hour chart) will open up upward space towards $3,132; if it falls below the support at $2,919, there is a risk of probing down to the $2,867 liquidation zone.
On-chain Data Analysis
Whale Activity
There has been significant whale activity in the past 24-48 hours, with the top 10 transactions involving approximately 240,000 ETH (worth about $709 million). This includes a large transfer of 60,000 ETH and multiple chain transfers of over 30,000 ETH, indicating active reallocation of funds by large holders.
exchange capital flow
ETF capital inflow
The spot ETH ETF recorded a net inflow of $96.67 million on November 24, led by BlackRock's ETHA (+$92.61 million), reversing the previous trend of capital outflow and indicating a recovery in institutional confidence.
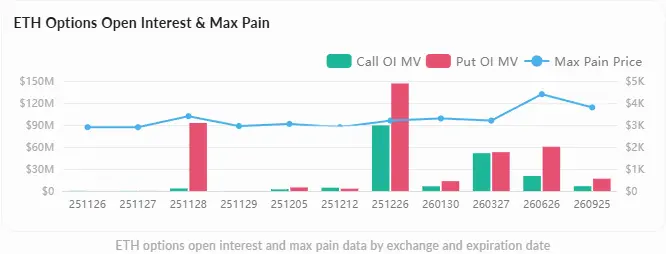
Derivative Data
The total position amount is $35.1 billion (a 24-hour decrease of 1.33%), and the funding rate is neutral to slightly bullish. The maximum pain point for options is around $2900, indicating that short-term prices may be influenced by this level.
The liquidation risk chart shows that there is a cumulative long liquidation risk of $498 million below $2854, while there is a short liquidation pressure of $547 million above $3053, presenting an asymmetric downside waterfall risk.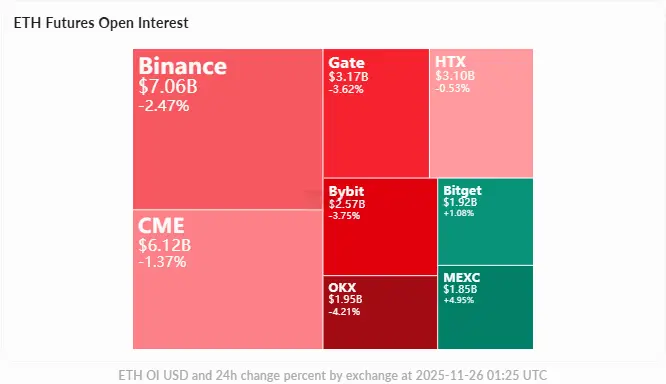

Market Sentiment
Social media sentiment is cautiously optimistic, with key opinion leaders highlighting bullish factors such as the decline in ETH supply and inflows of stablecoins. Technical analysts are generally focused on whether the current support level can hold effectively; if it does, a rebound above $3000 is anticipated. Some analysts maintain the judgment that ETH will perform better relative to BTC in the next round of upward movement.
Trading Suggestions
Bullish Scenario (Probability 60%):
Key Points:
Risk Warning
Although the short-term technical outlook is bullish, the daily level is still in a downward trend and is approaching a densely packed area for long liquidation. It is necessary to closely monitor changes in the macro environment and the trend of Bitcoin's dominance, as the latter has historically affected ETH's relative performance.