Trade
Basic
Futures
Futures
Hundreds of contracts settled in USDT or BTC
Options
HOT
Trade European-style vanilla options
Unified Account
Maximize your capital efficiency
Demo Trading
Futures Kickoff
Get prepared for your futures trading
Futures Events
Participate in events to win generous rewards
Demo Trading
Use virtual funds to experience risk-free trading
Earn
Launch
CandyDrop
Collect candies to earn airdrops
Launchpool
Quick staking, earn potential new tokens
HODLer Airdrop
Hold GT and get massive airdrops for free
Launchpad
Be early to the next big token project
Alpha Points
NEW
Trade on-chain assets and enjoy airdrop rewards!
Futures Points
NEW
Earn futures points and claim airdrop rewards
Investment
Simple Earn
Earn interests with idle tokens
Auto-Invest
Auto-invest on a regular basis
Dual Investment
Buy low and sell high to take profits from price fluctuations
Soft Staking
Earn rewards with flexible staking
Crypto Loan
0 Fees
Pledge one crypto to borrow another
Lending Center
One-stop lending hub
VIP Wealth Hub
Customized wealth management empowers your assets growth
Private Wealth Management
Customized asset management to grow your digital assets
Quant Fund
Top asset management team helps you profit without hassle
Staking
Stake cryptos to earn in PoS products
Smart Leverage
NEW
No forced liquidation before maturity, worry-free leveraged gains
GUSD Minting
Use USDT/USDC to mint GUSD for treasury-level yields
More
Trending Topics
View More27.87K Popularity
34.84K Popularity
20.73K Popularity
3.99K Popularity
2.53K Popularity
Pin
January 07 | BTC Trend Analysis
Core Viewpoints
Current Price: $92,554 (as of January 7, 10:13)
Short-term Outlook: Neutral leaning cautious. The daily chart maintains a strong upward trend, but the 1-hour and 4-hour charts show short-term correction pressures. Coupled with significant long liquidation and decreasing open interest, it is expected to fluctuate between $91,700 and $93,300 today. If it loses $92,500, a retest of $91,700 support is possible; a break above $93,300 could challenge the $94,000 level.
Key Support Levels: $91,724 (1-hour Bollinger lower band), $90,326 (4-hour Bollinger lower band), $89,415 (large liquidation cluster zone)
Key Resistance Levels: $93,072 (1-hour Bollinger upper middle band), $93,364 (daily Bollinger upper band), $94,400 (recent local high)
Technical Analysis
Multi-timeframe Structure
1-Hour Level: RSI(14) at 44.46, neutral to slightly bearish; MACD shows a death cross (histogram -49.40), price below 12/26/50 moving averages, currently trading above the Bollinger lower band at $91,724. Short-term structure is weak, with further correction risks.
4-Hour Level: RSI(14) rebounded to 53.28, in neutral zone; MACD still above signal line but histogram turned negative at -159.36, indicating weakening bullish momentum; price remains above 26/50 MAs but below 12 MA, near the Bollinger middle band at $92,614. Overall, a consolidation pattern with bullish dominance but caution for short-term pullback.
Daily Level: RSI(14) at 59.42, leaning bullish; MACD shows a clear golden cross (histogram +795.99), price above all major MAs and approaching the Bollinger upper band at $93,364. The main trend remains strong and bullish, providing support for short-term fluctuations.
Derivatives Market Signals
Futures Open Interest: Total open interest at $59.8B, down 2.84% in 24 hours, indicating market caution. Funding rates on major exchanges remain positive (Binance +0.0097%, Bybit +0.01%), longs paying shorts, showing mild bullish bias but caution against over-crowding.
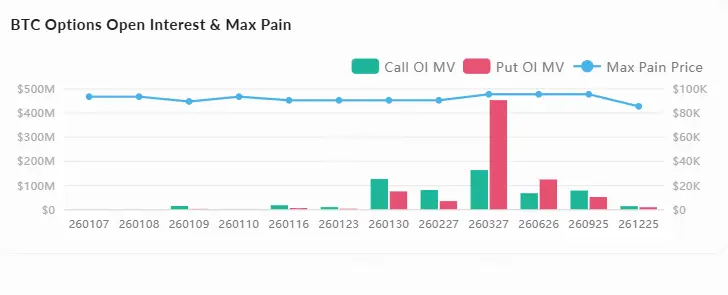
Options Market: Total open interest at $32.3B, up 2.8% in 24 hours; maximum pain points for short-term expiry contracts are concentrated between $89,000 and $95,000, with $93,000 being a key battleground near current price.
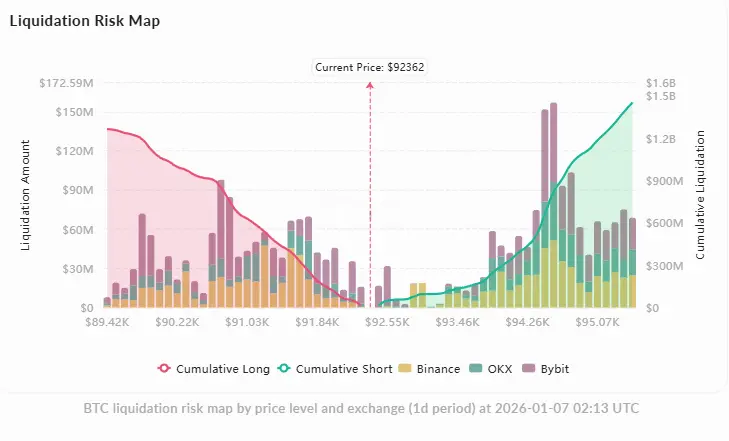
Liquidation Distribution: Total liquidation in 24 hours is $144M, with longs at $112M far exceeding shorts at $32M, reflecting leveraged long pressure. Heatmap shows $15.9M long liquidation around $92,344, and $16.6M short liquidation near $92,445. High-risk zones are between $92,000 and $92,500. Below, at $89,415, there is a cluster of $1.26B long liquidation walls; above, at $95,475, a $1.45B short liquidation wall.
On-chain Dynamics
Exchange Flows: Net outflows over the past 7 days, with a single-day outflow of 5,638 BTC on Jan 5, and slight inflow of 114 BTC on Jan 6. Net withdrawal often indicates long-term holding, providing bottom support.
Exchange Reserves: Reserves decreased from 2.76 million BTC to 2.745 million BTC over the past 30 days (worth $257B), with reduced selling pressure supporting price structure.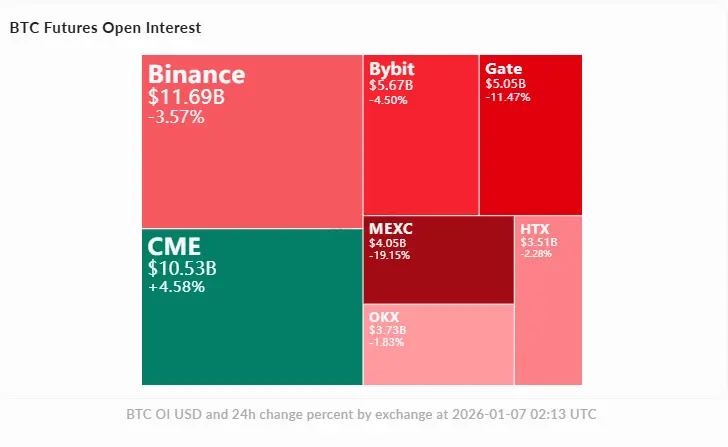
Market Sentiment and Narrative
Community Focus:
Key Opinion Leaders:
Mainstream Narrative: Policy dividends (Trump-era BTC reserve policies, index inclusion) offset previous FUD; technical focus on liquidity battles, cautious high points, but overall bullish after consolidation; altcoin rotation and strong BTC momentum resonate, with declining dominance and ETF approvals driving capital inflows.
News and Market Dynamics
Price Action: BTC peaked at $94,600 in early January, then consolidated above $90,000. Market cap increased by $300B in the first week, supported by ETF inflows and reduced tax selling. Current price at $92,516 is about 2% below the high, with a 24-hour decline of 1.27%, and volume remains active at $54-60B.
Regulatory Developments: The CLARITY Act (crypto market structure legislation) may be delayed until 2027 due to US midterm elections, but market remains optimistic about long-term compliance frameworks.
Technical Events: Bitcoin Core v30.0/30.1 issued warnings over wallet migration bugs affecting pruning mode users; versions have been withdrawn pending v30.2 patch. Limited impact on price.
Analyst Expectations: Mainstream forecasts target a breakout to $100,000 this month, with some predicting a new high possibly exceeding $124,000. Liquidity concerns flagged as risk factors, caution advised for rapid volatility.
Trading Strategy References
Long (Aggressive traders):
Short (Defensive traders):
Risk Warning: Currently in a high-volatility zone, with dense liquidations between $92,000 and $92,500. Control position size, avoid high leverage. If price breaks and holds above $93,300, can chase $94,400-$96,000; if it falls below $91,700, prepare for deeper correction to $90,300 or even $89,400.