Trade
Trading Type
Spot
Trade crypto freely
Pre-Market
Trade new tokens before they are officially listed
Margin
Magnify your profit with leverage
Convert & Block Trading
0 Fees
Trade any size with no fees and no slippage
Alpha
Points
Get promising tokens in streamlined on-chain trading
Leveraged Tokens
Get exposure to leveraged positions simply
Futures
Futures
Hundreds of contracts settled in USDT or BTC
Options
HOT
Trade European-style vanilla options
Unified Account
Maximize your capital efficiency
Demo Trading
Futures Kickoff
Get prepared for your futures trading
Futures Events
Participate in events to win generous rewards
Demo Trading
Use virtual funds to experience risk-free trading
Earn
Launch
CandyDrop
Collect candies to earn airdrops
Launchpool
Quick staking, earn potential new tokens
HODLer Airdrop
Hold GT and get massive airdrops for free
Launchpad
Be early to the next big token project
Alpha Points
NEW
Trade on-chain assets and enjoy airdrop rewards!
Futures Points
NEW
Earn futures points and claim airdrop rewards
Investment
Simple Earn
Earn interests with idle tokens
Auto-Invest
Auto-invest on a regular basis
Dual Investment
Buy low and sell high to take profits from price fluctuations
Soft Staking
Earn rewards with flexible staking
Crypto Loan
0 Fees
Pledge one crypto to borrow another
Lending Center
One-stop lending hub
VIP Wealth Hub
Customized wealth management empowers your assets growth
Private Wealth Management
Customized asset management to grow your digital assets
Quant Fund
Top asset management team helps you profit without hassle
Staking
Stake cryptos to earn in PoS products
BTC Staking
HOT
Stake BTC and earn 10% APR
GUSD Minting
Use USDT/USDC to mint GUSD for treasury-level yields
More
Promotions
Activity Center
Join activities and win big cash prizes and exclusive merch
Referral
20 USDT
Earn 40% commission or up to 500 USDT rewards
Announcements
Announcements of new listings, activities, upgrades, etc
Gate Blog
Crypto industry articles
VIP Services
Huge fee discounts
Proof of Reserves
Gate promises 100% proof of reserves

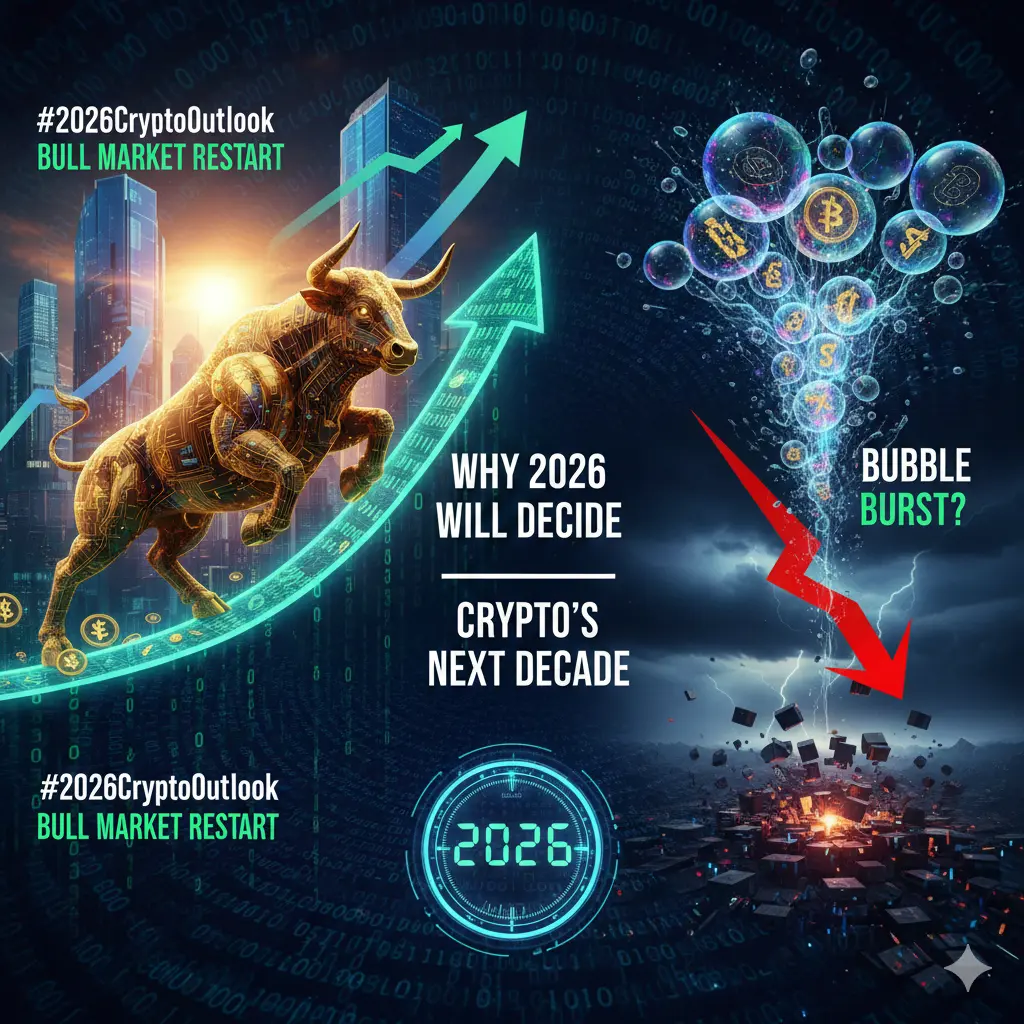
#2026CryptoOutlook Bull Market Restart or Bubble Burst? Why 2026 Will Decide Crypto’s Next Decade
As the market digests the sharp volatility following Bitcoin’s October 2025 peak near $126,000, crypto has entered a decisive transition phase. The subsequent correction toward the high-$80,000 range—roughly a 30% drawdown—has cooled speculative excess while exposing deeper questions about liquidity, narrative sustainability, and macro alignment. Declining trading volumes and softer on-chain activity suggest that the market is no longer driven by momentum alone, but by expectation management ahead
As the market digests the sharp volatility following Bitcoin’s October 2025 peak near $126,000, crypto has entered a decisive transition phase. The subsequent correction toward the high-$80,000 range—roughly a 30% drawdown—has cooled speculative excess while exposing deeper questions about liquidity, narrative sustainability, and macro alignment. Declining trading volumes and softer on-chain activity suggest that the market is no longer driven by momentum alone, but by expectation management ahead
BTC2,03%
- Reward
- 8
- 4
- Repost
- Share
AnnaCryptoWriter :
:
Hold tight 💪View More
Work is a journey to make a living, life is a harbor to return to. GM believes that life should have the gentle sunlight shining on the beach, and also the warmth of family companionship. This is our true pursuit of value. Together with GM, create wealth in Web3 and enjoy the beauty of life~💛
View Original

MC:$1MHolders:68823
100.00%
- Reward
- 9
- 6
- Repost
- Share
寂静gm:
Long Yi GMView More
$BTC
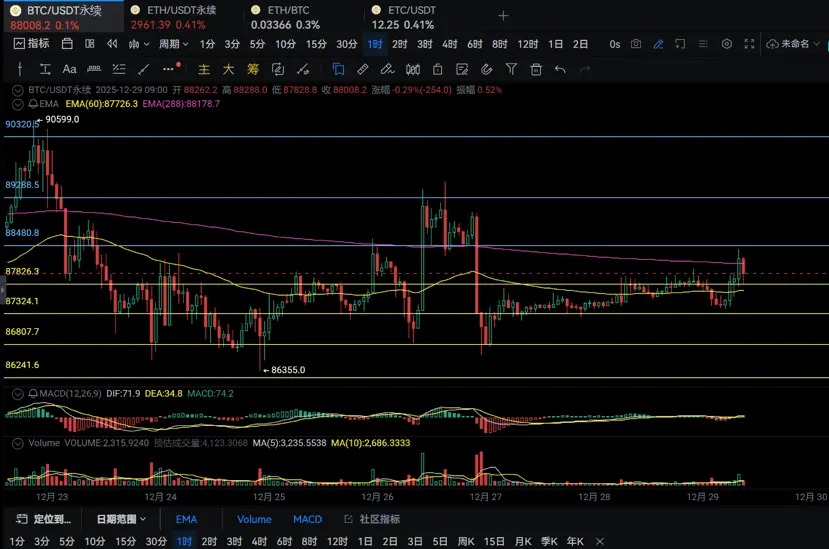
BTC weekly chart on 12.29 to prevent opening high and closing low, 3-day moving average bottom MACD continues to show green bars
Effective timeframes of 2-day and 1-day moving averages, 12-hour and 8-hour bottoming out
Risks exist with 3-hour, 4-hour, and 6-hour counter-rallies, 2-hour crossing above, 15-minute hidden water level
Resistance above: 88480, 89288, 90320
Support below: 87826, 87324, 86807, 86241
BTC long-short ratio: 2.20 Fear Index: 30
No action without pattern confirmation, no orders without stop-loss
(The above content is for reference only and does not cons
BTC2,03%
- Reward
- like
- Comment
- Repost
- Share
🌈 Gate Live Live Inspiration - December 29
Trending Topics Recommendations:
🔹 The leading altcoin during the sideways market has emerged! Why is GMT surging against the market trend?
🔹 BTC's final sprint! Bitcoin still needs to rise about 6% to complete the annual closing increase
🔹 A major whale has recently sold a total of 50,623 ETH, worth $147.88 million
🔹 10x Research issues a warning: BTC and ETH are brewing undercurrents, trend reversal approaching!
🔹 This week, HYPE, ZORA, SUI, and others will experience a large token unlock, market faces selling pressure test
🔹 Institutional ex
View OriginalTrending Topics Recommendations:
🔹 The leading altcoin during the sideways market has emerged! Why is GMT surging against the market trend?
🔹 BTC's final sprint! Bitcoin still needs to rise about 6% to complete the annual closing increase
🔹 A major whale has recently sold a total of 50,623 ETH, worth $147.88 million
🔹 10x Research issues a warning: BTC and ETH are brewing undercurrents, trend reversal approaching!
🔹 This week, HYPE, ZORA, SUI, and others will experience a large token unlock, market faces selling pressure test
🔹 Institutional ex

- Reward
- 4
- 1
- Repost
- Share
WinTheWorldWithWisdo :
:
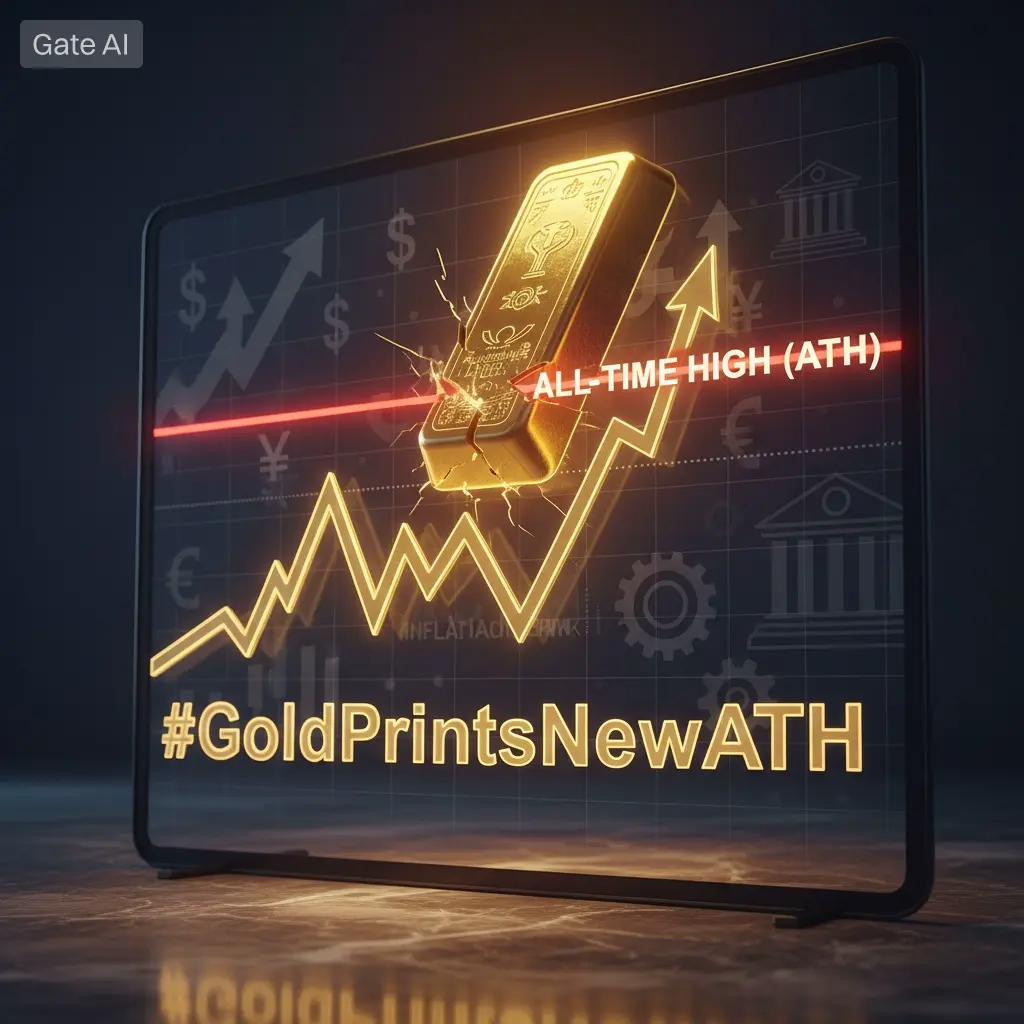
Experienced driver, guide me 📈#GoldPrintsNewATH — A Historic Moment for Global Markets 🏆
Gold has once again proven why it is called the ultimate safe-haven asset. With GoldPrintsNewATH, the yellow metal has surged to a new all-time high (ATH), marking a defining moment for investors, traders, and the global financial system. This milestone is not just about price appreciation it reflects deeper economic realities shaping the world today.
Why Is Gold Hitting a New All-Time High?
Several powerful factors are driving gold’s historic rally:
1. Global Economic Uncertainty
From slowing economic growth to rising geopolitical te
BTC2,03%
- Reward
- 14
- 15
- Repost
- Share
CryptoCrystal:
👌🏻👌🏻👌🏻View More
$GRIN Invisible in Plain Sight: Grin, Reshaping the Future of Privacy Transactions
In the world of cryptocurrency, the term "privacy" is often mentioned, yet few projects can achieve purity and extremity in this regard. Until the emergence of Grin. This is not just an anonymous token but a fundamental rethinking and technological revolution in blockchain privacy.
Have you ever been concerned?
Every transfer is like publicly recording on a transparent ledger; each transaction can be tracked and analyzed, exposing your financial footprint. Traditional blockchains, in pursuit of decentralization,
GRIN0,33%
- Reward
- 17
- 26
- Repost
- Share
repanzal:
1000x VIbes 🤑View More
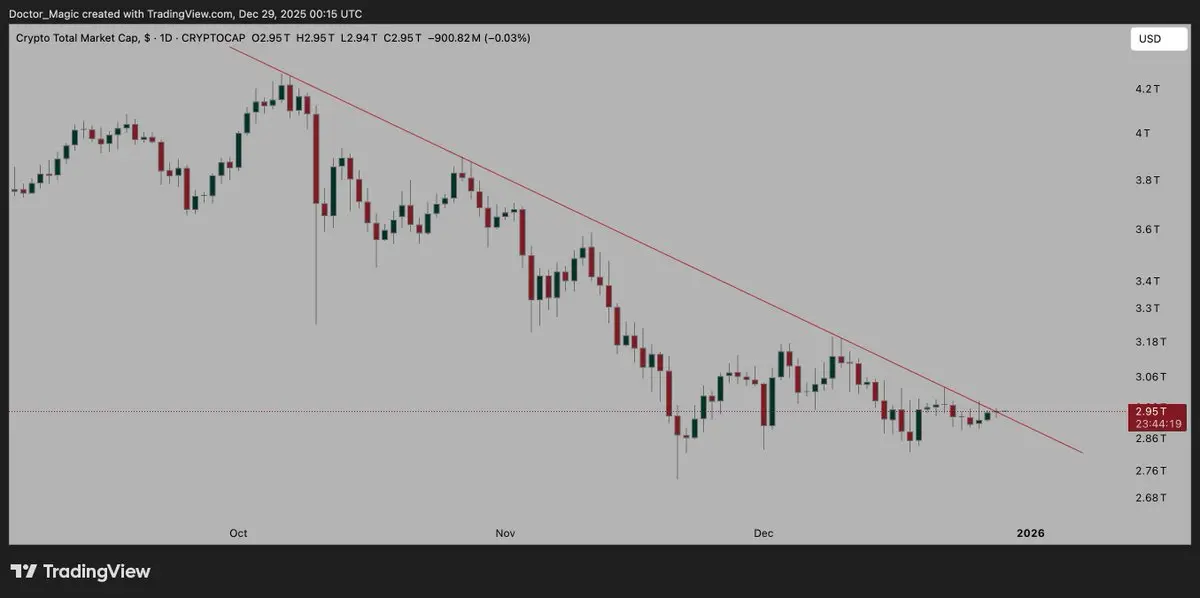
Total opens up above the downtrend
Great sign for the 2026 bear market
Great sign for the 2026 bear market
- Reward
- like
- Comment
- Repost
- Share
Top 10 Reasons Why $GM Can Become a Global Mainstream MEME:
1. GM is the abbreviation for Good Morning. It is the universal language for crypto investors worldwide, promoted daily by major platforms and KOLs.
2. As the most active MEME on the GateLayer chain, GM fulfills the mission of implementing the Gate Web3 strategy. GT (Gate Token) carries the strategic role for Gate Exchange, while GGM (Gate Meme) embodies the Gate Web3 strategy.
3. GM has the best liquidity, large liquidity pools, and whales are willing to add LP for maximum returns.
4. GM boasts a mature and comprehensive CTO communi
View Original1. GM is the abbreviation for Good Morning. It is the universal language for crypto investors worldwide, promoted daily by major platforms and KOLs.
2. As the most active MEME on the GateLayer chain, GM fulfills the mission of implementing the Gate Web3 strategy. GT (Gate Token) carries the strategic role for Gate Exchange, while GGM (Gate Meme) embodies the Gate Web3 strategy.
3. GM has the best liquidity, large liquidity pools, and whales are willing to add LP for maximum returns.
4. GM boasts a mature and comprehensive CTO communi

MC:$1MHolders:68823
100.00%
- Reward
- 16
- 4
- Repost
- Share
GM222:
Hop on board!🚗View More
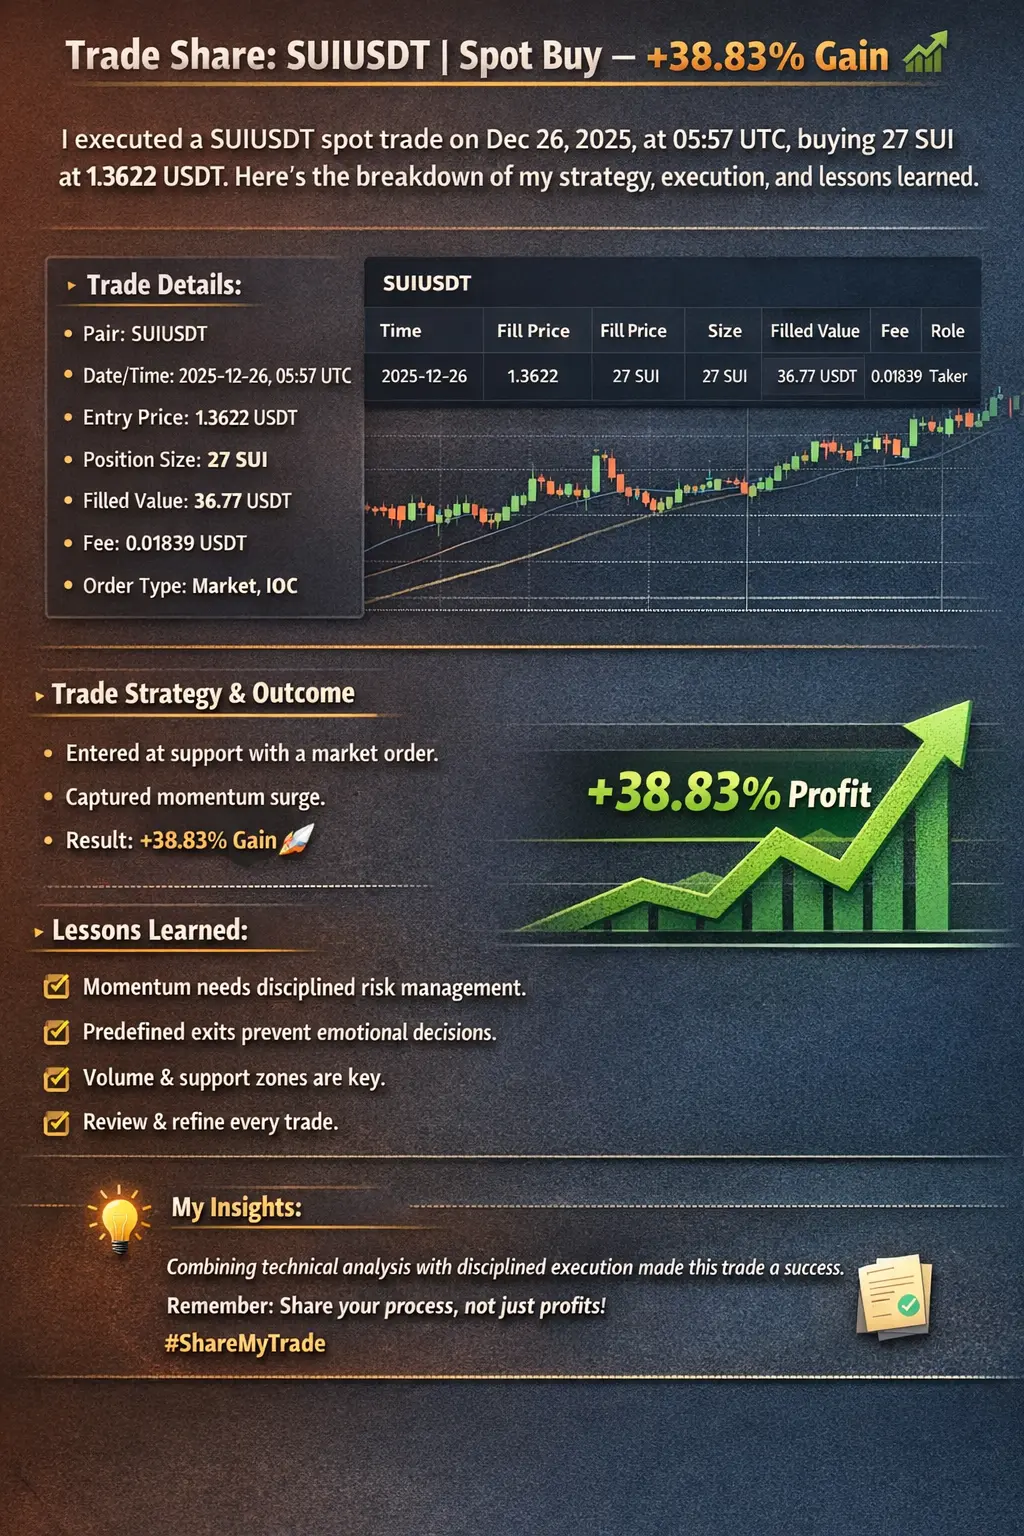
🔥 #ShareMyTrade 🔥
Trade Share SUIUSDT Spot Buy – +38.83% Gain
Trading is not just about chasing profits it’s about strategy, observation, and learning from every move. Every trade, whether a win or a loss, provides an opportunity to analyze market behavior, refine execution, and strengthen decision-making skills. In this post,
I am sharing a recent SUIUSDT spot trade I executed on Dec 26, 2025, at 05:57 UTC, where I bought 27 SUI at 1.3622 USDT using a market order.
This trade exemplifies how combining technical analysis, momentum observation, and disciplined risk management can lead to a
- Reward
- 13
- 24
- Repost
- Share
Crypto_Buzz_with_Alex:
Christmas to the Moon! 🌕View More
📅 Bull Run 2026 Playbook (Speculative):Jan: Rally begins
Feb: $Bitcoin explodes
Mar: Altseason
Apr: BTC ATH
May: Bull trap
Jun: Mass liquidations
Jul: Panic selling
Aug: Bear market
🔖 Bookmark and revisit later.
Feb: $Bitcoin explodes
Mar: Altseason
Apr: BTC ATH
May: Bull trap
Jun: Mass liquidations
Jul: Panic selling
Aug: Bear market
🔖 Bookmark and revisit later.
BTC2,03%
- Reward
- like
- Comment
- Repost
- Share
#ShareMyTrade
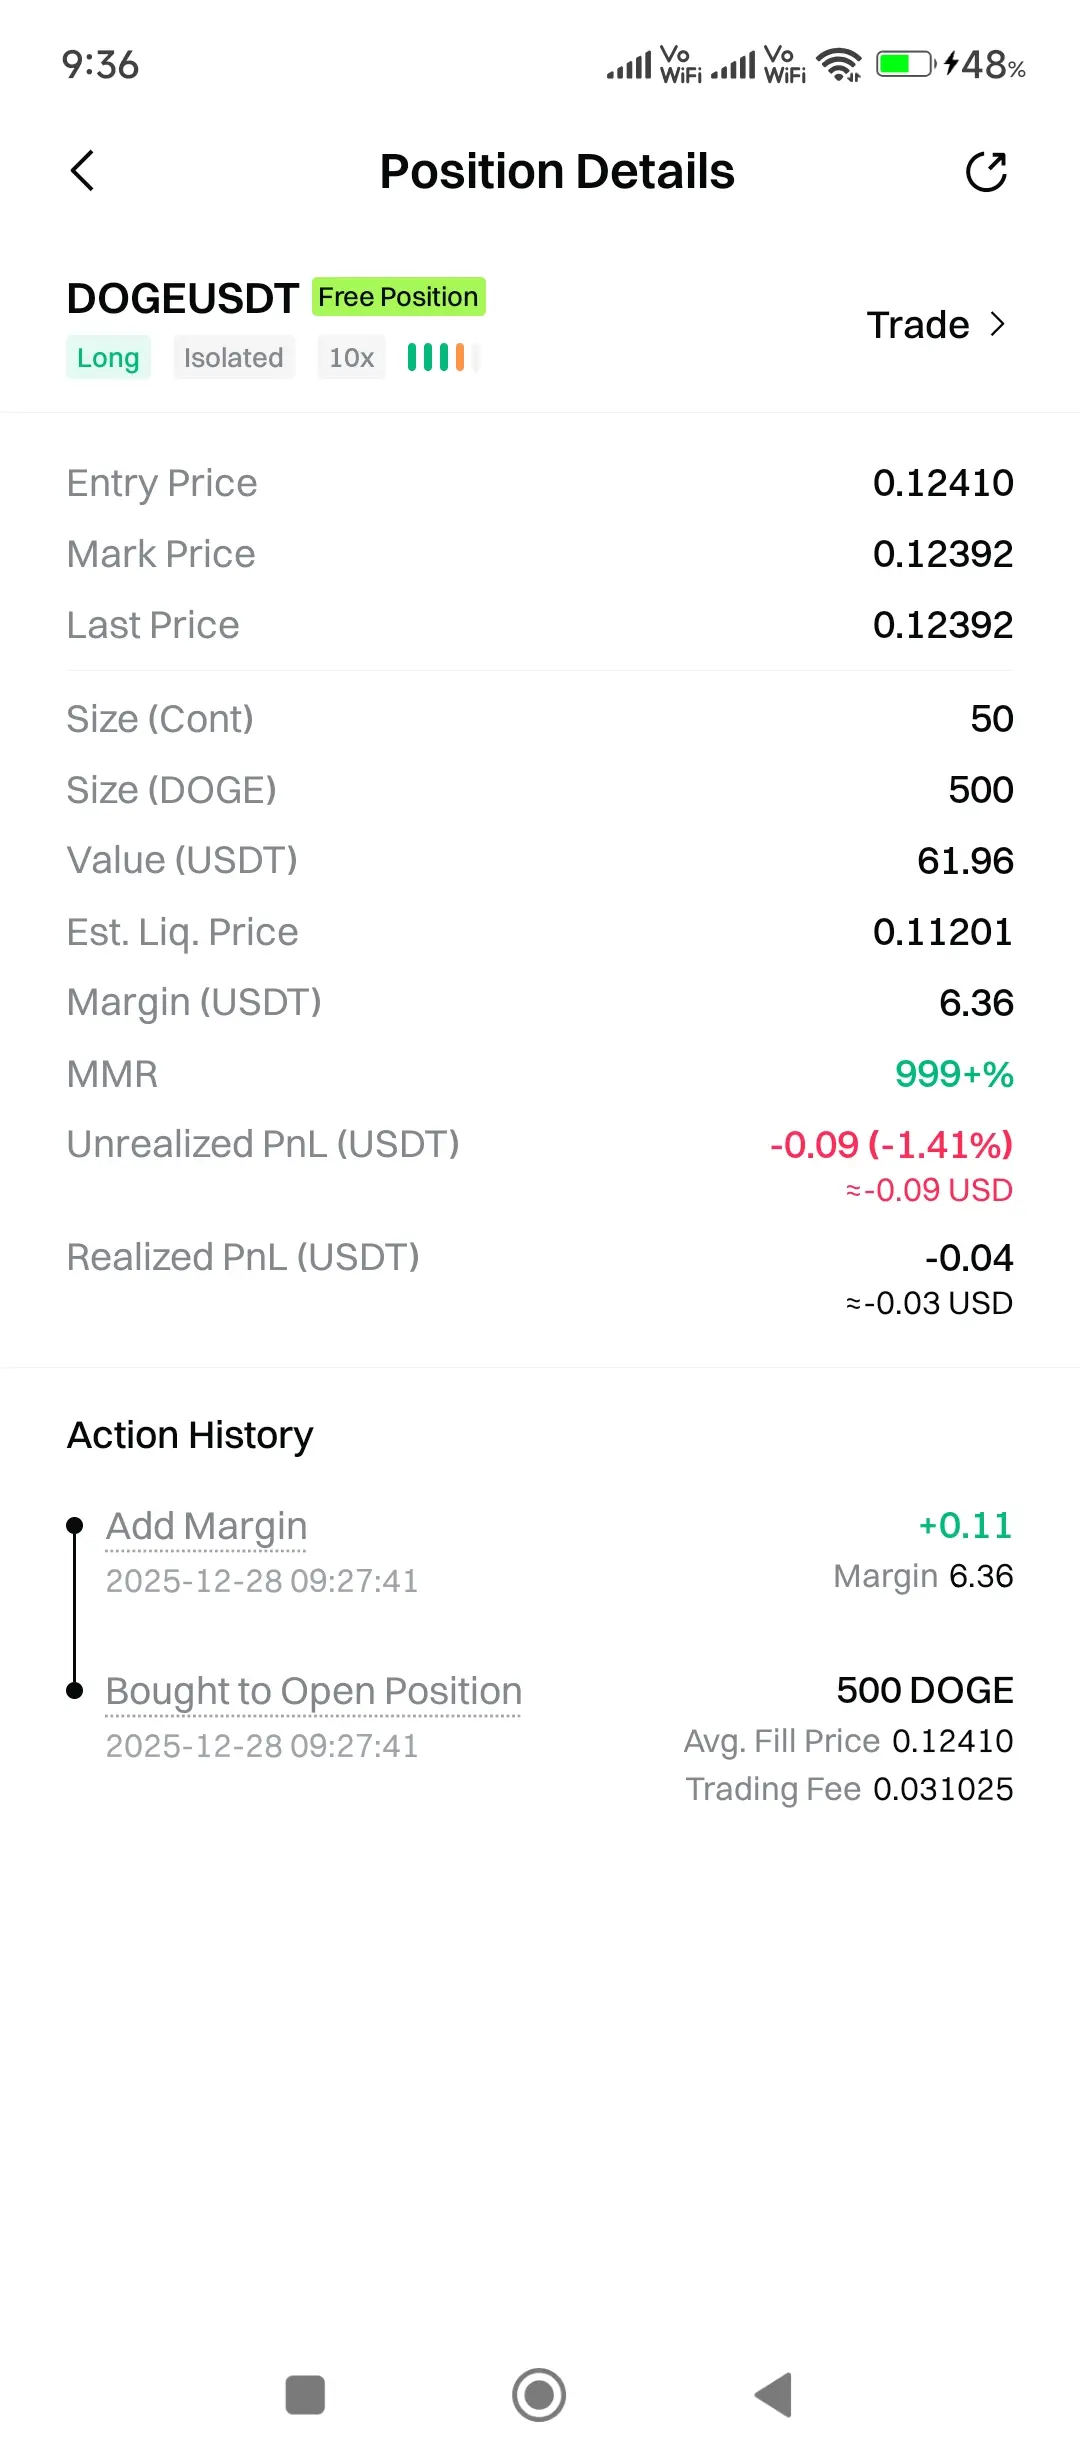
Trade Spotlight | DOGEUSDT Long (Isolated 10×)
🐕📈
Trading DOGE at 10× isolated leverage taught me an important lesson in patience, discipline, and risk awareness. This post highlights the structure, strategy, and risk management behind a carefully planned leveraged trade.
🔹 Position Details
The trade was executed at 0.12410 entry price, with the current price at 0.12392. 500 DOGE (~61.96 USDT) was allocated using 6.36 USDT margin, with an estimated liquidation at 0.11201. Using isolated leverage ensures risk is fully controlled while enabling strategic positioning.
🔹 Trade
DOGE2,03%

[The user has shared his/her trading data. Go to the App to view more.]
- Reward
- 6
- 11
- Repost
- Share
repanzal:
Christmas Bull Run! 🐂View More

- Reward
- 1
- Comment
- Repost
- Share
$TOKEN
ICBG
This coin has now become the number one on Gate fun in terms of rise ✌️
The first coin in the crypto world with this name, iceberg, is the original and has no imitation.
An iceberg does not easily break down; it is strong.
The coin has a very strong community on Gate fun.
The coin can easily increase in value if we all invest in it 👌.
It is very easy to remove 5 zeros from it, as only 1 billion coins are available, and it is not subject to minting or increase 👌.
Don't hesitate and be among the first investors in a coin with a bright future.
The coin is available on Gate fun or se
TOKEN173,48%


- Reward
- 3
- Comment
- Repost
- Share
JF is more than just a name;
It's a steadfast presence, quiet confidence,
and a rare value that needs no fanfare.
An elite identity
Rarity: Limited, not for everyone
Luxury: Refined simplicity and the power of a name
Confidence: Steadfastness of vision
Presence: A name that commands respect
Charisma: An impact that needs no explanation
#GT $BTC $SOL #JF #JUSTFUNNY

- Reward
- 1
- Comment
- Repost
- Share
Only 3 days left until 2025...
What kind of mindset did you have this year?🤣
View OriginalWhat kind of mindset did you have this year?🤣

- Reward
- like
- Comment
- Repost
- Share
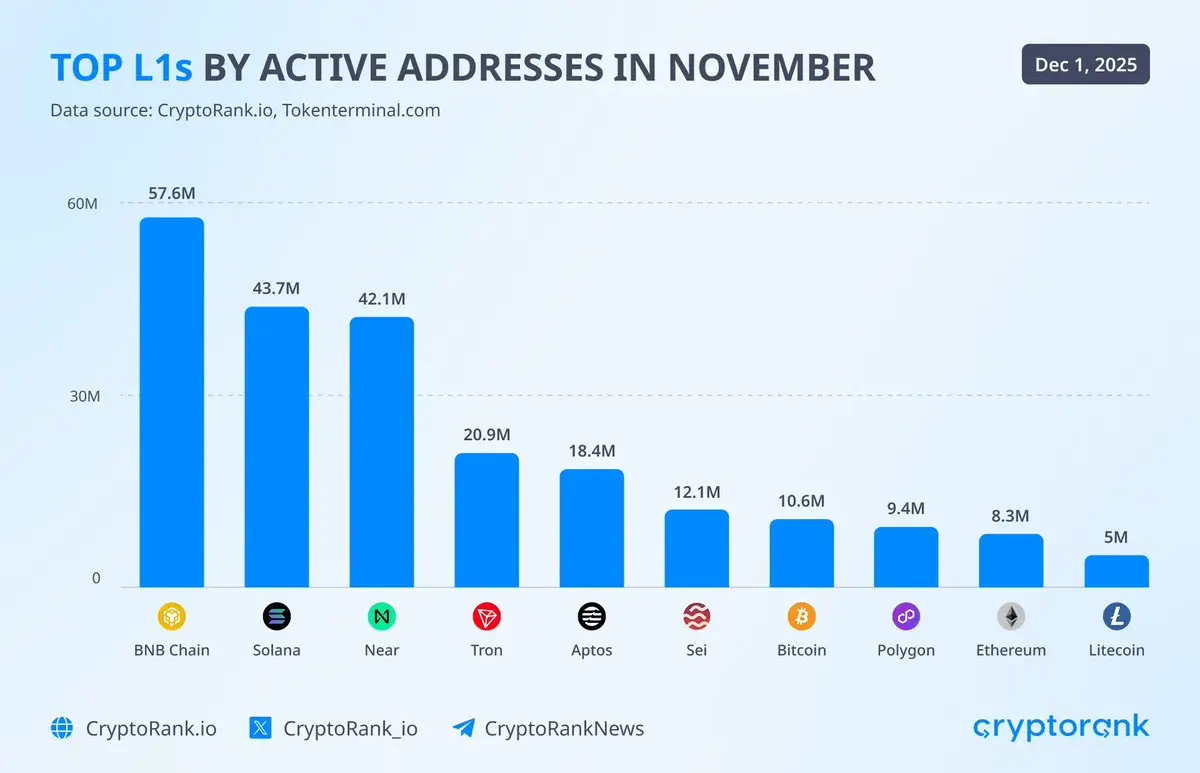
~18.4M active addresses in Nov puts @Aptos right behind Tron and ahead of a bunch of chains people still mentally bucket as bigger.
BNB, Solana, Near, Tron all have very clear identity loops.
#Aptos landing right there suggests it’s already crossed the experimental L1 phase and moved into “people actually do things here” territory.
fees are low, finality is fast, so people don’t batch or wait. They transact:
stablecoins flowing in heavy
RWAs choosing Aptos as a settlement rail
liquid staking and DeFi looping quietly rebuilding TVL
first comes boring activity, then capital starts paying attenti
- Reward
- like
- Comment
- Repost
- Share
Relive a year in crypto—riding the market highs and taking bold leaps. Every moment counts. Check your #2025GateYearEndSummary now, recap your 2025 crypto adventure with Gate, and get 20 USDT through sharing. https://www.gate.com/competition/your-year-in-review-2025?ref=VQBGAVPABQ&ref_type=126&shareUid=U1VGV1xcBgYO0O0O
- Reward
- 3
- 2
- Repost
- Share
ProfitQueen:
good 👍View More
Load More
Join 40M users in our growing community
⚡️ Join 40M users in the crypto craze discussion
💬 Engage with your favorite top creators
👍 See what interests you
Trending Topics
View More135.38K Popularity
3.29K Popularity
48.28K Popularity
1.37K Popularity
700 Popularity
Hot Gate Fun
View More- MC:$3.61KHolders:10.00%
- MC:$3.61KHolders:10.00%
- MC:$3.61KHolders:10.00%
- MC:$3.61KHolders:10.00%
- MC:$3.62KHolders:10.00%
News
View MoreGold stablecoins are entering a period of explosive growth, with the market capitalization potentially approaching $4 billion by 2025.
2 m
Analysis: Copper may face structural shortages in 2026, and prices could remain strong
6 m
Russian police detain 7 power company employees over suspected assistance in illegal cryptocurrency mining causing approximately $129,000 in losses
8 m
Bitcoin Price Analysis: ETF Weekly Outflows of $780 Million, BTC Approaching Key Breakthrough Level
13 m
Trump family-associated company ALT5 Sigma faces audit controversy again, potentially risking delisting
16 m
Pin