As cryptocurrency markets matured into highly volatile, always-on trading environments, interpreting short-term price movements became increasingly complex. Momentum & oscillators address this challenge by measuring the speed and intensity of price changes, revealing whether an asset’s strength is building or fading. By translating raw price action into structured momentum signals, these indicators help identify potential turning points that may not be immediately visible on charts. Today, they play a central role in technical analysis, offering a more systematic way to evaluate market behavior alongside other analytical tools.
What Oscillators Are
Oscillators are not indicators that follow price directions over time; they are indicators that measure how quickly price is changing.
Rather than tracking sustained trends, oscillators focus on the speed of price movement, highlighting shifts in momentum instead of confirming long-term direction. This distinction makes them more suited to identifying potential reversals than validating ongoing trends.
They do not move freely with price; instead, they operate within fixed ranges such as 0 to 100 or -1 to 1. This bounded structure allows traders to recognize extremes in market sentiment. As momentum accelerates or weakens, oscillators adjust in response, often signaling changes before they become clearly visible in price action.
How Oscillators Generate Buy and Sell Signals
Oscillators generate signals by comparing recent price movements to historical ranges. These signals are not predictions but indications of changing momentum.
Common signal mechanisms include:
-
Crossing threshold levels When an oscillator moves above or below predefined levels, it may indicate a shift in market conditions.
-
Divergence from price If the price continues rising while the oscillator weakens, it may signal a potential reversal.
-
Centerline crossovers Some oscillators use a midpoint (such as 50 or 0) to indicate bullish or bearish momentum shifts.
These signals are most effective when combined with context, such as support and resistance levels or overall market structure.
Main Types of Oscillators
There are several commonly used oscillators, each designed to measure momentum in slightly different ways.
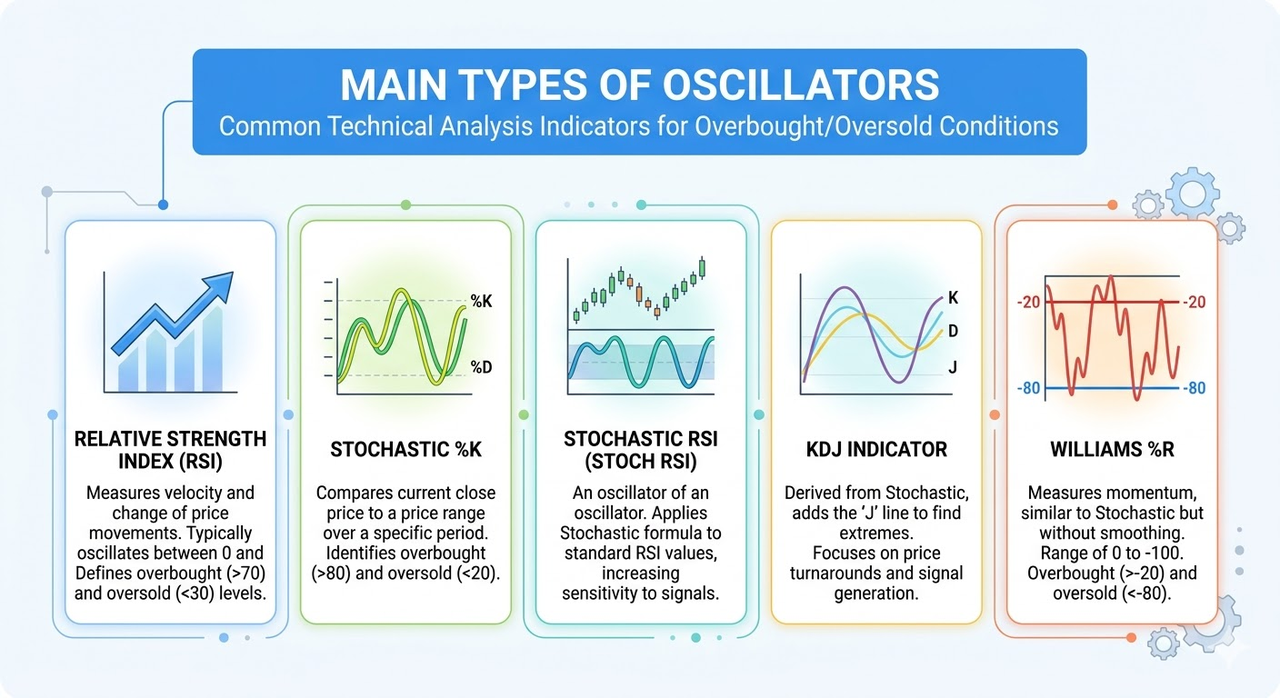
Relative Strength Index (RSI) Measures the speed and magnitude of recent price changes within a 0–100 range. It is commonly used to identify overbought and oversold conditions and assess overall momentum strength.
Stochastic %K Represents the core line of the stochastic oscillator, comparing the current closing price to its recent price range. It reacts quickly to price changes, making it useful for short-term signal detection.
Stoch RSI Fast
Stoch RSI Fast is a more sensitive version of Stochastic RSI that applies the stochastic formula to RSI values instead of price. Because it reacts quickly to changes in RSI, it often produces faster and more frequent signals than standard RSI, especially in fast-moving crypto markets.
KDJ Indicator An extension of the stochastic oscillator that includes an additional “J” line. This extra component amplifies momentum signals and can highlight potential turning points earlier, though it may also increase noise.
Williams %R Measures the position of the closing price relative to the high-low range over a set period, typically scaled from 0 to -100. It is commonly used to identify overbought and oversold levels similar to stochastic indicators.
| Oscillator |
Core Measurement |
Range |
Sensitivity |
Typical Use |
| Relative Strength Index (RSI) |
Speed and magnitude of price changes |
0 to 100 |
Moderate |
Identifying overbought/oversold conditions and general momentum strength |
| Stochastic %K |
Closing price relative to recent high-low range |
0 to 100 |
High |
Short-term signals and quick momentum shifts |
| Stochastic RSI (Stoch RSI) |
RSI values processed through stochastic formula |
0 to 100 |
Very High |
Detecting frequent signals in volatile markets |
| KDJ Indicator |
Extended stochastic with additional “J” line |
Typically 0 to 100 (J can exceed) |
Very High |
Early turning points, though with increased noise |
| Williams %R |
Closing price position within recent range |
0 to -100 |
High |
Overbought/oversold detection similar to stochastic |
Each of these oscillators captures a different aspect of momentum behavior. For this reason, traders often combine multiple oscillators to cross-check signals and reduce the likelihood of false interpretations.
Overbought and Oversold: How to Read the Levels
One of the most common uses of oscillators is identifying overbought and oversold conditions.
For example, in many oscillators:
However, these levels should not be interpreted as automatic reversal signals. In strong trends, assets can remain overbought or oversold for extended periods.
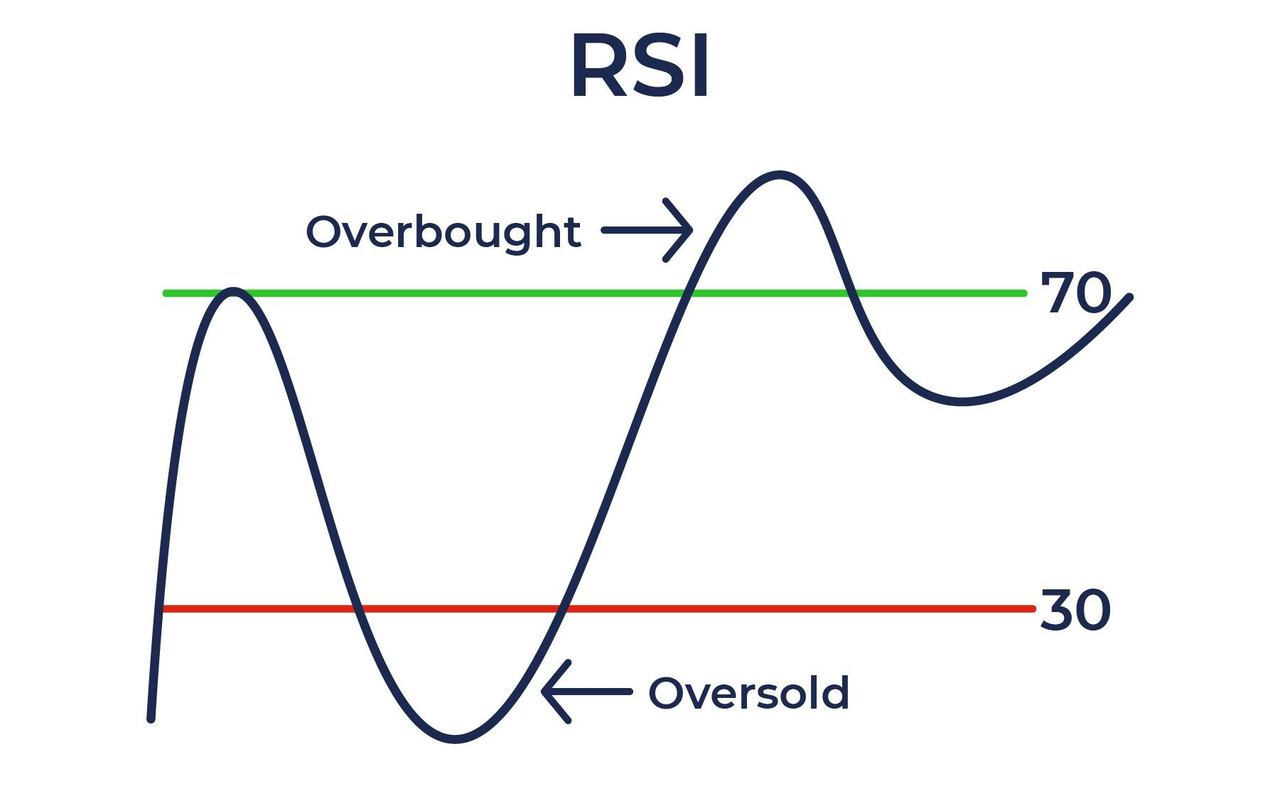
Understanding these zones requires context, including trend strength and market conditions.
Limitations of Oscillators in Trending Markets
Oscillators are most effective in sideways or range-bound markets, where prices move within predictable boundaries.
In strong trending markets, they can produce misleading signals:
-
Persistent extremes An oscillator may remain in overbought or oversold territory for long periods.
-
False reversals Signals suggesting a reversal may occur even as the trend continues.
-
Lag in confirmation Some oscillators react after momentum has already shifted, reducing timing accuracy.
Because of these limitations, relying solely on oscillators can lead to premature or incorrect decisions.
How Oscillators Fit Into a Multi-Indicator Strategy
Oscillators are most effective when used as part of a broader analytical framework.
In a multi-indicator strategy, they are typically combined with:
-
Trend indicators To confirm the overall market direction
-
Support and resistance levels To identify meaningful price zones
-
Volume analysis To validate the strength of price movements
For example, a trader might use a trend indicator to determine direction and an oscillator to time entry within that trend. This combination helps reduce false signals and improves decision consistency.
Oscillators act as a refinement tool rather than a standalone system, adding depth to market analysis.
Conclusion
Momentum & oscillators provide a structured way to interpret the speed and strength of price movements in cryptocurrency markets.
They help identify potential turning points, highlight overbought or oversold conditions, and offer insights into market sentiment. However, their effectiveness depends on context, particularly the presence or absence of strong trends.
Understanding oscillators as part of a broader analytical system allows traders to use them more effectively, not as predictive tools, but as indicators of shifting momentum within complex market dynamics.
FAQs
What is the main purpose of oscillators in trading?
Oscillators measure momentum to help identify potential reversals, overbought or oversold conditions, and shifts in market strength.
Are oscillators suitable for beginners?
Yes, many oscillators are beginner-friendly because they use clear ranges and visual signals, though proper interpretation requires practice.
Can oscillators be used alone?
They can be used independently, but they are generally more effective when combined with other indicators and market analysis methods.
Which oscillator is most commonly used?
The Relative Strength Index (RSI) is one of the most widely used due to its simplicity and clear interpretation.
Do oscillators work in all market conditions?
They work best in range-bound markets and may produce unreliable signals during strong trends.