SK Eternix's peer positioning isn't about explaining what the company is in isolation. Instead, it's about determining which category of Korean renewable energy stocks it fits into most closely. Without first identifying the business type, there's no common ground for understanding revenue structure, risk exposure, or trading page data.
When users compare Korean renewable energy stocks, a common mistake is to pit installed capacity, market performance, revenue growth, or the "renewable energy" label directly against each other in a single dimension. This approach easily overlooks the differences between operation-oriented, engineering-oriented, development-oriented, and equipment-oriented companies. It can also mix up project delivery revenue with long-term operating cash flow.
A better approach for SK Eternix is to compare the business chain and asset strategy first, then examine ESS synergies, power trading capabilities, financing conditions, grid connection pace, and exchange rate exposure. This framework breaks down the "renewable energy sector" into clearer structural questions, avoiding oversimplified conclusions drawn from any single metric.
What type of renewable energy company is SK Eternix?
SK Eternix can be classified as a "renewable energy asset operation platform." Its core isn't a single construction project or a specific type of renewable energy equipment. Instead, it's a portfolio of assets combining solar, wind, fuel cells, ESS, and power trading. This structure makes the company more dependent on project operation, asset management, and long-term settlement efficiency.
Compared to pure engineering companies, SK Eternix's revenue is more likely to reflect operating asset characteristics. Compared to single-source power companies, SK Eternix's business structure is more diversified but also more complex to manage. Understanding this positioning is the first step in peer comparison.
What types of comparable Korean renewable energy stocks typically exist?
Korean renewable energy companies can be roughly divided into four categories: project development, engineering construction, asset operation, and equipment or material supporting. Although all of them sit within the renewable energy chain, they differ significantly in revenue recognition, capital expenditure, project cycles, and policy sensitivity.
Placing all renewable energy companies into one valuation framework easily overlooks differences in business models. When comparing to SK Eternix, the closest counterparts are usually companies that are also operation-oriented, hold assets, and are influenced by power market rules—not pure EPC or single equipment suppliers.
When comparing Korean renewable energy stocks, which dimensions should be considered first?
Start with four basic dimensions:
| Dimension |
Common SK Eternix Characteristics |
Common Differences in Peers |
| Business chain |
Tendency toward integration of development/construction/operation/trading |
May focus on a single stage (development or construction) |
| Asset strategy |
Build-to-Own, hold and operate |
Some companies tend to sell projects |
| Synergy capability |
Emphasis on ESS and trading synergies |
Some companies have shorter synergy chains |
| Risk exposure |
More sensitive to grid connection and financing |
More sensitive to order/construction cycles |
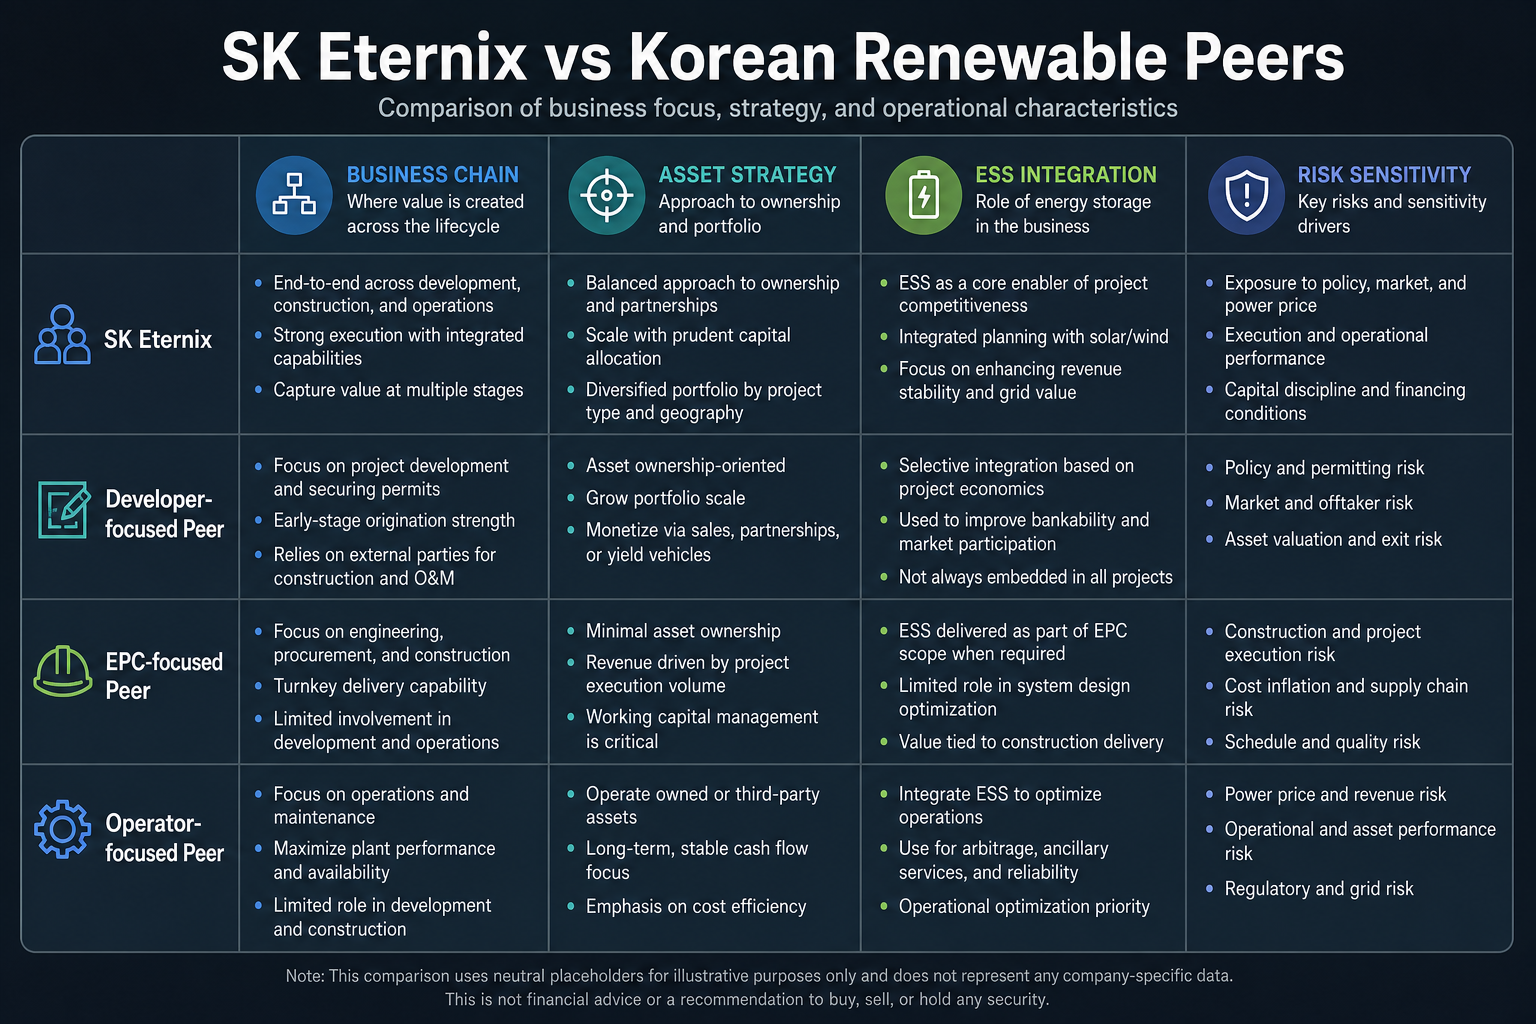 Figure 1. SK Eternix vs. Korean renewable energy peers: Differences in business chain, asset strategy, ESS integration, and risk sensitivity.
The four dimensions in the table serve as a first-level filter. If two companies differ significantly in asset strategy, revenue recognition, and risk exposure, horizontal comparison may be misleading even if both fall under the renewable energy sector.
Where are SK Eternix's structural advantages mainly reflected?
Mainly in "portfolio operation." Solar, wind, fuel cells, and ESS complement each other. After operating assets accumulate, cash flow stability is typically higher, and power trading capabilities help improve asset dispatch and settlement efficiency. This structure suits medium-to-long-term business analysis frameworks better, though it may not always show high elasticity across all market phases.
The value of portfolio operation lies in reducing dependence on a single technology route or single project. Solar, wind, fuel cells, and ESS each have different sensitivities to policy, construction cycles, and operating conditions. A multi-asset portfolio helps build a more complete operating curve. However, the more diversified the assets, the higher the demands on dispatch, financing, and project management.
Compared with peers, what factors influence SK Eternix more?
Compared with peers, SK Eternix is more susceptible to four types of variables. First, the pace of commissioning—when under-construction projects connect to the grid determines how quickly returns are realized. Second, financing conditions—interest rates and the refinancing environment affect asset returns. Third, rule changes—adjustments to the power market mechanism can alter settlement efficiency. Fourth, exchange rate conversion—the account results eventually seen by cross-border investors may not sync with Korean won-denominated performance.
These variables can be reviewed on an ongoing basis using the Policy, Project Progress & Exchange Rate Risk Checklist.
SK Eternix vs. Peers: Core Differences at a Glance
| Comparison Item |
SK Eternix |
Development/Construction-Focused Company |
Equipment or Material Company |
| Revenue characteristics |
Tends toward long-term operation and settlement |
Tends toward project delivery and construction progress |
Tends toward orders, shipments, and price cycles |
| Asset burden |
Heavier, requires long-term asset holding |
Generally depends on project cycle |
Generally more dependent on inventory and capacity |
| Key risks |
Grid connection, financing, policy, power trading rules |
Construction, acceptance, project collection |
Raw materials, demand, price competition |
| Analysis focus |
Quality and cash flow of operable assets |
Project pipeline and execution efficiency |
Gross margin, orders, capacity utilization |
The point of this table is to break down the different profit mechanisms behind the "renewable energy" label. SK Eternix is better analyzed within an operating asset framework rather than by simply comparing revenue growth or market capitalization with all renewable energy companies.
How to avoid "seeming to compare but actually miscomparing"?
Common miscomparisons fall into three types:
- Directly comparing the valuation of an operation-type company with a pure engineering company
- Looking only at installed capacity while ignoring grid connection and utilization
- Looking only at revenue growth while ignoring cash flow quality and debt structure
For SK Eternix, a "structural comparability method" is more appropriate: first filter companies that are also operation-oriented, also have energy storage synergies, and also are affected by policy mechanisms—then perform horizontal comparison. The Build-to-Own business model is a key boundary when judging comparable targets.
What are the limitations of peer comparison?
Peer comparison cannot replace a company's own disclosures. Renewable energy companies vary widely in project stage, grid connection conditions, financing structure, regional policies, and accounting standards. Even if business labels are similar, the corresponding risk curves may be completely different.
Another limitation is asynchronous cycles. Engineering-type companies may reflect order changes earlier; operation-type companies are more affected by grid connection and settlement; equipment-type companies may be affected earlier by raw material prices and inventory. Comparison results should be used as structural judgment, not as a standalone conclusion.
How to combine peer comparison with trading page information?
Peer comparison addresses the company classification issue; trading page information addresses target identification and order execution. When analyzing SK Eternix, first confirm the company behind 475150, then place the business structure into the renewable energy peer framework for observation. If the code, name, or market sector is incorrectly identified, subsequent comparisons lose their foundation.
The trading page can also help verify whether the target is tradable, what order types are available, and whether the account fund denomination is clear. However, this information cannot replace peer analysis. A safer approach is to treat the trading page as an operational verification entry and peer comparison as a business understanding entry, handling each separately.
Summary
The key difference between SK Eternix and comparable Korean renewable energy stocks lies in "model" rather than "label." Without first identifying whether the company is operation-type, project-type, or equipment-type, it's difficult to reach a valid conclusion. Structural comparison matters more than individual numbers.
FAQ
Why can't we just look at installed capacity?
Installed capacity does not equal returns—operation efficiency, settlement mechanisms, and financing costs are equally critical.
Is SK Eternix more like a growth stock or a utility stock?
Somewhere in between: it has growth attributes, but profit realization also shows characteristics of operating assets.
Which indicator should be watched most in peer comparison?
Prioritize the quality of operable assets and cash flow stability, then look at single-period profit growth.
Why can't an operation-type company be directly compared with an engineering company?
Operation-type companies rely on long-term asset operation and cash flow, while engineering companies rely more on project delivery and collection. The two types differ in revenue pace and risk exposure.