Trading on Ethereum’s derivatives market offers one of the clearest views into an investor’s positioning. Current data indicates the bullish structure is gradually beginning to return, suggesting that the early groundwork for a potential upswing may already be taking shape.
That said, the market’s overall sentiment is still fragile. Ethereum [ETH] continues to trade in a tight range, neutral for the day, reflecting the ongoing equilibrium between buyers and sellers.
Neutral sentiment persists even as the signals improve
Ethereum’s derivatives market, the main arena for leveraged positions, is starting to reflect a shift in underlying momentum. Changes in volume momentum show that market participants are slowly adjusting their bias.
According to data from CryptoQuant, net taker volume—an indicator that measures which side of the market is creating more pressure based on matched trades—has broken free from a long-standing bearish trend.
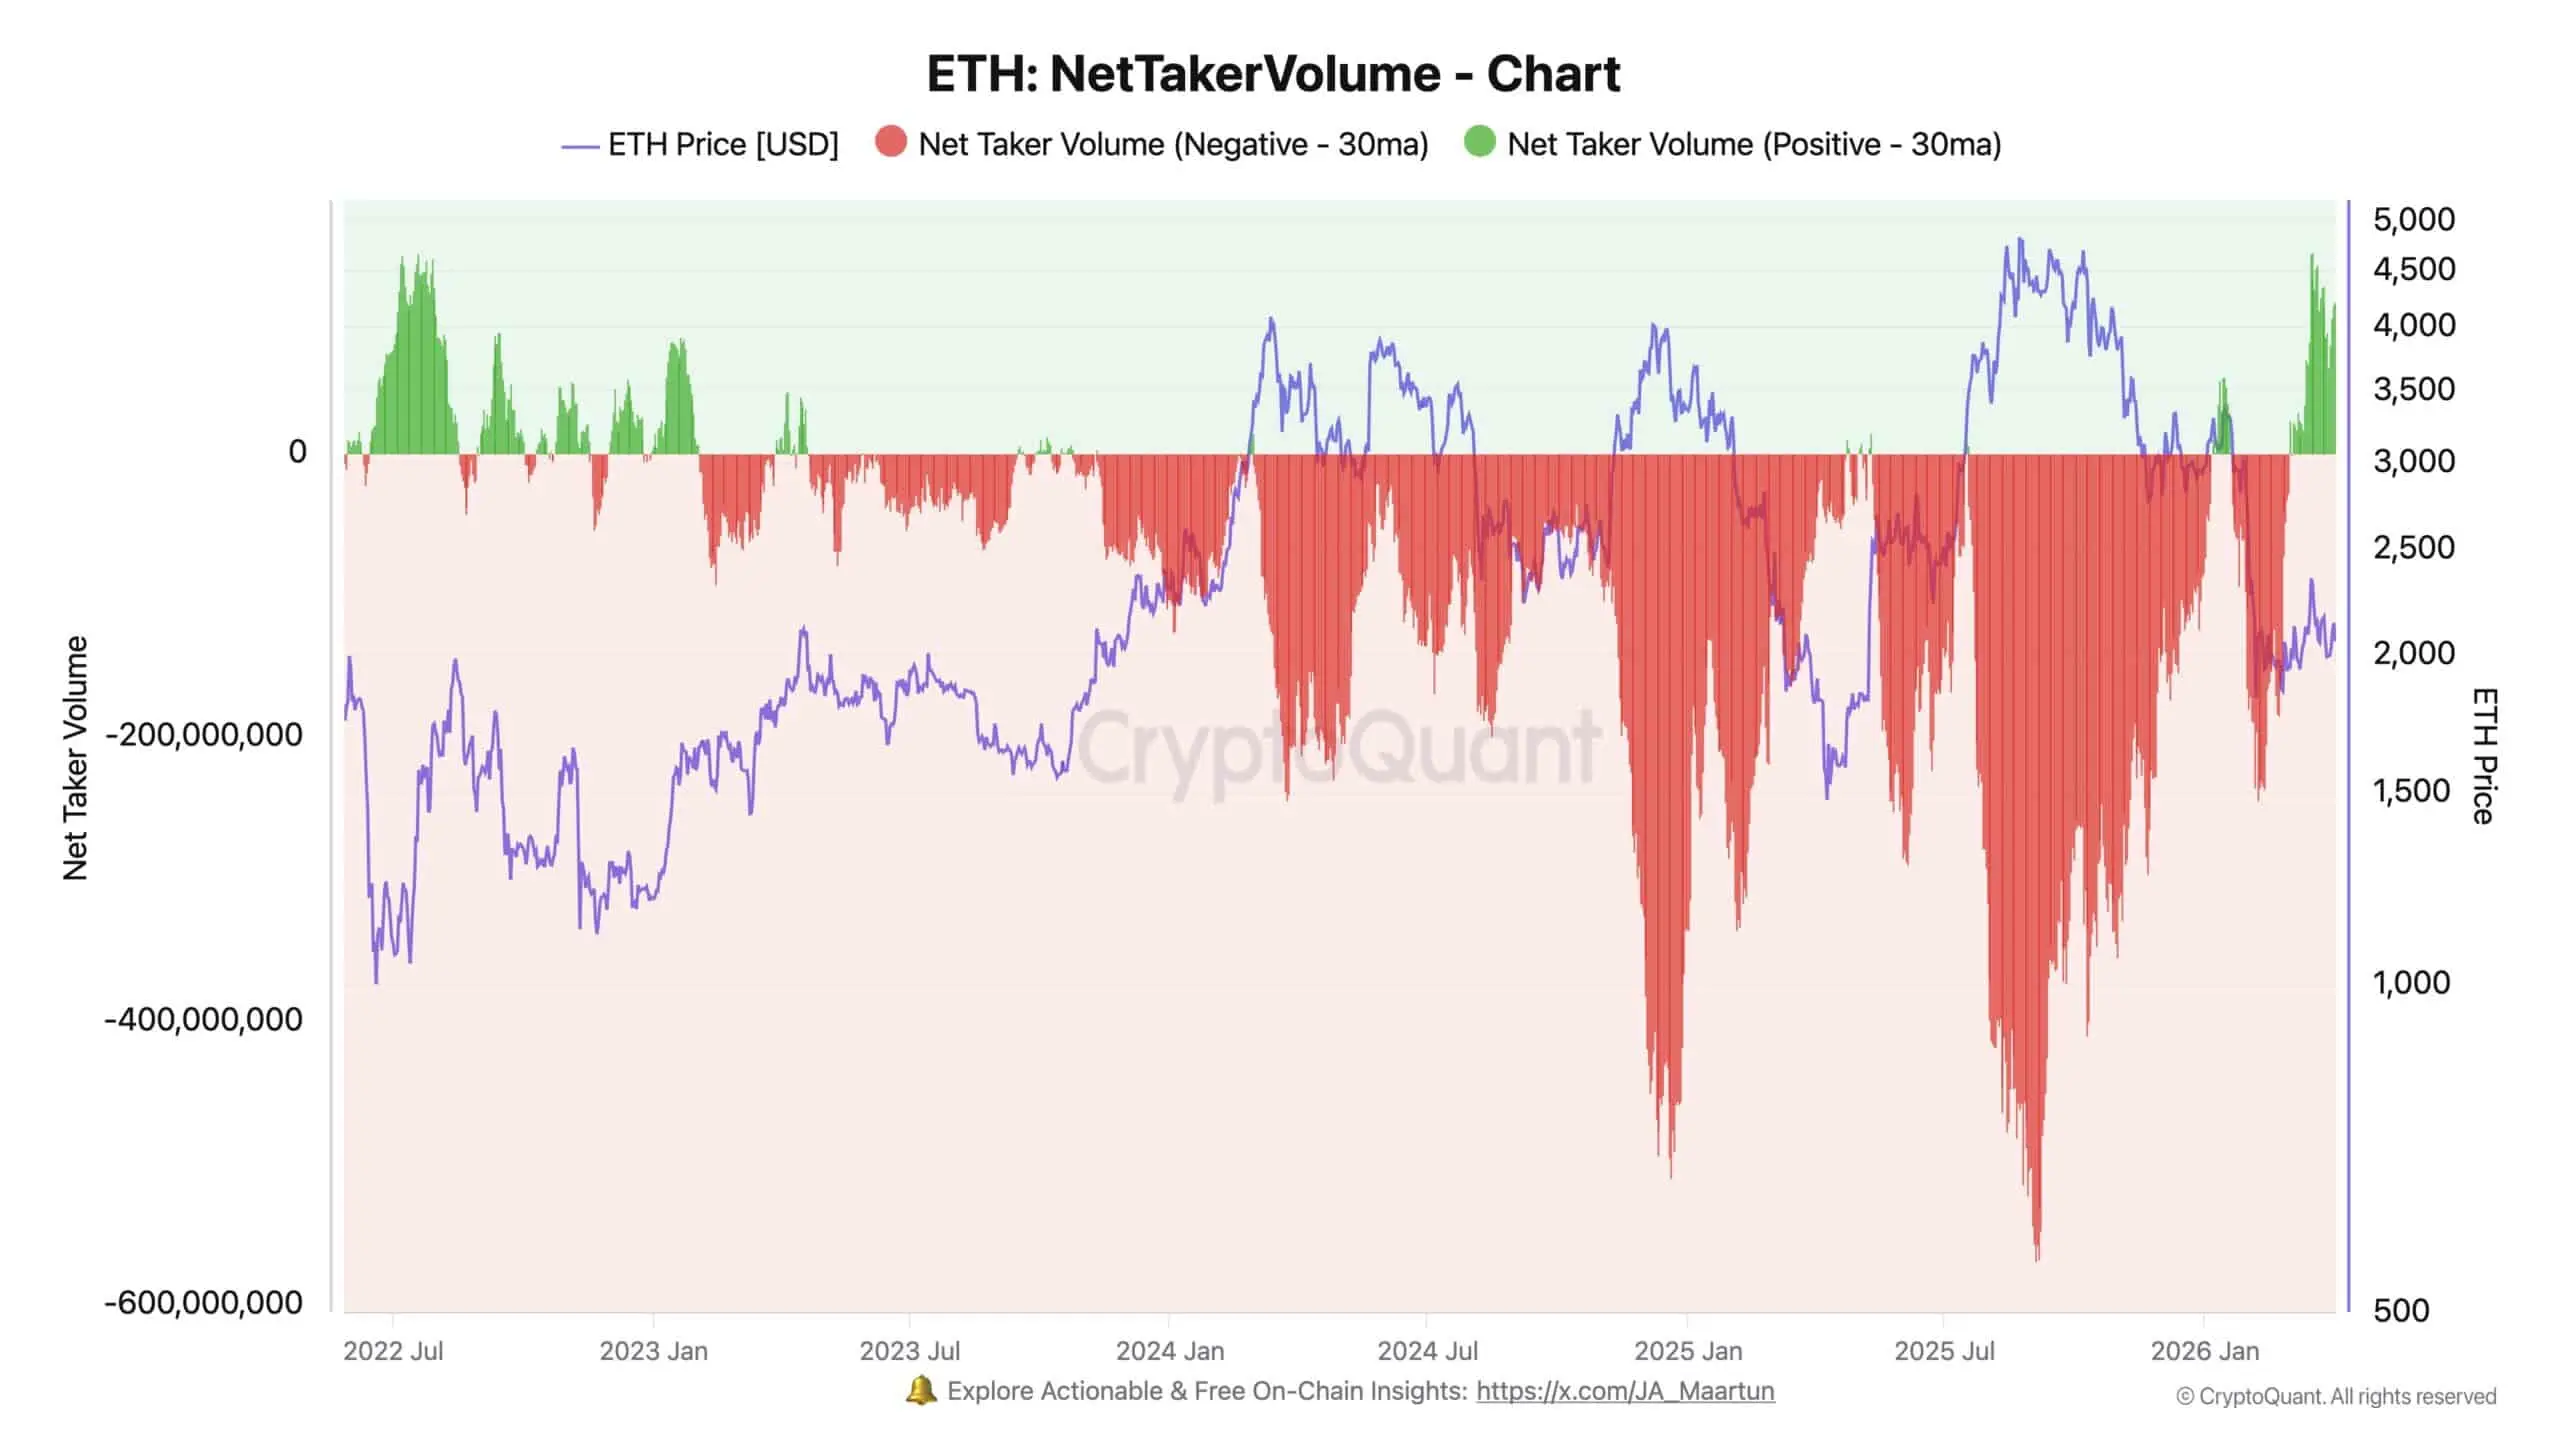 Source: CryptoQuantThis is the first sustained positive reading since 2023, a period largely shaped by the bears’ control and subdued price performance. Throughout that time, Ethereum’s upward momentum remained capped, with price gains limited compared to broader market cycles.
At the time of writing, net taker volume has reached $104 million, indicating that buy-side activity has outpaced sell-side pressure over the past 24 hours.
Capital flows reinforce the shift
The change in volume does not occur in isolation. Capital flows in the futures market are beginning to move in sync with this emerging new structure.
Over most of the past year, the derivatives market has recorded continuous outflows, a signal that traders are reducing their exposure and avoiding leveraged positions amid uncertainty.
Over a 12-month period, approximately $132.51 billion has left the market, showing that the scale of risk-avoidance behavior is very large.
That trend has now reversed. Over the past 60 days, the market has seen $6.64 billion in net inflows. The 30-day figure is $5.74 billion, while the most recent 24 hours alone brought in $131.7 million in new capital entering leveraged positions.
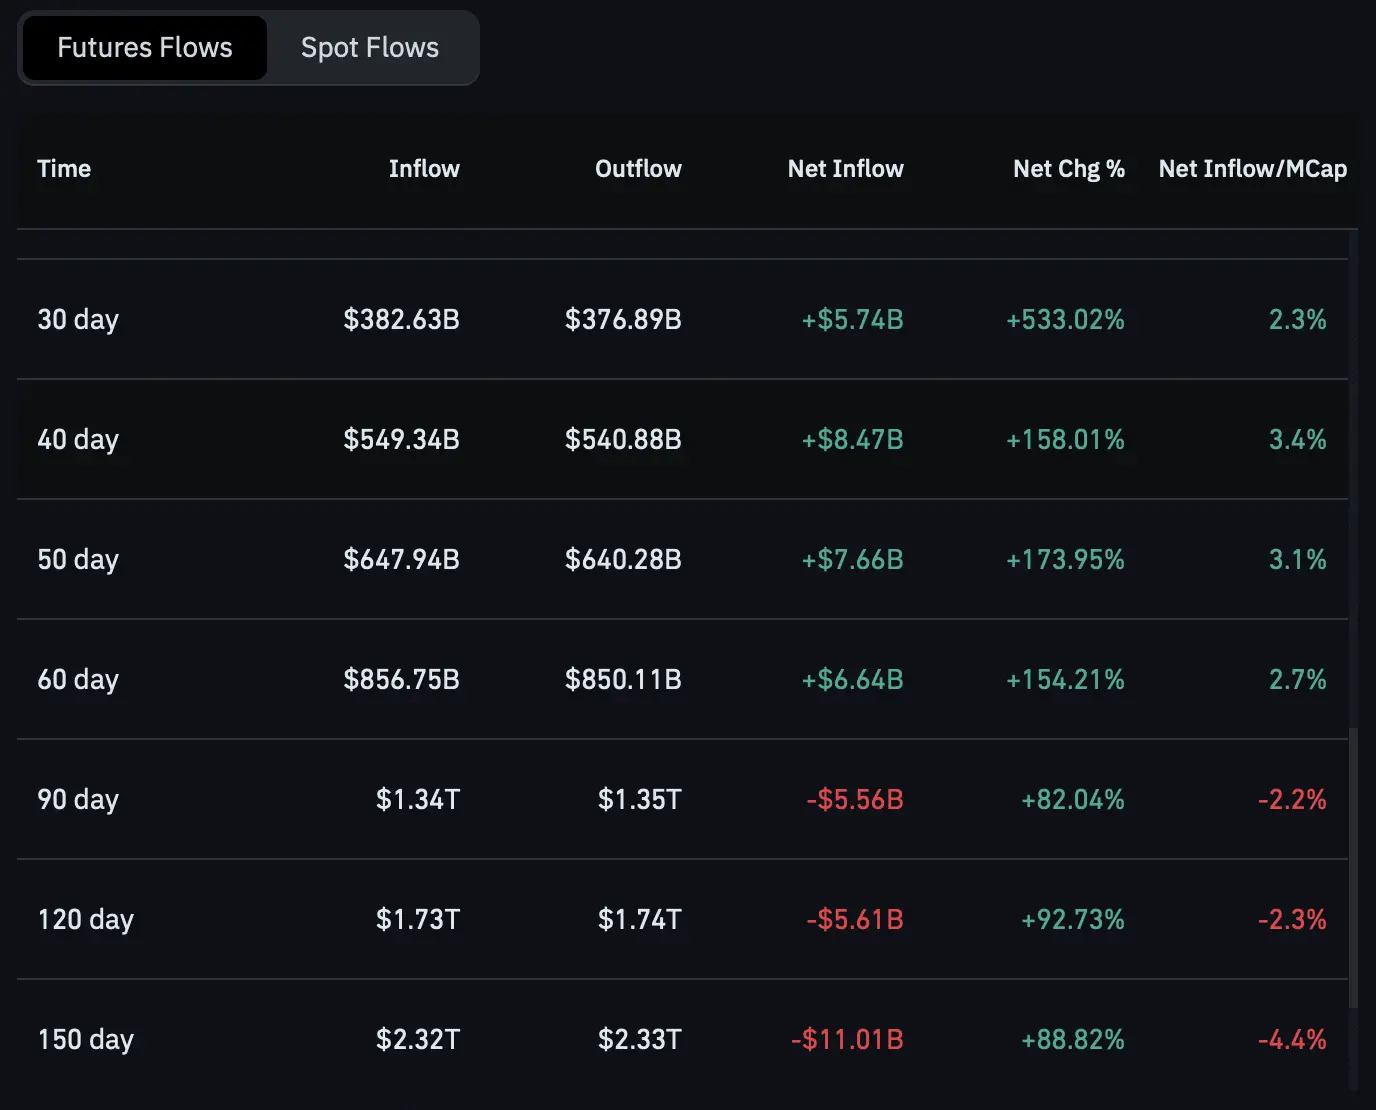 Source: CoinGlassWhile these inflows do not conclusively confirm whether the bulls or the bears are in control, they reflect the stable rebuilding of market confidence.
This shift in the level of participation typically appears before larger directional moves and supports a more positive outlook for Ethereum.
Ethereum’s liquidation map outlines short-term targets
The liquidation heat map, a tool that identifies clusters of liquidations waiting to happen and the price zones likely to pull prices toward them, highlights four key levels currently shaping Ethereum’s short-term trajectory.
On the upside, the first major target lies near $2,070, where liquidity density is relatively thick. A second level sits around $2,090, though that liquidity cluster is thinner.
On the downside, $2,027 is the closest level with notable liquidity, followed by a deeper support zone near $2,010.
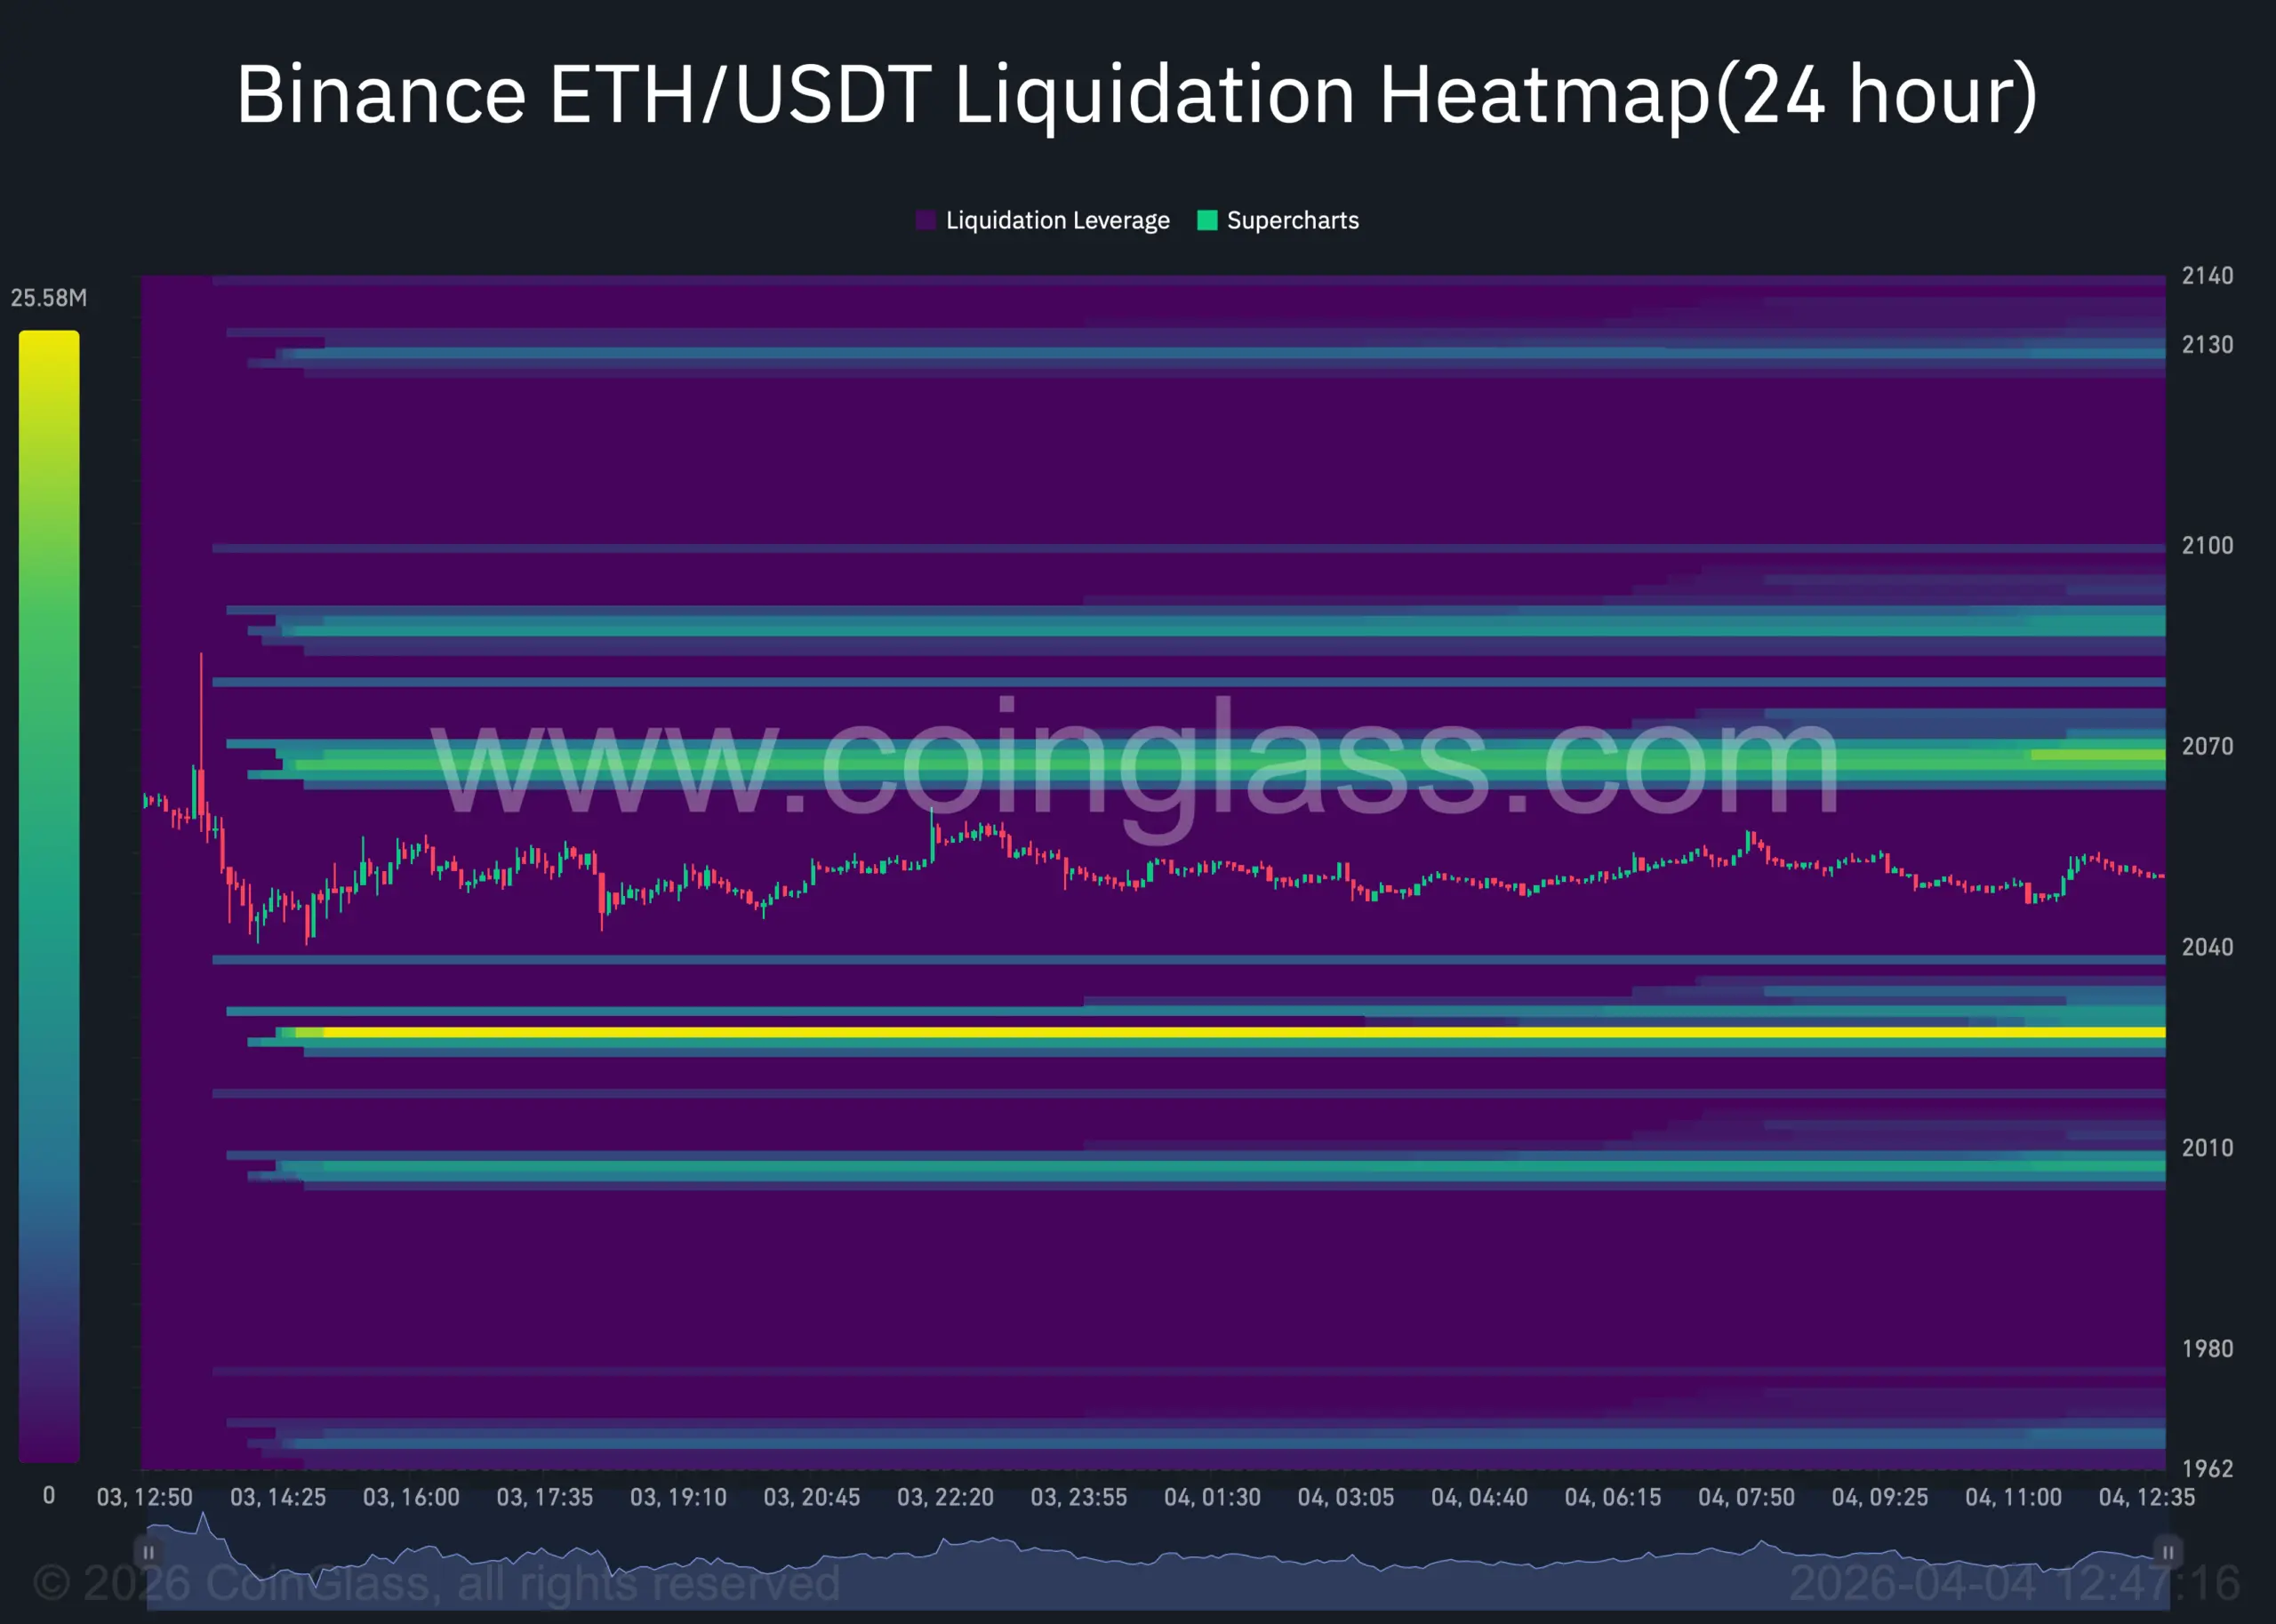 Source: CoinGlassWith price action still neutral over the past 24 hours, Ethereum continues to sit at a turning point. The market’s likely direction will depend on whether momentum can be reinforced by the inflows and recent volume shifts—or whether it stalls under lingering hesitation.
