Alphabet’s Q1 total revenue reached $109.9 billion, up 22% year over year, the highest single-quarter growth rate in four years. Google Cloud is the biggest highlight: quarterly revenue first surpassed $20 billion, up 63%, and operating profit margin expanded sharply from 17.8% a year ago to 32.9%. Cloud backlog orders are nearly doubled quarter over quarter, reaching $462 billion, and management said more than half of that will be converted into revenue within the next 24 months.
The market’s concerns about Google center on two areas:
First, whether AI search is eroding ad revenue. In the traditional search model, user searches → clicks ads → generates revenue—a clear chain. After AI search returns answers directly, whether ad click volume declines has been the core worry plaguing investors over the past two years. The Q1 data shows Google search revenue rising 19% to $60.4 billion, and search queries hitting a historical high—at least temporarily easing concerns about “AI cannibalization.” But whether the Q2 data can continue this trend remains one of the biggest uncertainties for the July 22 earnings report.
Second, Gemini’s progress in commercialization. Alphabet’s Q1 net profit surged 81% to $62.6 billion, with earnings per share of $5.11—an all-time record. But notably, $37.7 billion of that came from other income, including mark-to-market gains from equity investments in Anthropic and SpaceX. After excluding this portion, EPS is actually slightly below consensus expectations. Therefore, in the Q2 earnings report, the market will focus more on organic growth in operating profit than on one-off gains. External sales of TPU chips will also be a focal point. Alphabet has started delivering its in-house AI chips directly to customers’ data centers, and most of the revenue is expected to show up in 2027.
Microsoft: Can Azure carry the burden of $190 billion in compute?
AWS was once the undisputed leader in the cloud market, but in the AI era, Azure and Google Cloud gained a first-mover advantage through deep integration with OpenAI and Gemini. This landscape is changing.
Amazon’s Q1 AWS revenue was $37.6 billion, up 28%, the fastest growth rate in 15 quarters, and its annualized revenue run rate reached $150 billion. Backlog orders rose to $364 billion, up $120 billion quarter over quarter. TD Cowen expects Q2 AWS growth to climb further to 35.5%, and generative AI-related revenue is expected to be about $6.9 billion, up nearly 500% year over year. Among that, revenue related to Anthropic—including Claude API calls and model training services—is expected to be $4.6 billion, roughly two-thirds of AWS’s total generative AI revenue.
Amazon’s in-house chip strategy is becoming a key profit lever. Trainium2 is essentially sold out, and Trainium3 is close to fully booked. Annualized revenue from the in-house chip business (including Trainium, Graviton, and Nitro) has already exceeded $20 billion, showing triple-digit growth. On the earnings call, CEO Andy Jassy said that scaled deployment of Trainium will provide an advantage of “hundreds of bps” in operating profit margin.
But the cost of ramping up is also significant. In Q1, cash CapEx was $43.2 billion, and free cash flow fell from a strong level in the prior-year period to $1.2 billion, a 95% decline. The plan for about $200 billion in capital expenditures for the full year implies that free cash flow could face further pressure and even turn negative. The July 30 earnings report will answer a key question: is AWS’s accelerated growth enough to offset the cash-flow erosion caused by CapEx?
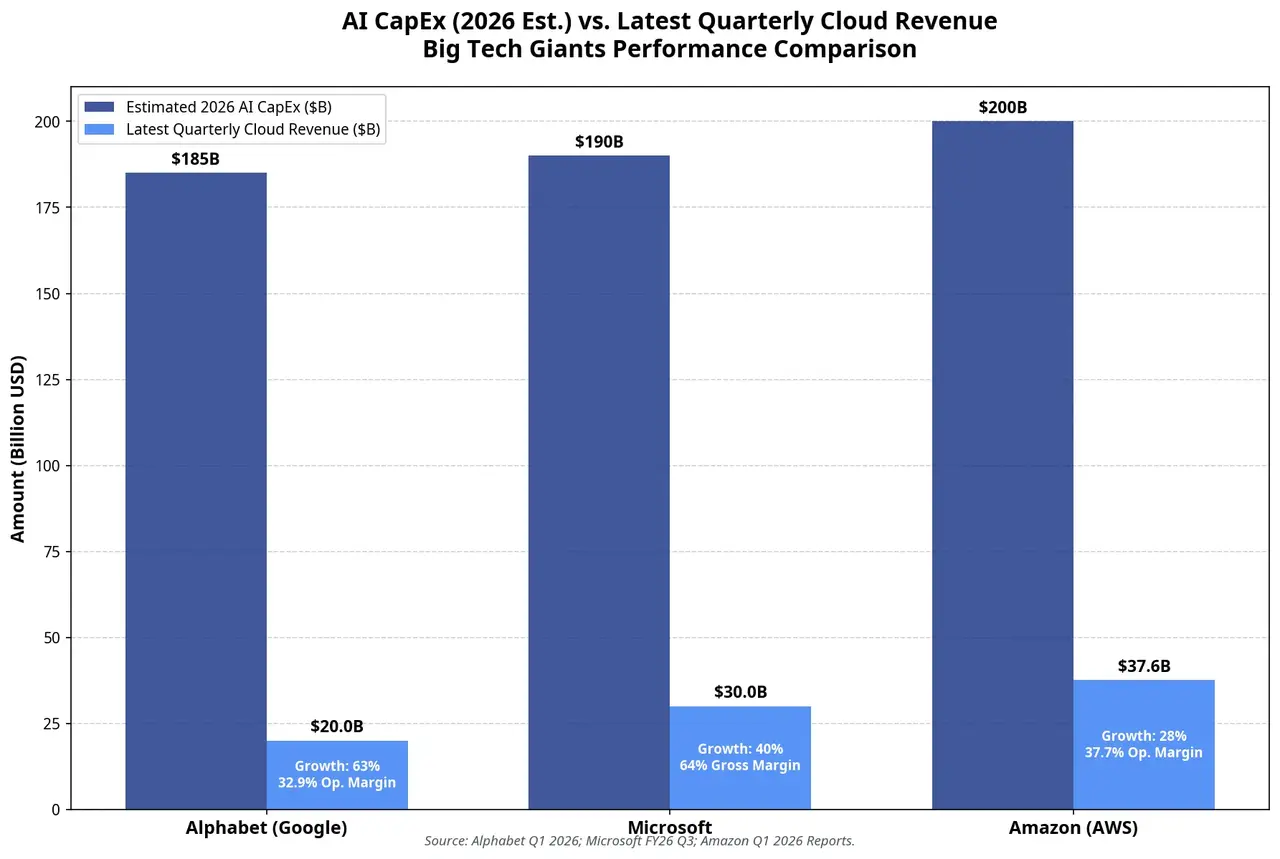
Comparison of AI capital expenditures and cloud revenue across the three tech giants in 2026
The core contradiction between investment speed and commercialization speed
A deeper issue the three companies face is whether the slope of CapEx growth outpaces the slope of revenue growth.
If you sum the capital expenditures of four hyperscale cloud providers—about $725 billion—and compare it with currently visible direct AI revenues, the gap is significant. Some analysts point out that in 2026, AI CapEx by the world’s top five tech giants is expected to exceed $690 billion, while direct AI service revenue is only about $25 billion. This ratio is clearly unsustainable, but it needs to be separated into two revenue layers: direct AI revenue (model API calls and AI subscription services) versus AI-driven cloud revenue growth (cloud consumption driven by AI workloads). The latter is far larger than the former and is the core monetization path for all three companies.
The key threshold is this: if the growth rate of AI cloud revenue continues to exceed the growth rate of CapEx, the market will continue to assign a premium; otherwise, the market will reassess the risk of an AI bubble. This is the ultimate question for the late-July earnings season.
From Q1 data: Google Cloud’s 63% growth corresponds to CapEx growth of 107%—revenue growth is still lagging behind investment growth. Azure’s 40% growth corresponds to Microsoft’s CapEx of $31.9 billion—similar tension exists there as well. AWS’s 28% growth corresponds to Amazon’s Q1 cash CapEx of $43.2 billion—so all three are in a phase where investment is running ahead of revenue.
The issue is not the current numbers, but when the inflection point in the trend will appear.
Three stages of infrastructure investment
The AI infrastructure value chain is shifting in stages:
First stage (2023–2025): the GPU supply chain. The winners are chip companies—Nvidia, AMD, and Broadcom. Hyperscale cloud providers are buyers, not beneficiaries.
Second stage (2025–2026): the scale race for cloud infrastructure. The winners are the platforms that can convert compute capacity into cloud service revenue the fastest—Google Cloud, Azure, and AWS. The core metrics in this stage are market share and growth rate.
Third stage (2026–): commercialization of AI applications. The winners will be players who embed AI capabilities into enterprise workflows and create measurable ROI. Paid Copilot users surpassing 20 million, Google Cloud enterprise AI revenue up nearly 800% year over year, and AWS generative AI revenue up 88% quarter over quarter—these signals suggest the third stage has started, but there’s still a gap before true scale.
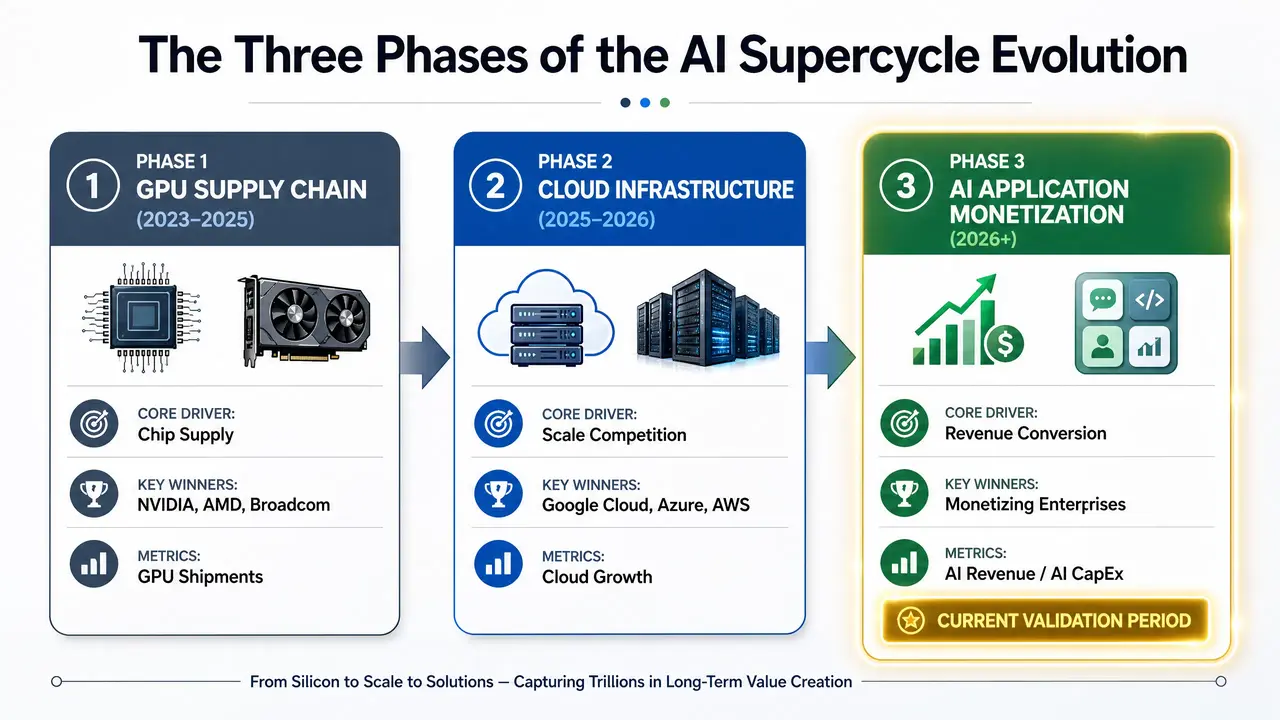
Three-stage evolution path of the AI supercycle
AI ROI: The core pricing factor for 2026 tech stocks
Future market attention is shifting from absolute totals to efficiency. Investors will increasingly focus on a key ratio: AI revenue / AI capital expenditures—how much incremental revenue a company generates for each $1 invested in AI infrastructure.
The significance of this metric is that it does not reward investment size for its own sake; it rewards capital allocation efficiency. Companies that convert compute into revenue at lower cost and faster speed will earn structural premiums in valuation.
The initial positions of the three companies on this metric are different. Google Cloud has the highest revenue growth rate (63%) and the strongest profit margin expansion (from 17.8% to 32.9%). Azure has the largest absolute AI revenue scale (annualized over $37 billion) and the deepest ecosystem lock-in (OpenAI). AWS has the most aggressive in-house chip strategy and the strongest backlog growth. But who can prove themselves first on investment/output efficiency remains an open question.
Conclusion
This earnings season in July 2026 marks a key turning point for the AI supercycle—from “expectation-driven” to “verification-driven.” Alphabet’s $180 billion to $190 billion, Microsoft’s $190 billion, and Amazon’s $200 billion—those numbers themselves are no longer news. What is news is: what this money will turn into.
Google Cloud’s 63% growth, Azure’s 40% growth, AWS’s 28% growth (and the expected 35.5% acceleration)—these are stage outcomes. But what capital markets need to see is whether, while the investment curve remains steep upward, the revenue curve can catch up with an even steeper slope.
Over the next few quarters, the absolute amount of AI CapEx will continue to rise—Alphabet has already stated that 2027 will be “significantly higher” than 2026. But market tolerance will increasingly depend on one simple question: for every $1 invested, is it producing more than a $1 increase in revenue?
The three earnings reports at the end of July will provide the first round of answers.
FAQ
Q1: Why has the market’s focus on AI capital expenditures shifted from “investment size” to “ROI validation”?
From 2024 to 2025, the market rewarded companies that deployed AI infrastructure first, and GPU purchase volume and data center scale were the core logic behind the valuation premium. But entering 2026, cumulative investment has reached a scale of several trillions, and investors are starting to ask whether these assets can generate sufficient cash-flow returns. If sustained CapEx growth cannot drive revenue and profit to grow in sync, it will directly erode free cash flow and profit margins—so ROI validation becomes the new core pricing logic.
Q2: Can Google Cloud’s 63% growth be sustained?
Google Cloud achieved 63% year-over-year growth in Q1, the fastest among the three cloud providers. But that growth rate faces two challenges: first, the base effect will gradually emerge; second, whether AI chip capacity and data center delivery can continue to match demand. Management said on the Q1 call that, absent near-term compute constraints, revenue could have been higher. The Q2 earnings report will be the key window to test whether this growth is sustainable.
Q3: Is Microsoft’s $190 billion CapEx plan at risk?
The main risks are concentrated in two areas. First, depreciation pressure: large-scale investments in data centers and GPUs will raise depreciation expenses in future quarters, which has already pushed gross margin down to the lowest level in three years. Second, capacity-conversion efficiency: if incremental compute is not converted into Azure revenue and AI subscription revenue in a timely manner, free cash flow will remain under pressure. Microsoft’s annualized AI revenue has already exceeded $37 billion, but whether this scale is enough to cover the continuously rising investment still needs time to be validated.
Q4: What impact does Amazon’s in-house chip strategy have on AI investment returns?
Amazon’s Trainium and Inferentia chips are fundamentally changing its cost structure. CEO Andy Jassy said that scaled deployment of Trainium will provide an operating profit margin advantage of “hundreds of bps.” Trainium2 is sold out, and Trainium3 is close to fully booked. OpenAI and Anthropic have committed to large-scale purchases. If in-house chips can effectively replace Nvidia GPUs, AWS’s profit margin could potentially return from the current 37.7% to above 40%. This would be a key differentiating factor for Amazon versus Google and Microsoft.
Q5: Is there a bubble risk in AI infrastructure investment?
The core standard for judging bubble risk is the time gap between input and output. If AI revenue growth continues to lag behind CapEx growth by more than 12 to 18 months in the future, the market will reprice. But as of now, the three companies’ cloud businesses are still accelerating in growth—Google Cloud 63%, Azure about 40%, and AWS expected at 35.5%—and backlog orders remain at historical highs. The real risk is not that AI demand does not exist, but whether the speed of infrastructure buildout exceeds the application layer’s capacity to absorb and commercialize.