#XAU
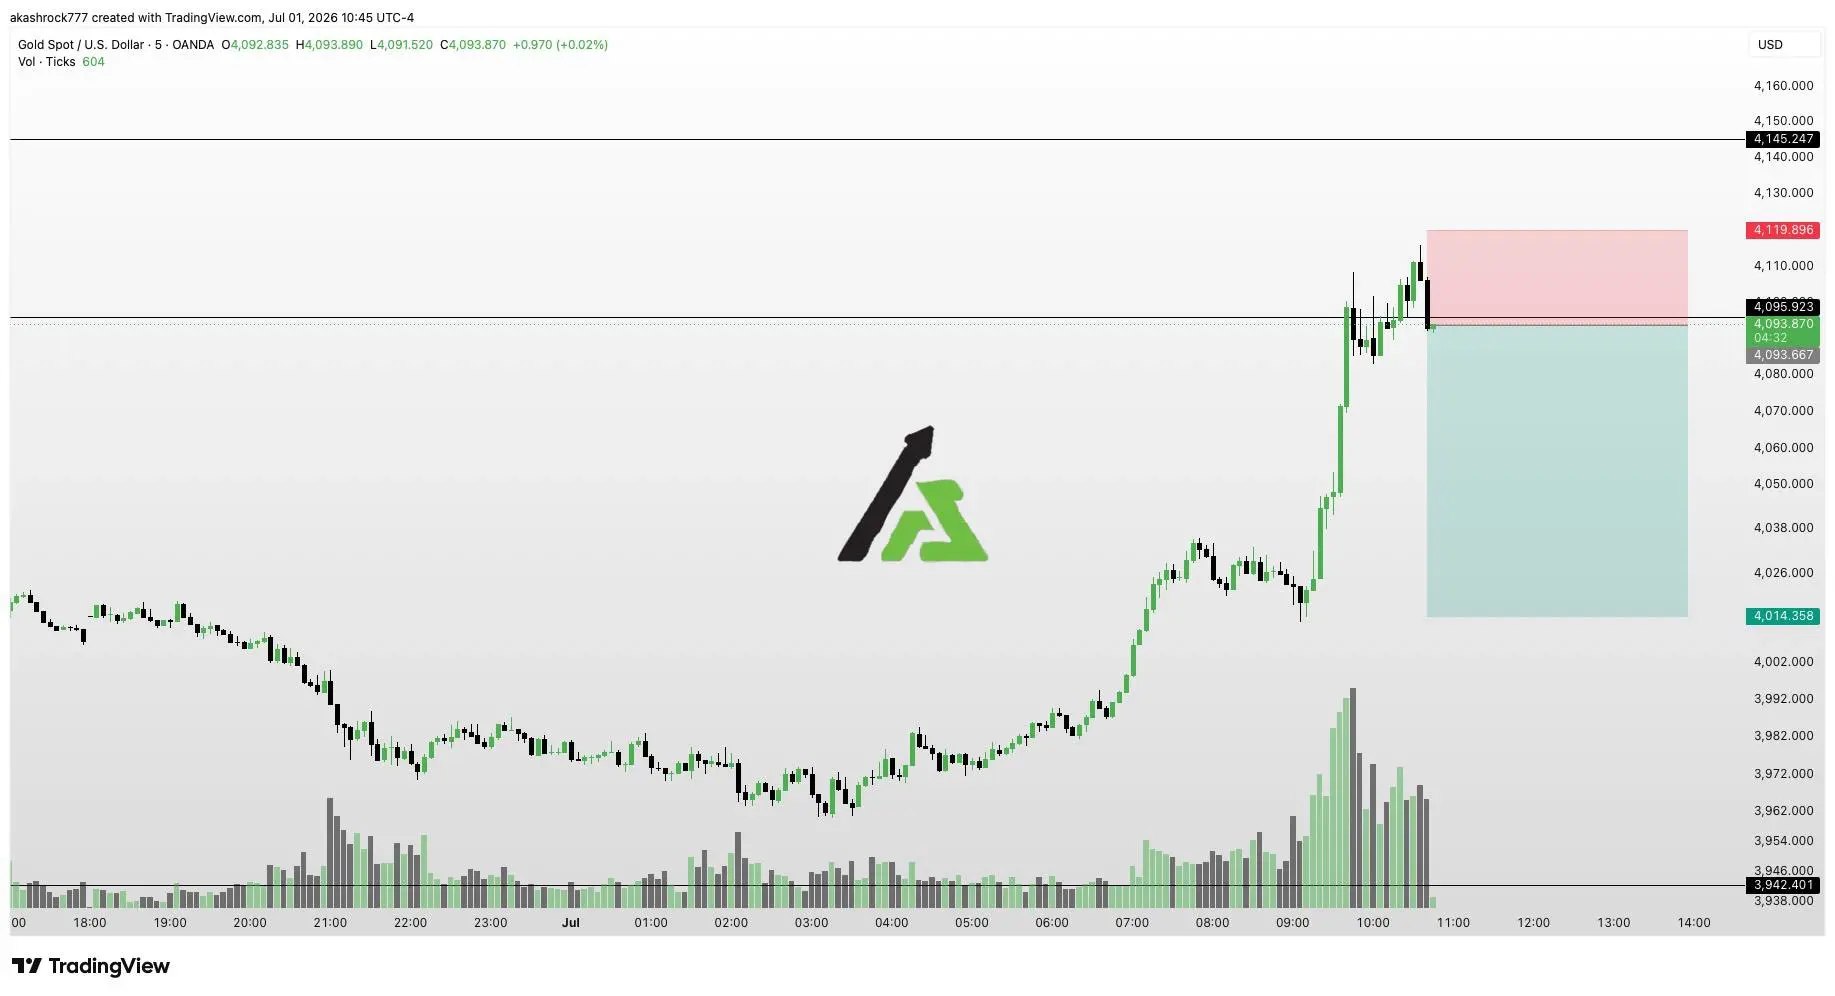
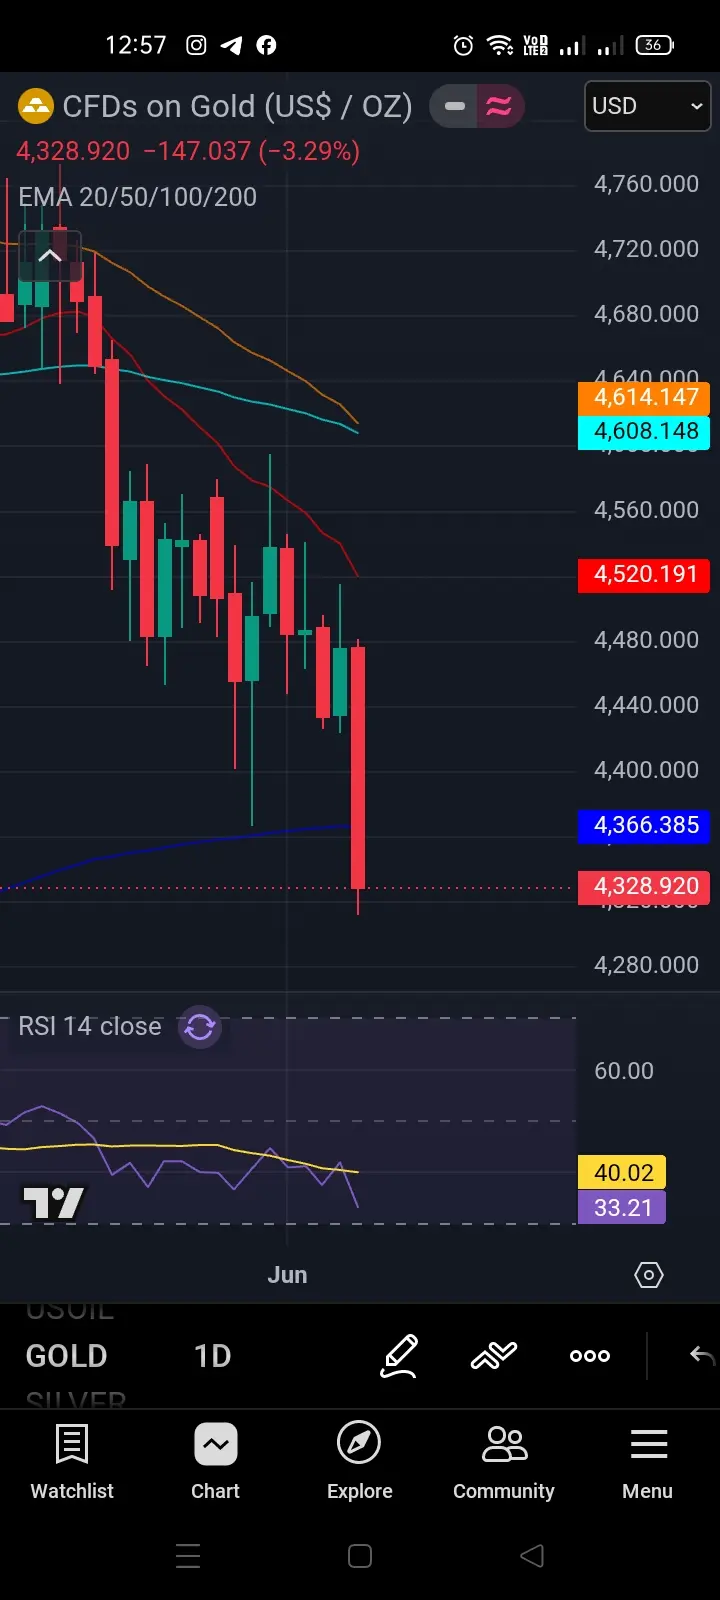
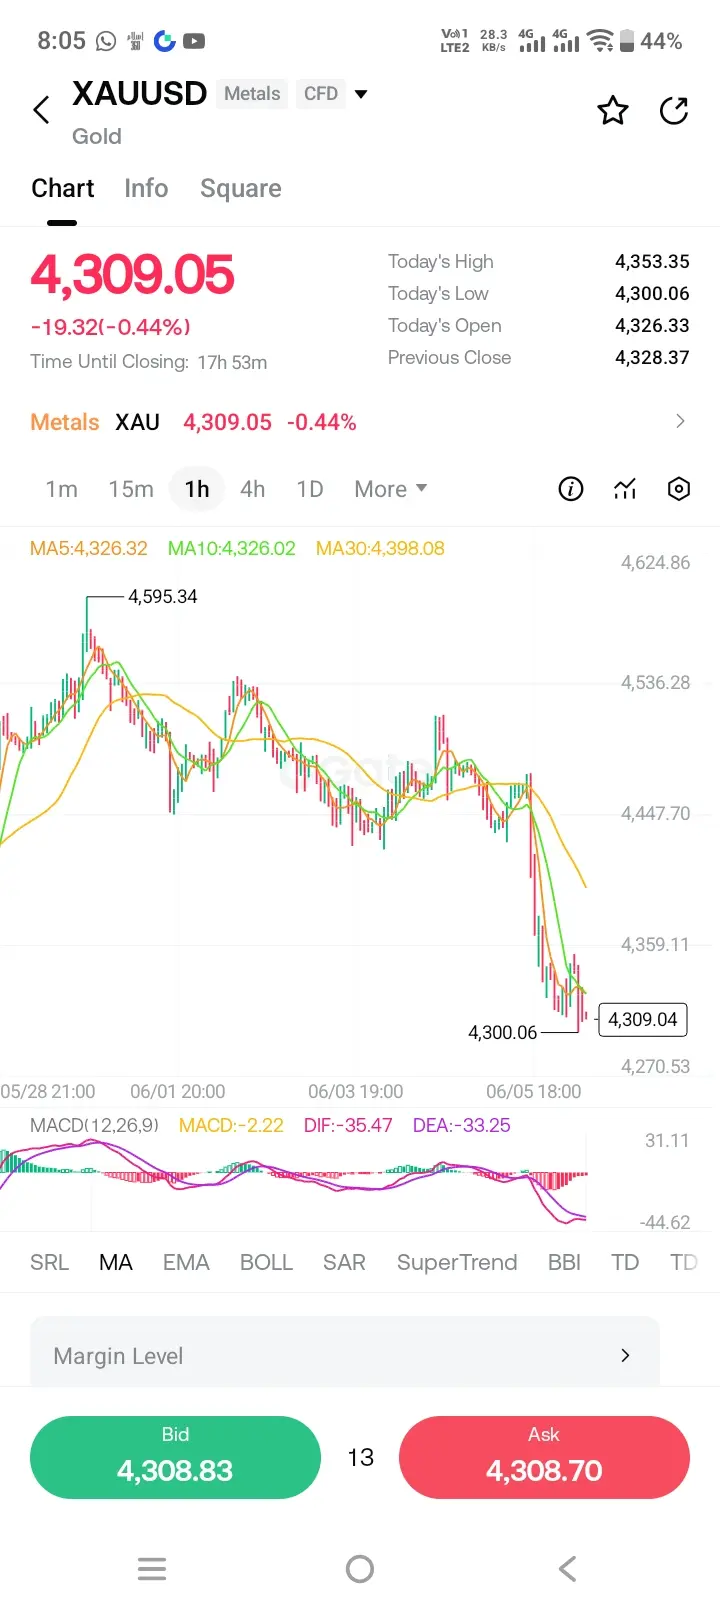
The gold market has experienced one of the most dramatic price movements in recent memory during 2026. After reaching an all-time high of approximately $5,600 per ounce in January 2026, gold prices underwent a severe correction, dropping to as low as $3,942.99 per ounce in late June, representing a decline of approximately 29.59% from the peak. The current price around $4,180 represents a recovery of roughly 6.01% from those June lows, but the metal still trades approximately 25.36% below its January peak.
Understanding the Reasons Behind Gold's Decline from $5,600 to Below $4,000
Multiple interconnected factors contributed to gold's sharp decline from its record highs. The primary driver was the shift in Federal Reserve policy expectations under the new Fed Chair Kevin Warsh. The market had initially anticipated two to three rate cuts in 2026, but by July, the U.S. Overnight Index Swap curve was pricing in approximately 1.5 rate hikes instead. This dramatic reversal in monetary policy expectations caused real yields to rise across the curve, making coupon-bearing assets more attractive relative to non-yielding gold.
The geopolitical situation involving Iran, Israel, and the United States created a complex dynamic. While conflicts typically drive safe-haven demand for gold, the specific unfolding of events in 2026 actually contributed to inflation concerns that strengthened the U.S. dollar. The dollar index caught a strong bid as investors sought safety in U.S. assets, with U.S. money market fund assets reaching a record $7.9 trillion. A stronger dollar typically weighs on gold prices since the metal is denominated in USD.
Higher Treasury yields presented another significant headwind. As yields rose, the opportunity cost of holding gold increased substantially. Gold pays no interest or dividends, so when risk-free rates available in government bonds climb, the relative attractiveness of gold diminishes. The 10-year Treasury yield movements throughout 2026 reflected these shifting expectations.
Additionally, profit-taking after the extraordinary rally of 2025 and early 2026 played a role. Much of the buying beyond macro fundamentals was driven by speculative interest as traders sought to capitalize on the strong bullish trend. When momentum shifted, these speculative positions unwound, accelerating the decline.
Current Market Structure and Technical Analysis at $4,180
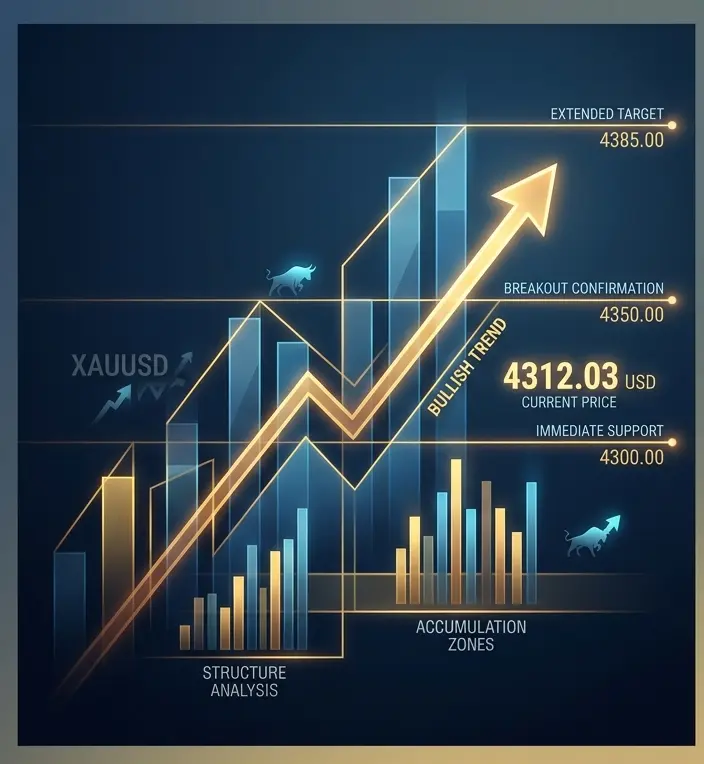
Gold's recovery to the $4,180 level represents a technically significant development. The price action has established several critical support and resistance zones that will likely govern near-term trading ranges. From a technical perspective, the $4,000 level has emerged as crucial psychological and structural support. This round number represents more than just sentiment; it aligns with the October 2025 highs and serves as a line in the sand for the 2026 outlook.
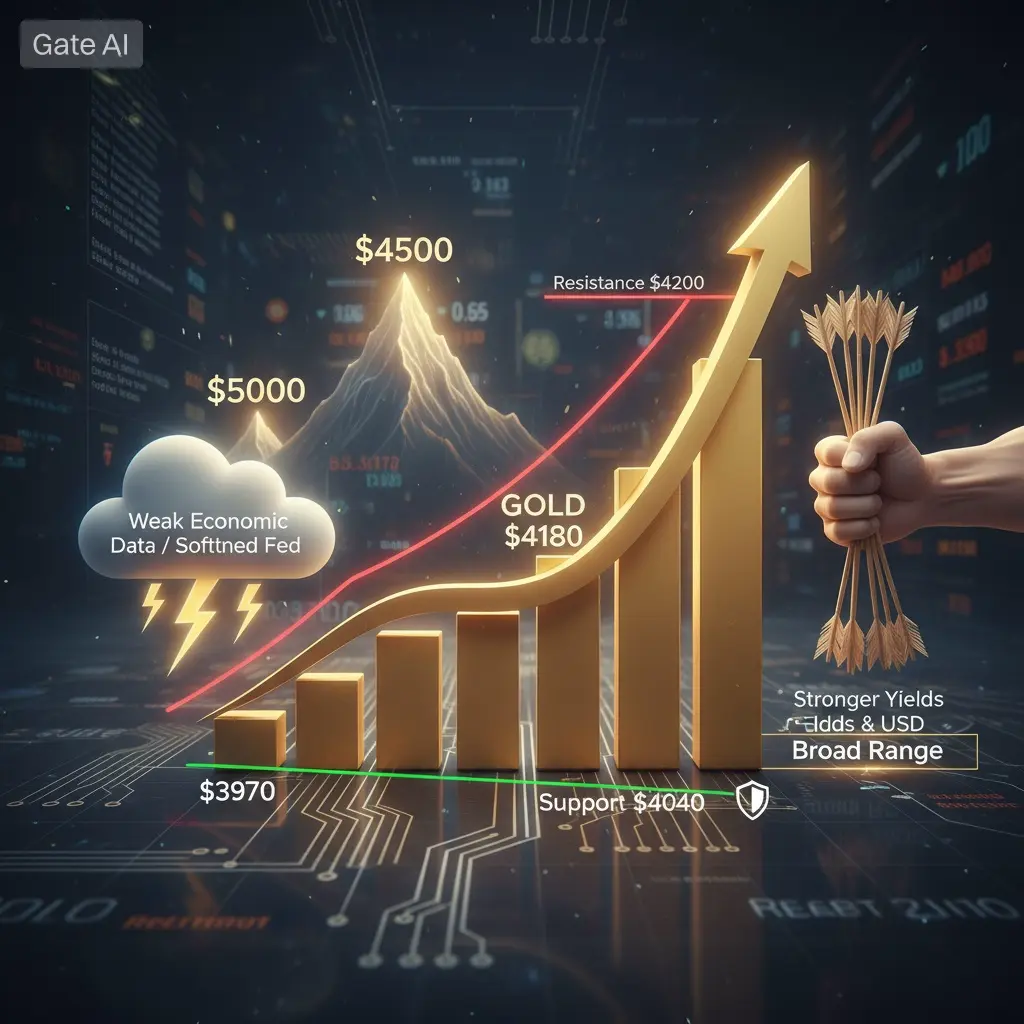
The immediate support levels are positioned at $4,040, $3,990, and $3,900 per ounce. These levels represent potential entry points for bullish traders if the market experiences pullbacks. On the resistance side, key levels include $4,200, $4,260, $4,350, $4,400, and the psychologically important $4,500 threshold.
Moving averages present a mixed picture. The 21-day Simple Moving Average sits at approximately $4,177, which gold has recently reclaimed. However, more significant resistance exists at the 50-day SMA around $4,412 and the 200-day SMA near $4,492. These longer-term moving averages represent substantial overhead supply that bulls must overcome to reestablish a strong uptrend.
Fibonacci retracement analysis from the January high to June low suggests that the $4,200-$4,350 zone represents the 23.6% to 38.2% retracement levels. A sustained move above this zone would target the 50% retracement near $4,771 and potentially the 61.8% level around $5,029, which aligns closely with the $5,000 psychological target.
Institutional Forecasts and Price Targets for 2026-2027
Several major financial institutions have published gold price forecasts that provide insight into professional expectations. JP Morgan anticipates that softer buying from key demand sectors and gold's renewed sensitivity to real yields could keep prices range-bound in the near term. However, they expect a recovery in the second half of 2026, with prices averaging $4,300 per ounce in the third quarter and $4,500 per ounce in the fourth quarter. Their long-term view remains bullish, suggesting gold could extend gains in 2027 as central bank purchases and physical demand strengthen.
State Street Global Advisors presents an even more optimistic scenario in their baseline forecast, projecting gold prices potentially reaching $5,500 per ounce by the first quarter of 2027. Their analysis emphasizes that while tactical headwinds such as high yields, a strong dollar, and Fed rate hike threats persist, structural tailwinds including Asian and central bank demand should drive prices higher.
The World Gold Council's mid-year outlook acknowledges that gold's current price around $4,000-$4,200 is broadly in line with global macroeconomic consensus expectations of moderate growth, cooling but still elevated inflation, and expectations of further but limited central bank tightening. Their analysis suggests that clear catalysts on the upside, including a worsening economy, renewed geopolitical shocks, shifts toward lower interest rate expectations, or waves of dip buying, could reignite gold's momentum and lift prices back toward $4,500 or above.
Traders Union's forecast model projects the average gold price by the end of 2026 to be approximately $4,484, with a minimum expected price of $4,349.48 and maximum of $4,618.52 in December 2026. Their long-term model suggests gold could reach approximately $5,796.23 by the end of 2036.
Will Gold Fall Further or Touch $5,000?
The probability of further declines versus a rally toward $5,000 depends on several key variables. Downside risks remain present as investors await additional U.S. economic data that could reinforce expectations for further Federal Reserve rate hikes. Technical analysts note that if gold loses the $4,280 support zone marking the October 2025 highs, targets of $3,440 become possible, representing approximately 17.70% downside from current levels.
However, several factors support the bullish case. Central bank demand continues to provide structural support for gold prices. The freezing of Russia's foreign exchange reserves in recent years triggered increased demand from central banks seeking assets that cannot be sanctioned, such as physical gold holdings. This structural driver remains intact regardless of short-term price fluctuations.
Seasonal patterns also favor gold in the coming months. Historical data shows gold has a long-standing tendency to firm from early July into early August, a window that has closed higher far more often than not. This seasonal tailwind arrives precisely as the new quarter begins and could provide momentum for further gains.
The recent weak U.S. employment data has already begun shifting market sentiment. Thursday's weaker-than-expected jobs report weighed on the dollar and Treasury yields while supporting short-covering in precious metals. If economic data continues to soften, expectations for Fed rate hikes could diminish, removing a major headwind for gold.
Trading Strategy and Risk Management
For traders considering gold positions at current levels, several strategic approaches merit consideration. A bullish scenario would involve buying from support levels around $3,980-$4,040 with targets at $4,200 and $4,350, using stops below $3,920. This approach capitalizes on the established support zone and potential seasonal strength.
A bearish scenario would involve selling from resistance around $4,200-$4,260 with targets at $3,980, using stops above $4,300. This approach acknowledges the significant overhead resistance from moving averages and the potential for range-bound price action.
Risk management remains crucial given gold's demonstrated volatility. Position sizing should account for the possibility of 5-10% daily moves, which have occurred in 2026. The World Gold Council notes that 2026 may shape up to be one of the most volatile years on record for gold as historical relationships with interest rates and risk are turned on their heads.
What Traders Are Thinking: Market Sentiment Analysis
Current trader sentiment reflects cautious optimism mixed with awareness of downside risks. The Commitment of Traders data and positioning surveys suggest that speculative long positions had been reduced significantly during the decline from $5,600, potentially creating room for renewed buying interest. The recent recovery from below $4,000 has likely triggered short-covering as bears take profits.
Professional traders are closely monitoring the $4,200 level as a key pivot point. A sustained break above this level could trigger algorithmic buying and bring momentum traders back into the market. Conversely, failure to hold above $4,000 could trigger another wave of selling as stop-losses are hit.
The divergence between institutional forecasts and current price action creates interesting dynamics. While major banks maintain long-term bullish outlooks with targets of $5,500-$6,300 by 2027, the near-term price action remains constrained by macroeconomic headwinds. This divergence suggests that patient investors with longer time horizons may find current levels attractive for accumulation, while shorter-term traders should remain nimble and responsive to changing conditions.
Key Levels to Watch
Immediate support: $4,040, $3,990, $3,900
Immediate resistance: $4,200, $4,260, $4,350
Major resistance: $4,400, $4,500, $4,550
Critical psychological level: $5,000
All-time high reference: $5,600
Conclusion
Gold's journey from $3,970 to $4,180 represents a significant recovery, but the market remains at an inflection point. The metal trades in a consolidation phase between $3,900 and $4,300, with technical indicators suggesting a potential inflection point as XAU tests critical support and resistance levels. While near-term headwinds from Fed policy expectations and dollar strength persist, structural drivers including central bank demand and potential seasonal strength support the bullish case.
The probability of reaching $5,000 by year-end depends largely on whether economic data softens sufficiently to shift Fed expectations toward rate cuts rather than hikes. If the economy shows signs of weakness or geopolitical tensions escalate, gold could rally toward $4,500 by Q4 2026 and potentially test $5,000 in 2027. However, if inflation remains persistent and the Fed maintains a hawkish stance, prices could remain range-bound between $3,900 and $4,400 for an extended period.
Traders should remain disciplined, using strict risk management and watching key technical levels for confirmation of the next major move. The volatility of 2026 is likely to continue, creating both opportunities and risks for market participants.@Gate_Square #TradFiCFDGoldMasters
The gold market has experienced one of the most dramatic price movements in recent memory during 2026. After reaching an all-time high of approximately $5,600 per ounce in January 2026, gold prices underwent a severe correction, dropping to as low as $3,942.99 per ounce in late June, representing a decline of approximately 29.59% from the peak. The current price around $4,180 represents a recovery of roughly 6.01% from those June lows, but the metal still trades approximately 25.36% below its January peak.
Understanding the Reasons Behind Gold's Decline from $5,600 to Below $4,000
Multiple interconnected factors contributed to gold's sharp decline from its record highs. The primary driver was the shift in Federal Reserve policy expectations under the new Fed Chair Kevin Warsh. The market had initially anticipated two to three rate cuts in 2026, but by July, the U.S. Overnight Index Swap curve was pricing in approximately 1.5 rate hikes instead. This dramatic reversal in monetary policy expectations caused real yields to rise across the curve, making coupon-bearing assets more attractive relative to non-yielding gold.
The geopolitical situation involving Iran, Israel, and the United States created a complex dynamic. While conflicts typically drive safe-haven demand for gold, the specific unfolding of events in 2026 actually contributed to inflation concerns that strengthened the U.S. dollar. The dollar index caught a strong bid as investors sought safety in U.S. assets, with U.S. money market fund assets reaching a record $7.9 trillion. A stronger dollar typically weighs on gold prices since the metal is denominated in USD.
Higher Treasury yields presented another significant headwind. As yields rose, the opportunity cost of holding gold increased substantially. Gold pays no interest or dividends, so when risk-free rates available in government bonds climb, the relative attractiveness of gold diminishes. The 10-year Treasury yield movements throughout 2026 reflected these shifting expectations.
Additionally, profit-taking after the extraordinary rally of 2025 and early 2026 played a role. Much of the buying beyond macro fundamentals was driven by speculative interest as traders sought to capitalize on the strong bullish trend. When momentum shifted, these speculative positions unwound, accelerating the decline.
Current Market Structure and Technical Analysis at $4,180
Gold's recovery to the $4,180 level represents a technically significant development. The price action has established several critical support and resistance zones that will likely govern near-term trading ranges. From a technical perspective, the $4,000 level has emerged as crucial psychological and structural support. This round number represents more than just sentiment; it aligns with the October 2025 highs and serves as a line in the sand for the 2026 outlook.
The immediate support levels are positioned at $4,040, $3,990, and $3,900 per ounce. These levels represent potential entry points for bullish traders if the market experiences pullbacks. On the resistance side, key levels include $4,200, $4,260, $4,350, $4,400, and the psychologically important $4,500 threshold.
Moving averages present a mixed picture. The 21-day Simple Moving Average sits at approximately $4,177, which gold has recently reclaimed. However, more significant resistance exists at the 50-day SMA around $4,412 and the 200-day SMA near $4,492. These longer-term moving averages represent substantial overhead supply that bulls must overcome to reestablish a strong uptrend.
Fibonacci retracement analysis from the January high to June low suggests that the $4,200-$4,350 zone represents the 23.6% to 38.2% retracement levels. A sustained move above this zone would target the 50% retracement near $4,771 and potentially the 61.8% level around $5,029, which aligns closely with the $5,000 psychological target.
Institutional Forecasts and Price Targets for 2026-2027
Several major financial institutions have published gold price forecasts that provide insight into professional expectations. JP Morgan anticipates that softer buying from key demand sectors and gold's renewed sensitivity to real yields could keep prices range-bound in the near term. However, they expect a recovery in the second half of 2026, with prices averaging $4,300 per ounce in the third quarter and $4,500 per ounce in the fourth quarter. Their long-term view remains bullish, suggesting gold could extend gains in 2027 as central bank purchases and physical demand strengthen.
State Street Global Advisors presents an even more optimistic scenario in their baseline forecast, projecting gold prices potentially reaching $5,500 per ounce by the first quarter of 2027. Their analysis emphasizes that while tactical headwinds such as high yields, a strong dollar, and Fed rate hike threats persist, structural tailwinds including Asian and central bank demand should drive prices higher.
The World Gold Council's mid-year outlook acknowledges that gold's current price around $4,000-$4,200 is broadly in line with global macroeconomic consensus expectations of moderate growth, cooling but still elevated inflation, and expectations of further but limited central bank tightening. Their analysis suggests that clear catalysts on the upside, including a worsening economy, renewed geopolitical shocks, shifts toward lower interest rate expectations, or waves of dip buying, could reignite gold's momentum and lift prices back toward $4,500 or above.
Traders Union's forecast model projects the average gold price by the end of 2026 to be approximately $4,484, with a minimum expected price of $4,349.48 and maximum of $4,618.52 in December 2026. Their long-term model suggests gold could reach approximately $5,796.23 by the end of 2036.
Will Gold Fall Further or Touch $5,000?
The probability of further declines versus a rally toward $5,000 depends on several key variables. Downside risks remain present as investors await additional U.S. economic data that could reinforce expectations for further Federal Reserve rate hikes. Technical analysts note that if gold loses the $4,280 support zone marking the October 2025 highs, targets of $3,440 become possible, representing approximately 17.70% downside from current levels.
However, several factors support the bullish case. Central bank demand continues to provide structural support for gold prices. The freezing of Russia's foreign exchange reserves in recent years triggered increased demand from central banks seeking assets that cannot be sanctioned, such as physical gold holdings. This structural driver remains intact regardless of short-term price fluctuations.
Seasonal patterns also favor gold in the coming months. Historical data shows gold has a long-standing tendency to firm from early July into early August, a window that has closed higher far more often than not. This seasonal tailwind arrives precisely as the new quarter begins and could provide momentum for further gains.
The recent weak U.S. employment data has already begun shifting market sentiment. Thursday's weaker-than-expected jobs report weighed on the dollar and Treasury yields while supporting short-covering in precious metals. If economic data continues to soften, expectations for Fed rate hikes could diminish, removing a major headwind for gold.
Trading Strategy and Risk Management
For traders considering gold positions at current levels, several strategic approaches merit consideration. A bullish scenario would involve buying from support levels around $3,980-$4,040 with targets at $4,200 and $4,350, using stops below $3,920. This approach capitalizes on the established support zone and potential seasonal strength.
A bearish scenario would involve selling from resistance around $4,200-$4,260 with targets at $3,980, using stops above $4,300. This approach acknowledges the significant overhead resistance from moving averages and the potential for range-bound price action.
Risk management remains crucial given gold's demonstrated volatility. Position sizing should account for the possibility of 5-10% daily moves, which have occurred in 2026. The World Gold Council notes that 2026 may shape up to be one of the most volatile years on record for gold as historical relationships with interest rates and risk are turned on their heads.
What Traders Are Thinking: Market Sentiment Analysis
Current trader sentiment reflects cautious optimism mixed with awareness of downside risks. The Commitment of Traders data and positioning surveys suggest that speculative long positions had been reduced significantly during the decline from $5,600, potentially creating room for renewed buying interest. The recent recovery from below $4,000 has likely triggered short-covering as bears take profits.
Professional traders are closely monitoring the $4,200 level as a key pivot point. A sustained break above this level could trigger algorithmic buying and bring momentum traders back into the market. Conversely, failure to hold above $4,000 could trigger another wave of selling as stop-losses are hit.
The divergence between institutional forecasts and current price action creates interesting dynamics. While major banks maintain long-term bullish outlooks with targets of $5,500-$6,300 by 2027, the near-term price action remains constrained by macroeconomic headwinds. This divergence suggests that patient investors with longer time horizons may find current levels attractive for accumulation, while shorter-term traders should remain nimble and responsive to changing conditions.
Key Levels to Watch
Immediate support: $4,040, $3,990, $3,900
Immediate resistance: $4,200, $4,260, $4,350
Major resistance: $4,400, $4,500, $4,550
Critical psychological level: $5,000
All-time high reference: $5,600
Conclusion
Gold's journey from $3,970 to $4,180 represents a significant recovery, but the market remains at an inflection point. The metal trades in a consolidation phase between $3,900 and $4,300, with technical indicators suggesting a potential inflection point as XAU tests critical support and resistance levels. While near-term headwinds from Fed policy expectations and dollar strength persist, structural drivers including central bank demand and potential seasonal strength support the bullish case.
The probability of reaching $5,000 by year-end depends largely on whether economic data softens sufficiently to shift Fed expectations toward rate cuts rather than hikes. If the economy shows signs of weakness or geopolitical tensions escalate, gold could rally toward $4,500 by Q4 2026 and potentially test $5,000 in 2027. However, if inflation remains persistent and the Fed maintains a hawkish stance, prices could remain range-bound between $3,900 and $4,400 for an extended period.
Traders should remain disciplined, using strict risk management and watching key technical levels for confirmation of the next major move. The volatility of 2026 is likely to continue, creating both opportunities and risks for market participants.@Gate_Square #TradFiCFDGoldMasters