Pheonixprincess

vip
Age 1.4 Year
Peak Tier 5
No content yet
#StockTradingChallengeUpTo17000U
Professional Trading Strategies For The Stock Trading Challenge (17000 USDT Capital)
Professional trading is not simply about buying low and selling high. It is a complete system built around discipline, risk management, technical precision, emotional control, and strategic execution. Traders participating in the Stock Trading Challenge with a capital of up to 17000 USDT must understand that long-term survival matters more than short-term excitement. The goal is not to win every trade — the goal is to consistently grow capital while protecting the account from
HighAmbition
#StockTradingChallengeUpTo17000U
Professional Trading Strategies For The Stock Trading Challenge (17000 USDT Capital)
Professional trading is not simply about buying low and selling high. It is a complete system built around discipline, risk management, technical precision, emotional control, and strategic execution. Traders participating in the Stock Trading Challenge with a capital of up to 17000 USDT must understand that long-term survival matters more than short-term excitement. The goal is not to win every trade — the goal is to consistently grow capital while protecting the account from major drawdowns.
This guide explains the most important professional trading strategies used across stocks, cryptocurrencies, forex, and high-volatility markets while maintaining proper portfolio management and controlled risk exposure.
Understanding Risk Management Fundamentals
Risk management is the foundation of every successful trading career. Even the strongest strategy eventually fails without proper capital protection. Professional traders always focus on preserving their account first because protecting capital creates future opportunities.
With a trading balance of 17000 USDT, traders should never risk more than one to two percent on a single trade. This means the maximum acceptable loss per position should stay between 170 and 340 USDT. Limiting downside exposure protects the portfolio from emotional panic and prevents one bad decision from damaging the entire account.
Stop losses are mandatory in professional trading. Every position must include a predefined exit level before entering the trade. Stop losses should be based on technical structures such as support zones, resistance levels, trendlines, moving averages, or previous swing highs and lows instead of random percentages.
Diversification also plays a major role in portfolio stability. A balanced allocation across stocks, crypto, forex, and commodities helps reduce overall market risk. Professional traders never place all capital into one sector because different markets react differently during economic uncertainty.
Another important concept is maintaining a healthy risk-to-reward ratio. Most professional traders target setups offering at least a 1:2 or 1:3 risk-to-reward structure. This means even if only half the trades become successful, the account can still remain profitable over time.
Technical Analysis Strategies For Entry And Exit
Technical analysis helps traders identify momentum, trend direction, liquidity zones, and high-probability entry opportunities. Charts reflect market psychology, fear, greed, and institutional activity.
Moving Average Strategies
Moving averages remain among the most reliable trend indicators. A golden cross appears when a shorter moving average crosses above a longer-term average, signaling bullish momentum expansion. A death cross indicates weakening structure and increasing bearish pressure.
Moving averages also function as dynamic support and resistance levels. During strong trends, price often retraces toward major averages before continuing higher or lower.
Support And Resistance Trading
Support and resistance zones represent areas where buyers or sellers previously dominated the market. Buying near strong support levels and taking profits near resistance improves trade efficiency and reduces unnecessary risk.
Breakouts above resistance with rising volume frequently trigger explosive momentum because trapped short sellers and breakout traders enter simultaneously. Similarly, breakdowns below major support can accelerate heavy selling pressure.
Volume And Momentum Analysis
Volume confirms the strength of market movements. Rising prices with increasing volume usually indicate healthy bullish momentum, while weak volume during rallies often signals temporary price action.
Professional traders also monitor:
Relative volume spikes
Liquidity sweeps
Institutional accumulation
Market imbalance zones
Volatility expansion phases
Large volume surges often appear before major directional movements.
Chart Pattern Strategies
Chart patterns visually represent crowd psychology and market structure.
Popular patterns include:
Head and shoulders reversals
Double tops and bottoms
Bullish and bearish flags
Triangles and pennants
Cup and handle formations
Compression patterns usually lead to strong breakout moves once volatility expands again.
Fundamental Analysis For Stock Selection
Fundamental analysis helps traders identify financially strong companies with long-term growth potential.
Earnings Reports And Financial Strength
Earnings season creates some of the biggest opportunities in stock markets. Companies beating expectations often experience strong bullish momentum, while disappointing reports can trigger heavy declines.
Professional traders monitor:
Revenue growth
Profit margins
Future guidance
Cash reserves
Institutional ownership
Free cash flow
Stocks with strong fundamentals usually recover faster during market corrections.
Valuation Metrics
Price-to-earnings ratios help determine whether a stock appears undervalued or overvalued compared to competitors and historical averages.
Debt analysis is equally important because heavily leveraged companies become vulnerable during economic slowdowns and high interest rate environments.
Market Leadership And Innovation
Companies leading innovation sectors such as artificial intelligence, semiconductors, cloud computing, and blockchain technology often attract long-term institutional investment and stronger market momentum.
Professional traders focus on sectors showing strong future growth rather than only short-term hype.
Cryptocurrency Trading Strategies
Cryptocurrency markets remain among the most volatile and profitable financial sectors globally. However, volatility creates both opportunity and danger.
Trend Following Strategies
Trend following works extremely well in crypto because strong momentum frequently continues longer than expected. Traders identify higher timeframe trends and enter during pullbacks instead of chasing large candles.
Using moving averages, Fibonacci retracement levels, and market structure analysis improves entry precision during trending conditions.
Breakout Trading
Breakout trading captures rapid volatility expansion after consolidation periods. Tight price ranges with declining volatility often lead to aggressive moves once resistance or support finally breaks.
Volume confirmation remains critical because false breakouts occur frequently in crypto markets.
Dollar-Cost Averaging
Dollar-cost averaging reduces emotional stress and timing pressure by spreading entries across multiple price levels over time. This strategy works especially well during bear markets and long-term accumulation phases.
Passive Income Opportunities
Crypto traders can also generate passive income through staking, lending, and yield farming. However, understanding platform security, smart contract risks, and liquidity concerns remains extremely important before allocating capital.
Forex Trading Techniques
Forex markets provide deep liquidity, consistent volatility, and continuous trading opportunities.
Carry Trading
Carry trading profits from interest rate differences between currencies. Traders buy currencies with higher interest rates while selling lower-yielding currencies to earn daily rollover payments.
Range Trading
Many forex pairs spend long periods moving sideways between support and resistance zones. Range traders buy near support and sell near resistance while using oscillators like RSI for confirmation.
Economic News Trading
Major economic releases including inflation reports, interest rate decisions, GDP data, and employment numbers create strong volatility in forex markets.
Professional traders monitor economic calendars daily and avoid emotional trading during unpredictable news events.
Psychological Discipline And Trading Psychology
Trading psychology separates professionals from emotional gamblers.
Fear causes traders to exit profitable positions too early, while greed encourages overtrading, excessive leverage, and emotional decision-making. Successful traders follow systems instead of emotions.
Maintaining a trading journal helps improve discipline and consistency. Recording entries, exits, mistakes, and emotional reactions allows traders to identify weaknesses and refine strategies over time.
One of the biggest mistakes in trading is revenge trading. After losses, emotional traders often force random entries trying to recover quickly, which usually leads to larger drawdowns. Professional traders stay patient and wait for high-quality setups.
Another important habit is avoiding overtrading. Many beginners believe more trades mean more profits, but professionals understand that quality always matters more than quantity.
Position Sizing And Money Management
Money management determines whether a trader survives long term.
Professional traders increase exposure only when market conditions strongly favor their strategy. During uncertainty and high volatility, reducing position sizes protects both capital and psychological stability.
Portfolio heat should always remain controlled. Even if multiple trades fail simultaneously, total account damage must remain manageable.
Pyramiding into winning positions can maximize profits during strong trends, but averaging into losing trades increases emotional pressure and portfolio risk dramatically.
Successful trading with 17000 USDT requires patience, discipline, technical knowledge, and emotional control. Risk management always comes before profit because protecting capital creates long-term survival in financial markets.
Combining technical analysis, fundamental research, psychological discipline, and smart money management creates the strongest foundation for sustainable profitability. Traders who stay consistent, avoid emotional mistakes, and continuously improve their strategies place themselves in the best position for long-term success.
Trading is not a shortcut to instant wealth. It is a professional skill developed through education, experience, discipline, and controlled execution. The traders who survive market volatility with patience and structure are ultimately the ones who achieve lasting success.@Gate_Square @Gate广场_Official
repost-content-media
  • Reward
  • 1
  • Repost
  • Share
HighAmbition:
thnxx for the update
#USLaunchesNewStrikesOnIranOilRebounds
US–Iran Crisis Update: Oil, Gold, Bitcoin and Ethereum React to Fresh Escalation
The geopolitical situation between the United States and Iran has intensified further after a new wave of US airstrikes targeting Iranian-linked facilities, deepening uncertainty across global financial markets. President Trump’s recent comments expressing dissatisfaction with the proposed diplomatic draft have reinforced expectations that negotiations remain stalled, while geopolitical risk continues to rise across the Middle East. Markets are now fully positioned in a risk
BTC-0.14%
ETH0.2%
CL-1.4%
HighAmbition
#USLaunchesNewStrikesOnIranOilRebounds
US–Iran Crisis Update: Oil, Gold, Bitcoin and Ethereum React to Fresh Escalation
The geopolitical situation between the United States and Iran has intensified further after a new wave of US airstrikes targeting Iranian-linked facilities, deepening uncertainty across global financial markets. President Trump’s recent comments expressing dissatisfaction with the proposed diplomatic draft have reinforced expectations that negotiations remain stalled, while geopolitical risk continues to rise across the Middle East. Markets are now fully positioned in a risk-off environment where energy security, inflation expectations, and global liquidity conditions are driving sharp repricing across major asset classes.
Oil Market Update: Sharp Surge on Supply Risk Fears
Crude oil has reacted aggressively to the escalation, with traders rapidly pricing in potential disruptions in Middle Eastern supply routes.
WTI Crude Oil: approximately $93 – $95 range
Brent Crude Oil: approximately $96 – $98+ range
The primary driver remains the strategic importance of the Strait of Hormuz, through which nearly 20% of global oil supply flows daily.
Even the risk of instability in this region is enough to push energy markets higher as traders factor in potential shipping delays, insurance cost increases, and supply chain disruption risks.
Key Market Concerns:
Possible disruption in global oil transportation routes
Rising shipping and freight costs
Inflation pressure returning to global economy
Reduced expectations of central bank easing
If tensions continue escalating, oil markets could remain highly volatile, with psychological resistance near $100 per barrel now acting as a key macro threshold.
Gold Market Update: Strong Safe-Haven Demand
Gold has strengthened significantly as investors move capital into defensive assets amid rising geopolitical uncertainty.
Gold (XAU/USD): approximately $4,350 – $4,450 range
The rally reflects increasing demand from institutional investors, sovereign funds, and long-term hedging strategies as global uncertainty intensifies.
Key Drivers:
Escalating geopolitical risk in Middle East
Inflation protection demand due to rising oil
Weakening risk appetite in global markets
Uncertainty in monetary policy outlook
Gold continues to act as a primary hedge asset in the current environment, with strong support emerging as long as geopolitical tensions remain elevated.
Bitcoin Market Update: Volatility and Liquidity Pressure
Bitcoin has entered a highly volatile phase as macro uncertainty and leveraged positioning trigger sharp price fluctuations across crypto markets.
Bitcoin (BTC): approximately $72,500 – $74,500 range
The market has seen increased liquidation activity as leveraged long positions were unwound following geopolitical headlines, creating short-term downward pressure.
Key Factors Driving BTC Movement:
Rising global risk aversion
High leverage in derivatives markets
Liquidity thinning across exchanges
Strong correlation with macro assets (oil, yields, equities)
BTC Key Levels:
Major support: $71,000 – $72,500
Recovery zone: $76,000 – $78,000
Breakout level: $80,000+
Despite volatility, Bitcoin continues to attract dip-buying interest near key support zones, showing relative resilience compared to smaller altcoins.
Ethereum Market Update: Pressure Under Broader Crypto Weakness
Ethereum has also faced downside pressure as liquidity conditions tighten and risk sentiment weakens across the crypto ecosystem.
Ethereum (ETH): approximately $1,950 – $2,050 range
ETH remains more sensitive to liquidity cycles due to its deep integration in DeFi, staking systems, and broader blockchain infrastructure activity.
Key ETH Levels:
Support zone: $1,900 – $2,000
Recovery zone: $2,150 – $2,300
Downside risk: below $1,900 if escalation intensifies
Ethereum’s performance continues to reflect broader macro conditions rather than isolated crypto-specific catalysts.
Global financial markets are now operating in a highly reactive geopolitical environment where oil, gold, Bitcoin, and Ethereum are all responding directly to shifts in Middle East tensions and inflation expectations.
Oil remains strongly supported near $93–$98 with upside risk toward $100+
Gold continues to attract safe-haven inflows around $4,350–$4,450
Bitcoin is consolidating in a volatile range near $72K–$75K
Ethereum remains under pressure near $2,000
The next major direction across global markets will depend entirely on whether diplomatic channels reopen or whether geopolitical tensions continue to escalate further. Until stability returns, volatility is expected to remain elevated across all major asset classes, with rapid price swings likely driven by news flow and macro sentiment shifts.@Gate_Square @Gate广场_Official
repost-content-media
  • Reward
  • 1
  • Repost
  • Share
HighAmbition:
good 👍👍👍 good
#TradeCFDWinGold
The TradeCFDWinGold campaign is a large-scale promotional and trading incentive system built around Gate.io’s TradFi CFD platform, designed to merge speculative trading with real-world gold-based rewards. Instead of being a simple trading bonus program, it operates as a multi-layer ecosystem where user engagement, trading volume, timing, and participation consistency all interact to determine eligibility for rewards. The entire structure is designed to continuously attract liquidity into CFD markets while simultaneously rewarding traders with both USDT incentives and gold-bac
HighAmbition
#TradeCFDWinGold
The TradeCFDWinGold campaign is a large-scale promotional and trading incentive system built around Gate.io’s TradFi CFD platform, designed to merge speculative trading with real-world gold-based rewards. Instead of being a simple trading bonus program, it operates as a multi-layer ecosystem where user engagement, trading volume, timing, and participation consistency all interact to determine eligibility for rewards. The entire structure is designed to continuously attract liquidity into CFD markets while simultaneously rewarding traders with both USDT incentives and gold-backed assets in the form of XAUT. This combination of traditional financial instruments and crypto settlement creates a hybrid environment where users are encouraged to actively trade global markets such as gold, oil, indices, and forex under a unified incentive system.
Understanding CFD Trading in the Gate.io TradFi Environment
CFD trading on Gate.io TradFi is fundamentally based on price speculation rather than asset ownership, meaning traders do not hold physical commodities or indices but instead take positions based on expected price movement. In this system, assets like gold (XAU/USD), silver (XAG/USD), crude oil (XTI/USD and XBR/USD), and major indices like NAS100 are all available for leveraged trading. Traders can open long positions when expecting upward movement or short positions when anticipating a decline, and profits or losses are determined by the difference between entry and exit prices. The platform allows high leverage, in some cases reaching up to 500x depending on conditions, which significantly amplifies both potential returns and risks. Because CFD trading operates on margin, even small market movements can lead to large profit swings or rapid liquidation, making risk control a central part of participation.
Gold Lucky Bag Phase 5 – Continuous Gold Reward Mechanism
One of the most notable campaigns within the TradeCFDWinGold ecosystem is the Gold Lucky Bag Phase 5 event, which introduces a continuous reward system based on frequent time-based draws. Running over a defined promotional period, this campaign distributes small amounts of gold every ten minutes, creating a constant cycle of participation and anticipation among traders. Each draw cycle produces a fixed number of winners, with one participant receiving a larger gold reward while several others receive smaller fractional allocations, all paid in XAUT, which represents tokenized gold backed by physical reserves.
To become eligible for participation, users are required to execute at least one qualifying CFD trade with a minimum threshold value before the draw window. Once qualified, the system automatically enters users into multiple consecutive draw rounds, ensuring continued eligibility without repeated manual action. This structure is designed to encourage active trading behavior within specific time windows, linking trading activity directly to reward opportunities. However, rewards are not automatically credited and require manual claiming within a strict time limit, adding an additional layer of engagement and urgency to the process.
TradFi CFD Popular Assets Trading Contest – Volume Driven Competition System
Another major component of the campaign ecosystem is the TradFi CFD Popular Assets Trading Contest, which focuses on competition based purely on trading volume across selected high-interest markets such as gold, silver, and oil. This event is structured around the idea that increased trading activity benefits liquidity and market depth, so rewards are scaled based on user participation intensity. Traders are encouraged to execute higher cumulative volumes to unlock progressively larger reward tiers, ranging from modest USDT vouchers for entry-level participation to significantly larger payouts for high-volume traders.
In addition to volume-based rewards, the contest also includes entry incentives for first-time traders who execute qualifying trades above a certain minimum threshold. These incentives are designed to attract new users into CFD trading by lowering the psychological barrier to entry, while simultaneously rewarding early engagement. The overall system is highly competitive, as users are indirectly competing against each other for a share of fixed reward pools, making trading behavior more aggressive and frequent during event periods.
Account Activation and Trading Incentive Structure
The account activation phase of the campaign is designed specifically to onboard new users into the TradFi CFD ecosystem by providing immediate small-scale rewards and gradually increasing incentives based on trading activity. Once a user enables CFD trading for the first time, they become eligible for initial activation rewards, which are typically distributed in small fractions of XAUT. As users begin trading and reach cumulative volume milestones, they unlock additional reward tiers that scale proportionally with their activity level.
This structure creates a progressive engagement model where users are continuously encouraged to increase trading volume in order to reach higher reward brackets. The system also includes shared reward pools, where multiple participants compete for a fixed allocation based on their percentage contribution to total trading volume. This introduces a competitive element that naturally incentivizes higher participation rates and sustained trading activity over time.
CFD Return Season – Re-Engagement and Retention Strategy
The CFD Return Season campaign is specifically designed to reactivate previously active traders who have been inactive for a certain period. Instead of focusing on new user acquisition, this phase targets experienced participants by offering a combination of trading bonuses, loss protection mechanisms, and volume-based competition rewards. Returning users are encouraged to resume trading activity through guaranteed incentives for achieving minimum volume thresholds, along with partial loss compensation on initial trades, which helps reduce psychological barriers associated with re-entry into volatile markets.
The structure also includes a large-scale prize pool distributed across multiple trading tiers, ensuring that both small and large traders have opportunities to benefit depending on their level of engagement. By combining risk mitigation features with competitive rewards, this phase effectively reactivates dormant users while increasing overall platform trading volume.
How CFD Trading is Executed on Gate.io TradFi Platform
The execution process for CFD trading on Gate.io is structured to be straightforward but operationally precise, beginning with account activation and fund transfer from a spot wallet into the TradFi trading environment. Once funds are allocated, users select their preferred trading instrument such as gold, oil, or indices, and decide on market direction based on their analysis or strategy. Orders are executed instantly, and positions are managed in real time according to market fluctuations.
The trading volume is calculated as a combination of both buy and sell activity, meaning that frequent position changes contribute to overall participation metrics used for reward eligibility. This design encourages continuous trading rather than single large positions, aligning user behavior with platform liquidity goals.
Eligibility Rules, Restrictions, and Trading Limitations
Participation in these campaigns is subject to several eligibility restrictions that exclude certain types of accounts, including institutional traders, market makers, high-tier VIP accounts, and API-based trading systems. These exclusions are intended to maintain fairness and prevent automated or large-scale institutional strategies from dominating reward pools. Additionally, trading availability is restricted during specific weekly downtime periods when markets are closed, which typically occur over the weekend in UTC time.
Certain regions are also excluded from participation due to regulatory constraints, and users are required to comply with identity verification procedures before accessing CFD trading features. These conditions ensure that the campaign operates within platform compliance frameworks while maintaining controlled participation.
Risk Exposure and Market Volatility Considerations
CFD trading inherently carries significant financial risk due to the use of leverage and exposure to highly volatile global markets. Price movements in assets like gold, oil, and indices can be influenced by macroeconomic events, geopolitical tensions, and sudden liquidity shifts, all of which can result in rapid profit or loss scenarios. High leverage amplifies this effect, meaning even small market fluctuations can lead to liquidation if margin requirements are not properly maintained.
It is also important to understand that XAUT, while backed by gold reserves, is still a tokenized representation rather than physical ownership of gold. This introduces both market and liquidity considerations that differ from traditional commodity ownership. As a result, participants must approach CFD trading with structured risk management strategies, controlled exposure, and a clear understanding of margin dynamics.
Final Overview and Strategic Insight
Overall, the TradeCFDWinGold campaign represents a sophisticated hybrid ecosystem that merges speculative CFD trading with incentive-driven reward mechanisms centered around gold and USDT distributions. It is structured to continuously stimulate trading activity through layered campaigns including lucky draws, volume competitions, onboarding rewards, and reactivation incentives. Each component of the system is interconnected, ensuring that users remain engaged across different stages of their trading journey.
At its core, the system is not only about trading profits but also about participation intensity, timing efficiency, and sustained engagement within volatile global markets. While it offers attractive reward opportunities, it simultaneously demands disciplined risk control and strategic execution due to the highly leveraged nature of CFD instruments.@Gate_Square @Gate广场_Official
repost-content-media
  • Reward
  • 1
  • Repost
  • Share
HighAmbition:
good 👍👍 good
#USIranNegotiationGame
Crude Oil at $90 and the New Era of Geopolitical Pricing
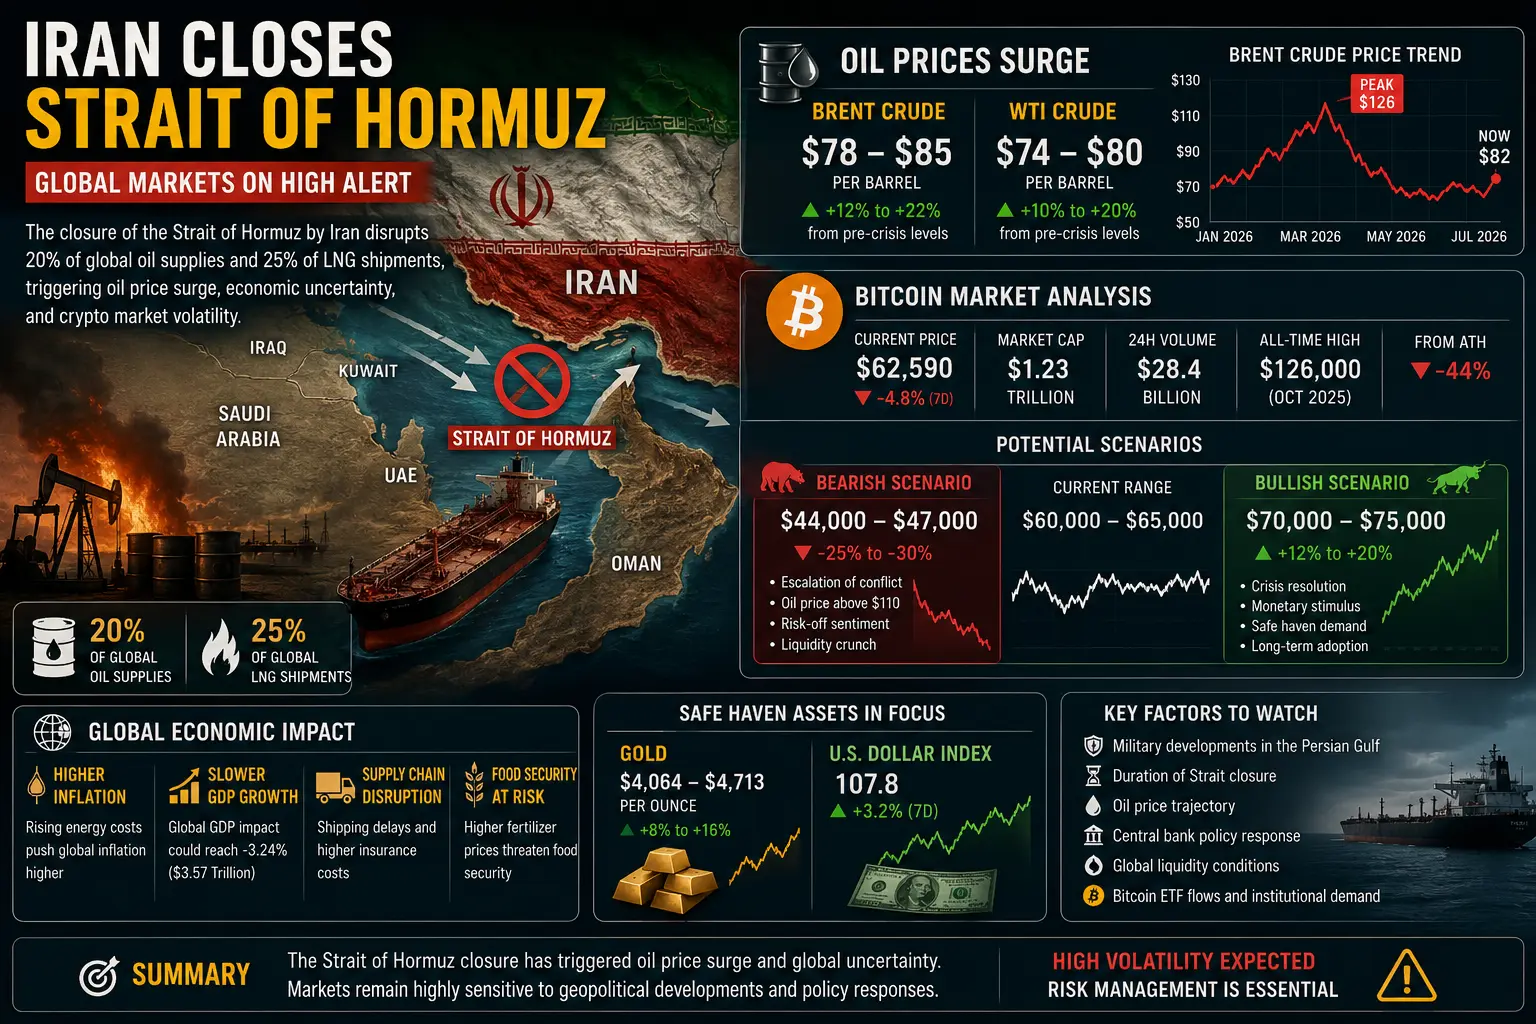
Global financial markets in May 2026 are completely dominated by the escalating US–Iran geopolitical conflict, which has now evolved into a complex negotiation game shaping every major asset class across the world. What was once a regional political dispute has transformed into a full-scale macroeconomic driver influencing oil, gold, Bitcoin, equities, inflation expectations, and central bank policy decisions simultaneously. At the center of this entire global financial structure is crude oil trading near $90 per
BTC-0.11%
HighAmbition
#USIranNegotiationGame
Crude Oil at $90 and the New Era of Geopolitical Pricing
Global financial markets in May 2026 are completely dominated by the escalating US–Iran geopolitical conflict, which has now evolved into a complex negotiation game shaping every major asset class across the world. What was once a regional political dispute has transformed into a full-scale macroeconomic driver influencing oil, gold, Bitcoin, equities, inflation expectations, and central bank policy decisions simultaneously. At the center of this entire global financial structure is crude oil trading near $90 per barrel, a level that has become the most important psychological and structural anchor for global risk sentiment. This price is not just reflecting supply and demand anymore, but a deep geopolitical risk premium that is continuously being repriced based on every diplomatic headline, military update, and negotiation rumor emerging from the US–Iran conflict zone. Brent crude has been fluctuating in the $92–$99 range, while WTI remains around $88–$91, with previous spikes reaching above $110–$126 during peak escalation phases, showing how extreme the volatility cycle has become.
The reason oil is so sensitive right now is the Strait of Hormuz, which remains the most critical energy chokepoint in the world, handling nearly 20% of global oil flows and a significant portion of LNG shipments. Any disruption or even perceived threat to this narrow waterway instantly triggers global panic in energy markets because it directly affects physical supply chains. During earlier phases of the conflict, tanker movement dropped significantly, and although some shipments have resumed, the market is still operating under fear-based logistics rather than normal trade flow conditions. This structural uncertainty is the main reason why oil remains elevated even during temporary ceasefire optimism, because traders are continuously pricing in the probability of sudden escalation or renewed disruption.
Oil pricing behavior has now shifted into a pure event-driven system where traditional supply-demand fundamentals play a secondary role compared to geopolitical headlines. When diplomatic progress is reported, oil instantly drops by 3–6% as risk premium unwinds, but when military escalation or negotiation breakdowns occur, oil spikes aggressively by 2–5% within hours. This constant volatility cycle has created a trading range where WTI oscillates between $88 and $105, while Brent moves between $92 and $126, making oil one of the most unpredictable macro assets in the global system right now. At $90, oil is essentially balancing between two extreme scenarios: one where diplomacy stabilizes global supply chains, and another where conflict escalates and triggers full-scale energy disruption.
The macroeconomic impact of oil at this level is extremely significant because it acts as a global inflation transmission mechanism. Higher oil prices directly increase transportation costs, logistics expenses, food prices, airline fares, industrial production costs, and overall consumer inflation pressure across all major economies. This creates a situation where central banks, especially the Federal Reserve, are unable to aggressively cut interest rates even if economic growth weakens, because inflation risks remain persistent due to energy costs. As a result, global monetary policy has entered a restrictive phase where high interest rates are being maintained longer than expected, simply because oil near $90 keeps inflation expectations sticky and unstable.
In parallel, gold has strengthened significantly as a safe-haven asset, trading around the $4,400–$4,500 range, with previous conflict-driven peaks above $5,500–$5,600 during maximum uncertainty phases. However, gold is currently caught in a dual-pressure environment where geopolitical risk supports higher prices, but rising Treasury yields and a stronger US dollar create downward pressure. This makes gold’s movement highly sensitive to macro signals, especially inflation expectations and real yield trends, which often offset pure safe-haven demand.
Bitcoin and the broader cryptocurrency market have also entered a highly volatile macro-sensitive phase. Bitcoin is currently trading around $73,000–$75,000, after previously hitting highs above $82,000 during relief rallies and dropping near $62,500 during initial conflict shocks. The crypto market is no longer decoupled from traditional financial systems and is now heavily influenced by global liquidity cycles, ETF inflows and outflows, Treasury yield movements, and geopolitical risk sentiment. One of the most important recent developments has been large-scale ETF outflows exceeding $700 million in single sessions, which has significantly reduced buying pressure and increased downside volatility. At the same time, leveraged positions in derivatives markets continue to amplify price swings, making Bitcoin extremely sensitive to sudden macro shocks.
Equity markets globally are under consistent pressure due to rising energy costs, inflation uncertainty, and tightening liquidity conditions. Technology and growth stocks are particularly vulnerable because higher interest rates reduce the present value of future earnings, while energy stocks tend to outperform due to rising oil prices. Bond markets are also reflecting this environment, with Treasury yields increasing to around 4.5%+ levels, further tightening financial conditions and strengthening the US dollar, which adds additional pressure on risk assets including crypto and emerging markets.
Overall market psychology has shifted into a defensive and fear-driven regime where investors prioritize capital preservation over aggressive risk-taking. Trading behavior is now highly reactive, with rapid repositioning occurring after every geopolitical headline. Markets are no longer trend-driven but event-driven, meaning that single news events can trigger multi-billion-dollar moves across oil, gold, Bitcoin, and equities within minutes.
The correlation structure between assets has also become very clear in this environment. When diplomatic progress is reported, oil falls sharply, Bitcoin and equities rise, and gold stabilizes or weakens slightly depending on dollar movement. When tensions escalate, oil spikes immediately, Bitcoin drops due to risk-off sentiment, equities weaken, and gold reacts in a mixed manner depending on whether dollar strength or safe-haven demand dominates. This interconnection has made global markets extremely synchronized with geopolitical developments.
Looking forward, the entire financial system is now dependent on the outcome of the US–Iran negotiation cycle. If diplomacy succeeds and the Strait of Hormuz stabilizes, oil could retreat below $85, inflation pressure could ease, and risk assets like Bitcoin and equities could recover strongly. However, if negotiations fail and escalation continues, oil could break above $100–$110 again, inflation could accelerate globally, and markets could enter a prolonged phase of high volatility and risk-off sentiment. Until a clear resolution emerges, crude oil near $90 will remain the central pillar of global financial uncertainty, continuously shaping the direction of every major asset class in real time.@Gate_Square @Gate广场_Official
repost-content-media
  • Reward
  • 1
  • Repost
  • Share
HighAmbition:
2026 GOGOGO 👊
#CBOEIntroducesExtendedTradingForStockOptions
CBOE Introduces Extended Trading For Stock Options
The decision by CBOE to introduce extended trading hours for stock options represents one of the biggest structural shifts in the U.S. derivatives market in recent years. While many retail traders may initially view this as simply “longer trading hours,” the reality is much broader. This move reflects the transformation of financial markets toward a nearly continuous global trading environment where hedge funds, institutions, algorithmic traders, and international participants increasingly demand
HighAmbition
#CBOEIntroducesExtendedTradingForStockOptions
CBOE Introduces Extended Trading For Stock Options
The decision by CBOE to introduce extended trading hours for stock options represents one of the biggest structural shifts in the U.S. derivatives market in recent years. While many retail traders may initially view this as simply “longer trading hours,” the reality is much broader. This move reflects the transformation of financial markets toward a nearly continuous global trading environment where hedge funds, institutions, algorithmic traders, and international participants increasingly demand access beyond traditional Wall Street hours.
Modern financial markets no longer move only during standard New York sessions. Central bank announcements, geopolitical developments, earnings surprises, energy shocks, and overnight futures volatility frequently occur while U.S. equity markets are closed. Because of this, exchanges have faced growing pressure to provide more flexibility and faster reaction mechanisms outside normal hours.
CBOE’s expansion into extended options trading is therefore not just a scheduling change. It represents a wider shift toward continuous risk management and globally connected market participation.
SEC Approval and Official Launch Structure
The expansion of extended trading hours became possible after SEC approval allowing CBOE to broaden trading access for selected stock options products. The launch is intentionally measured rather than aggressive.
Regulators prefer a gradual rollout because options markets are far more complex than ordinary stock trading. Options pricing depends on implied volatility, liquidity depth, spreads, gamma exposure, and institutional hedging activity. Extending trading hours therefore requires stable execution quality and proper market-maker participation.
Initially, the rollout is expected to focus on around twenty highly liquid securities and ETFs. These products were chosen because they already maintain strong institutional liquidity, deep options volume, and reliable price discovery.
The early list will likely center around mega-cap technology names, major ETFs, and heavily traded institutional products that dominate overall options activity.
This careful rollout allows exchanges and regulators to monitor liquidity behavior before expanding further.
What Extended Trading Hours Actually Mean
Traditionally, U.S. stock options trading has operated mainly during standard market hours tied to the New York session. Under the expanded structure, traders gain additional access before and after the normal trading window.
This means traders no longer need to wait until the next opening bell to react to major overnight developments.
Instead, participants can:
Adjust positions earlier
Hedge exposure faster
Respond to breaking news more efficiently
Manage overnight risk more actively
This changes market reaction speed significantly.
For example:
Earnings reports are often released after market close
Geopolitical headlines emerge overnight
European or Asian economic data can move futures before U.S. markets open
Commodity price spikes may instantly affect sector sentiment
Previously, options traders had limited flexibility during these periods. Extended hours now create a more responsive trading environment.
Why the 7:30 A.M. Pre-Market Session Is Important
One of the most important features is the pre-market session beginning around 7:30 a.m. Eastern Time.
This matters because it overlaps more directly with European market activity and major U.S. economic releases.
Important reports such as:
CPI inflation
Nonfarm payrolls
GDP data
Retail sales
Federal Reserve commentary
are frequently released before the normal market open.
Previously, futures markets reacted immediately while options traders had limited flexibility. Under the new structure, traders can react earlier through options positioning before the official opening bell.
Major benefits include:
Faster volatility pricing
Earlier directional trades
Better hedge management
Reduced overnight gap exposure
More efficient institutional execution
For professional traders, even limited additional positioning time can significantly affect profitability and risk control.
Why the Post-Market Curb Session Matters
The post-market “Curb” session may become even more important than the pre-market expansion itself.
After-hours corporate announcements are now extremely common. Earnings reports, mergers, guidance revisions, and regulatory news frequently arrive after the closing bell.
Without extended options trading, traders often remained exposed overnight without the ability to hedge properly.
The post-market session changes this dynamic.
One of the biggest institutional advantages involves reducing contra-exercise risk.
Contra-exercise risk happens when traders cannot respond properly to after-hours price moves affecting option contracts before exercise decisions are finalized.
With post-market adjustments available, institutions gain:
Better assignment control
Faster delta hedging
Reduced overnight uncertainty
Improved portfolio balancing
This is especially important for firms managing large derivatives exposure.
Eligibility Criteria and Why Only Certain Stocks Qualify
Not every stock will immediately qualify for extended options trading.
The exchange is expected to prioritize:
Highly liquid securities
Tight-spread products
Large institutional participation
Strong market-maker support
Heavy options volume
This selective approach helps maintain orderly trading conditions.
Smaller-cap stocks with weak liquidity could experience unstable pricing during overnight sessions. Wider spreads and low participation may create inefficient execution conditions.
By focusing first on around twenty highly active products, the exchange creates a safer testing environment before expanding toward additional names.
Direct Benefits for Day Traders and Active Participants
Active traders could benefit substantially from extended options access.
Previously, overnight news often created situations where traders could not manage exposure until the next morning. This resulted in:
Large opening gaps
Increased slippage
Missed volatility opportunities
Difficult overnight risk management
Extended sessions now provide greater flexibility.
Day traders can:
React faster to breaking news
Adjust hedges earlier
Trade overnight momentum
Position ahead of economic releases
Manage earnings volatility more efficiently
This may especially benefit short-term volatility traders.
International Traders Gain Major Advantages
One of the largest long-term impacts involves international participation.
Global investors across Europe and Asia historically faced timing disadvantages when trading U.S. options markets because standard U.S. hours overlap poorly with many international sessions.
Extended trading improves access significantly.
For example:
European traders gain more overlap with U.S. markets
Asian institutions can react more directly to overnight developments
International hedge funds gain faster hedging opportunities
Cross-market arbitrage becomes more efficient
This matters because U.S. equity derivatives increasingly function as global macro instruments rather than purely domestic products.
Institutional Hedging and Risk Management Evolution
Institutional firms may become the biggest beneficiaries of extended trading hours.
Modern portfolio management requires constant monitoring across:
Equities
Bonds
Commodities
Forex
Futures
Crypto markets
Risk never fully stops moving.
Extended options access allows institutions to maintain more continuous hedging structures rather than relying mainly on futures markets overnight.
This improves:
Volatility management
Portfolio rebalancing
Event-driven positioning
Tail-risk protection
Cross-asset hedging efficiency
Large firms increasingly demand around-the-clock market access because macro volatility now operates globally.
Earnings Season Could Change Dramatically
Earnings season trading behavior may evolve significantly under this framework.
Currently, many earnings reactions occur through:
After-hours stock trading
Futures market movement
Next-day volatility repricing
Extended options trading introduces earlier overnight price discovery immediately after reports are released.
This could lead to:
Faster implied volatility adjustment
More overnight speculation
Earlier options repricing
Increased gamma activity
More active institutional hedging
In the long run, overnight earnings trading could become an important liquidity segment on its own.
Risks and Practical Considerations
Despite the advantages, extended trading hours also introduce important risks.
Liquidity during overnight sessions will likely remain thinner than regular market hours initially.
This can create:
Wider bid-ask spreads
Higher execution costs
Increased volatility spikes
Reduced order depth
Greater slippage risk
Retail traders especially must understand that overnight conditions may behave very differently from daytime trading.
Algorithmic trading firms and professional market makers may dominate these sessions early because they possess stronger infrastructure and execution systems.
Therefore, while opportunities increase, execution discipline becomes even more important.
The Long-Term Vision: Toward Near-24-Hour Options Markets
The broader industry trend clearly points toward longer market accessibility over time.
Financial markets increasingly resemble a globally connected continuous system rather than isolated national sessions.
Several factors are accelerating this shift:
Global investing growth
Algorithmic trading expansion
International hedge fund activity
24-hour crypto market influence
Continuous macro news flow
CBOE’s expansion may therefore represent only the beginning of a larger transformation.
Over time, highly liquid U.S. options products could eventually move closer toward near-24-hour accessibility similar to futures and cryptocurrency markets.
Final Market Perspective
CBOE’s introduction of extended trading for stock options is not merely a technical exchange update. It represents a structural evolution in how modern financial markets function.
Global markets now react continuously to inflation shocks, geopolitical tensions, central bank decisions, commodity volatility, and corporate news. Traders and institutions increasingly require tools that allow them to manage exposure in real time rather than waiting for traditional opening bells.
The expansion of pre-market and post-market options access improves flexibility, strengthens institutional hedging, enhances international participation, and moves the derivatives industry closer toward continuous global trading infrastructure.
At the same time, traders must recognize that extended sessions introduce new complexities involving liquidity, spreads, volatility behavior, and execution quality.
The overall direction, however, appears increasingly clear: Global financial markets are gradually moving toward a future where trading and risk management operate almost continuously across all major asset classes.@Gate_Square @Gate广场_Official
repost-content-media
  • Reward
  • 1
  • Repost
  • Share
HighAmbition:
good information 👍👍
Gate Square | 5/29 Hot Topics: #WTI原油失守90美元 #WTICrudeFallsBelow90Dollars
WTI Crude Oil Prices Have Recently Fallen Below the $90 per Barrel Mark
WTI crude oil prices have experienced a notable decline in late May 2026, trading around $91.49 per barrel as of May 27, while Brent crude stands near $97.10 per barrel. This pullback from earlier highs near $95–$100 reflects a complex mix of easing geopolitical risks, persistent high interest rates, and shifting supply-demand dynamics. The market is balancing short-term diplomatic progress against longer-term economic pressures.
Current State of US-
CL-1.4%
HighAmbition
Gate Square | 5/29 Hot Topics: #WTI原油失守90美元 #WTICrudeFallsBelow90Dollars
WTI Crude Oil Prices Have Recently Fallen Below the $90 per Barrel Mark
WTI crude oil prices have experienced a notable decline in late May 2026, trading around $91.49 per barrel as of May 27, while Brent crude stands near $97.10 per barrel. This pullback from earlier highs near $95–$100 reflects a complex mix of easing geopolitical risks, persistent high interest rates, and shifting supply-demand dynamics. The market is balancing short-term diplomatic progress against longer-term economic pressures.
Current State of US-Iran Negotiations and Middle East Outlook
The US-Iran situation remains the dominant short-term driver. On May 28, 2026, both sides extended a temporary 60-day ceasefire and discussed partial normalization of shipping through the Strait of Hormuz, which handles nearly one-fifth of global oil shipments.
Pakistan’s military leadership, including General Asim Munir, played a role in backchannel mediation.
However, deep disagreements persist. President Trump has demanded that Iran transfer its enriched uranium stockpile to the United States or dismantle key nuclear infrastructure. Iran insists its nuclear program is a sovereign matter not covered by the current talks. Israel has strongly opposed the framework, with officials threatening escalated operations in Lebanon and Syria if their security concerns are ignored.
If a broader agreement is reached and the Strait of Hormuz fully normalizes, additional Iranian oil could return to markets, potentially pushing WTI crude toward $85–$88 per barrel and Brent toward $90–$94. Conversely, if talks collapse or regional conflict intensifies, WTI could surge back above $100 per barrel, with Brent testing $105–$110. This uncertainty keeps the market highly headline-driven.
Short-Term Oil Price Trajectory: Further Decline or Stabilization?
Oil prices face opposing forces: demand weakness from high interest rates versus supply support from tight inventories and OPEC+ discipline.
High Interest Rates and Their Impact on Oil Demand
Elevated interest rates continue to suppress global oil demand. The Federal Reserve, ECB, and Bank of England have maintained restrictive policies, with the 30-year US Treasury yield climbing to 5.18% in May 2026 — among the highest levels since 2007. Higher borrowing costs slow manufacturing, construction, transportation, and consumer spending, directly reducing oil consumption.
The OECD cut its 2026 global growth forecast from 3.3% to 2.9%. China’s property sector struggles and Europe’s weak industrial output have already lowered oil import forecasts. Earlier 2026 price spikes above $100 per barrel themselves triggered some demand destruction as costs rose for aviation, logistics, and industry. A stronger US dollar further pressures emerging market buyers.
These factors create downside risks for prices even if supply remains constrained.
OPEC+ Strategy, Supply, and Inventories
On the supply side, Saudi Arabia and Russia have maintained production discipline. Voluntary cuts have kept global supply tighter than expected, with the IEA reporting output falling to around 95.1 million barrels per day in April 2026. US crude and gasoline inventories have declined steadily, staying below seasonal averages, while strategic reserves remain historically low.
This tight physical market prevents a sharp collapse despite weaker demand signals. Asian refining margins also remain healthy, supporting steady crude demand.
Personal Analysis and Outlook
In my view, the oil market is trapped in a volatile range. High interest rates and slower growth (especially in China and Europe) cap upside potential, while low inventories and geopolitical risks provide a floor. WTI is likely to fluctuate between $85 and $100 per barrel in the coming weeks, with Brent moving between $90 and $110.
Diplomatic progress on US-Iran talks could drive prices toward the lower end ($85–$88 for WTI), easing inflation concerns. But any escalation or failed negotiations would quickly reintroduce a risk premium, sending prices higher again. Persistent restrictive monetary policy (with possible further rate adjustments) will likely limit long-term demand growth.
Overall, expect continued volatility. The $90 level for WTI acts as a key psychological pivot. Markets will closely watch every diplomatic headline, inventory report, and central bank signal. While structural supply tightness offers support, macroeconomic headwinds suggest limited upside unless major disruptions occur.
This balance makes oil a challenging but fascinating market to follow right now.@Gate_Square @Gate广场_Official
repost-content-media
  • Reward
  • 1
  • Repost
  • Share
HighAmbition:
good 👍👍👍 good 👍👍
#AnthropicValuationHits965BillionDollars
Anthropic Valuation Reaches 96.5 Billion Dollars:
Understanding the Headline
"AnthropicValuationHits965BillionDollars" represents one of the most significant developments in the artificial intelligence industry during 2026. This headline announces that Anthropic, a leading AI company headquartered in San Francisco, has achieved a post-money valuation of 96.5 billion dollars following its latest funding round. The term "valuation" refers to the estimated total market worth of a company as determined by investors, while "hits" indicates that this milest
HighAmbition
#AnthropicValuationHits965BillionDollars
Anthropic Valuation Reaches 96.5 Billion Dollars:
Understanding the Headline
"AnthropicValuationHits965BillionDollars" represents one of the most significant developments in the artificial intelligence industry during 2026. This headline announces that Anthropic, a leading AI company headquartered in San Francisco, has achieved a post-money valuation of 96.5 billion dollars following its latest funding round. The term "valuation" refers to the estimated total market worth of a company as determined by investors, while "hits" indicates that this milestone has been reached. In simpler terms, investors now collectively value Anthropic's entire business at approximately 96.5 billion dollars, making it one of the most valuable private companies in the world.
The Series H Funding Round Details
On May 28, 2026, Anthropic officially announced the completion of its Series H financing round, which raised 65 billion dollars in fresh capital. This round was co-led by several prominent investment firms including Altimeter Capital, Dragoneer, Greenoaks, and Sequoia Capital. Additional institutional investors such as Capital Group, Coatue, D1 Capital Partners, Baillie Gifford, Blackstone, Brookfield, D.E. Shaw Ventures, DST Global, and Fidelity Management and Research also participated significantly. Strategic infrastructure partners including Samsung, SK Hynix, and Micron joined the round as well, demonstrating the intersection of semiconductor manufacturing and AI development.
A notable component of this funding round includes 15 billion dollars of previously committed investments from major technology hyperscalers. Amazon contributed 5 billion dollars to this portion, having announced this investment in April 2026. This brings the total capital raised in the Series H round to 65 billion dollars, with the company now valued at 96.5 billion dollars on a post-money basis.
Valuation Growth Trajectory
The progression of Anthropic's valuation tells a remarkable story of exponential growth in the AI sector. Just three months prior to this announcement, in February 2026, Anthropic completed a Series G round at a valuation of 38 billion dollars. The jump from 38 billion to 96.5 billion represents an increase of approximately 154 percent in a single quarter. This valuation also surpasses Anthropic's primary competitor OpenAI, which achieved an 85.2 billion dollar valuation in March 2026 following a 122 billion dollar funding round.
To understand the magnitude of this valuation, consider that Anthropic's current worth exceeds that of many established Fortune 500 companies. The 96.5 billion dollar figure places Anthropic among the most valuable private enterprises globally and positions it as the most valuable artificial intelligence startup in existence, overtaking OpenAI for this distinction.
Revenue Performance and Financial Metrics
Anthropic's valuation surge correlates directly with its extraordinary revenue growth. The company reported a revenue run rate of 47 billion dollars as of May 2026, up from 30 billion dollars earlier in the year and 10 billion dollars in annual revenue during 2025. This represents a growth trajectory of approximately 370 percent year-over-year.
The revenue run rate metric indicates the annualized revenue based on current monthly performance. At 47 billion dollars, Anthropic generates nearly 4 billion dollars in monthly revenue. Industry analysts project that Anthropic could experience an 80-fold increase in size during 2026, suggesting revenue could potentially reach extraordinary levels by year-end.
The company anticipates achieving its first operating profit in the near future, with projections indicating a 130 percent revenue surge. This path to profitability distinguishes Anthropic from many technology companies that prioritize growth over immediate financial returns.
Product Portfolio and Market Position
Anthropic's valuation reflects the success of its flagship AI assistant Claude and its various iterations. The company recently released Claude Opus 4.8, which features enhanced capabilities in agentic tasks, advanced coding functionalities, and improved honesty with self-correction mechanisms. Additionally, Anthropic unveiled Claude Mythos Preview, a specialized model with advanced cybersecurity capabilities available to select enterprise clients.
The Claude Code product has emerged as a primary revenue driver, particularly among enterprise customers seeking AI-powered coding assistance. This tool has gained significant traction in software development workflows, contributing substantially to the company's revenue acceleration.
Competitive Landscape and Industry Context
The AI funding environment in 2026 has shattered previous records. In the first quarter alone, AI companies raised 297 billion dollars across various funding rounds. Four of the five largest deals ever recorded in venture capital history occurred within this sector during this period.
Anthropic's 96.5 billion dollar valuation places it ahead of OpenAI's 85.2 billion dollar valuation, creating a new competitive dynamic between these two leading AI laboratories. While OpenAI raised a larger absolute amount of capital in its March round at 122 billion dollars compared to Anthropic's 65 billion dollars, Anthropic's higher valuation reflects investor confidence in its unit economics and growth trajectory.
Elon Musk's SpaceX, which merged with xAI earlier in 2026, represents another major competitor with a combined valuation of 1.25 trillion dollars. However, SpaceX's valuation encompasses its space exploration business alongside its AI operations, making direct comparisons challenging.
Planned Use of Proceeds
Anthropic has outlined specific priorities for deploying the 65 billion dollars in new capital. The company intends to advance its safety and interpretability research, which focuses on understanding how AI systems make decisions and ensuring they operate within ethical boundaries. Expanding compute infrastructure represents another major priority, as meeting growing demand for Claude requires substantial investments in processing power and data center capacity.
The funding will also support scaling products and partnerships that enterprise customers rely upon. This includes expanding Claude Code capabilities, enhancing the Claude platform, and developing new AI applications for business use cases.
IPO Preparations and Future Outlook
The Series H round may represent Anthropic's final private fundraising before an initial public offering. The company has been preparing for a potential IPO behind the scenes, though specific timing remains fluid. This funding round provides Anthropic with substantial capital to operate independently while finalizing its public market debut strategy.
OpenAI is similarly preparing to file a confidential IPO prospectus, with plans to go public as early as September 2026. The competitive race between these two AI giants to reach public markets adds another dimension to their ongoing rivalry.
Investment Implications and Market Significance
The 96.5 billion dollar valuation signals strong institutional confidence in Anthropic's long-term prospects. The participation of established investment firms like Altimeter Capital and Sequoia Capital, alongside infrastructure partners from the semiconductor industry, indicates broad-based support for Anthropic's vision.
For the broader AI industry, this valuation establishes new benchmarks for private company valuations and demonstrates the continued appetite for significant investments in artificial intelligence capabilities. The round also highlights the convergence of AI development with hardware manufacturing, as evidenced by the involvement of Samsung, SK Hynix, and Micron.
Anthropic's achievement of a 96.5 billion dollar valuation represents a watershed moment in artificial intelligence industry development. This valuation reflects not only the company's impressive revenue growth and product adoption but also investor confidence in its approach to AI safety and enterprise applications. As Anthropic prepares for a potential initial public offering, this funding round provides the resources necessary to maintain its competitive position against OpenAI and other rivals while advancing the frontier of artificial intelligence capabilities.
@Gate_Square @Gate广场_Official
repost-content-media
  • Reward
  • 1
  • Repost
  • Share
HighAmbition:
good information 👍👍👍
#MicronMarketCapBreaks1Trillion
Micron Technology has achieved a historic milestone by becoming the first American memory chip manufacturer to reach a market capitalization of one trillion dollars. This extraordinary achievement represents one of the most remarkable corporate transformations in recent semiconductor industry history. The company founded in Boise Idaho in 1978 by Ward Parkinson Joe Parkinson Dennis Wilson and Doug Pitman has evolved from a small semiconductor design consulting firm into a global powerhouse that now stands among the most valuable companies in the world.
Micron T
HighAmbition
#MicronMarketCapBreaks1Trillion
Micron Technology has achieved a historic milestone by becoming the first American memory chip manufacturer to reach a market capitalization of one trillion dollars. This extraordinary achievement represents one of the most remarkable corporate transformations in recent semiconductor industry history. The company founded in Boise Idaho in 1978 by Ward Parkinson Joe Parkinson Dennis Wilson and Doug Pitman has evolved from a small semiconductor design consulting firm into a global powerhouse that now stands among the most valuable companies in the world.
Micron Technology operates as one of the Big Three memory manufacturers globally alongside Samsung Electronics and SK Hynix from South Korea. The company specializes in manufacturing dynamic random access memory chips commonly known as DRAM which serves as the primary working memory in computers and electronic devices. Additionally Micron produces NAND flash memory used in solid state drives and various storage applications. The company holds approximately third place in global DRAM market share and fifth place in NAND flash market share making it a significant but not dominant player in the memory industry for many years.
The journey to one trillion dollars in market value has been extraordinary particularly when examining the stock price trajectory. In 2019 Micron stock traded around forty one dollars per share. The price climbed to fifty dollars in 2020 then to seventy eight dollars in 2021. The year 2022 saw the stock decline to sixty five dollars reflecting the cyclical nature of memory chip demand. In 2023 the stock remained around sixty five dollars showing little growth. The year 2024 brought improvement with the stock reaching an average of one hundred five dollars. The real transformation began in 2025 when the stock surged to an average of one hundred thirty seven dollars. The current year 2026 has witnessed an absolutely explosive rally with the stock price reaching approximately nine hundred twenty eight dollars in late May 2026.
The stock price movement on May 26 2026 was particularly dramatic. Micron shares opened at approximately eight hundred twenty dollars and surged to close around eight hundred ninety five dollars representing a gain of roughly eighteen to nineteen percent in a single trading session. The following day May 27 2026 saw the stock continue its ascent reaching approximately nine hundred twenty eight dollars with an intraday high of nine hundred fifty five dollars. This price action pushed the company market capitalization past the one trillion dollar threshold for the first time in its history. The stock has now more than tripled in value during 2026 alone and has appreciated approximately eight hundred percent over the past year.
The primary catalyst for this unprecedented rally was a dramatic price target upgrade from UBS one of the world major investment banks. UBS raised its price target on Micron stock from five hundred thirty five dollars to one thousand six hundred twenty five dollars representing a more than threefold increase. This revised target implies a potential market valuation of approximately one point eight trillion dollars for Micron within the next twelve months. UBS analysts stated there was no reason Micron should trade much differently from Nvidia on a price to earnings basis given the structural changes occurring in the memory industry driven by artificial intelligence demand.
The fundamental driver behind Micron valuation surge is the explosive growth in demand for high bandwidth memory chips specifically designed for artificial intelligence applications. High bandwidth memory or HBM represents a specialized type of DRAM that offers significantly higher data transfer speeds compared to standard memory chips. These HBM chips are essential components in artificial intelligence accelerators and graphics processing units used for training and running large language models. Nvidia the leading AI chip company uses Micron HBM chips in its newest AI and gaming solutions solidifying Micron position as a critical supplier in the AI ecosystem.
The supply dynamics of HBM production create a favorable environment for Micron. Manufacturing HBM chips requires approximately three times as many silicon wafers compared to producing standard DDR5 memory chips. Additionally building new cleanroom facilities for semiconductor production requires multi-year lead times. These structural supply constraints combined with AI accelerated demand growth that exceeds available supply create a pricing environment highly favorable to memory manufacturers. Management commentary indicates that demand exceeds available supply across both DRAM and NAND segments for the foreseeable future.
Micron revenue transformation has been equally dramatic. The company first half of fiscal year 2026 generated approximately thirty seven point five billion dollars in revenue which already matches the entire annual revenue of fiscal year 2025 at thirty seven point four billion dollars. Data center revenue now represents approximately fifty six percent of total revenue marking the first time that data center applications have comprised more than half of the industry DRAM and NAND total addressable market. This represents a fundamental shift in Micron business mix toward higher margin products including HBM low power DRAM for data centers and enterprise solid state drives.
The competitive landscape has also shifted favorably for Micron. SK Hynix another major memory manufacturer reached one trillion dollars in market capitalization around the same time as Micron creating what market commentators have called the trillion dollar memory club. Samsung Electronics the largest memory manufacturer had already achieved this milestone previously. The fact that all three major memory manufacturers have now reached or exceeded one trillion dollars in market value demonstrates the industry wide impact of AI driven demand.
Analyst sentiment toward Micron has shifted dramatically. The UBS price target of one thousand six hundred twenty five dollars represents the highest among forty six brokerages covering the stock. At that price level Micron would be worth approximately one point eight trillion dollars which would place it ahead of Tesla and Meta Platforms each currently valued around one point six trillion dollars. To reach this valuation Micron would need to appreciate approximately fifty percent from its current one trillion dollar market capitalization which has already increased eight hundred percent over the past year.
The broader market context supports continued optimism for Micron. The Nasdaq and S&P 500 indices reached new record highs during the same period that Micron crossed the one trillion dollar threshold. The semiconductor sector index has hit all time highs reflecting investor enthusiasm for companies benefiting from artificial intelligence infrastructure buildout. Trading volume in Micron stock has been elevated with approximately thirty eight million shares changing hands compared to average daily volumes.
Looking at the historical context Micron achievement is remarkable. The company has transformed from a cyclical commodity memory chip producer subject to boom and bust cycles into a structural growth story driven by artificial intelligence demand. The stock price of around nine hundred dollars represents a more than twenty fold increase from the lows seen in previous years. The company now ranks as the tenth most valuable company in America ahead of established giants like Walmart and Eli Lilly.
The risks to Micron valuation include the cyclical nature of memory markets which have historically experienced periods of oversupply and price declines. However the structural supply constraints in HBM production and the multi year nature of AI infrastructure buildout suggest the current demand environment may persist longer than previous cycles. The company valuation at one trillion dollars assumes continued strong demand and pricing for memory chips used in artificial intelligence applications.
In conclusion Micron Technology journey to a one trillion dollar market capitalization represents one of the most significant corporate transformations in the semiconductor industry. The company has leveraged its position as a leading memory manufacturer to capitalize on the artificial intelligence revolution. The stock price appreciation from around one hundred dollars to over nine hundred dollars in approximately eighteen months reflects fundamental changes in the memory industry driven by insatiable demand for high bandwidth memory chips. With data center revenue now comprising the majority of sales and structural supply constraints supporting pricing Micron has established itself as a critical player in the artificial intelligence ecosystem alongside companies like Nvidia. The UBS price target of one thousand six hundred twenty five dollars suggests further upside potential though investors should remain mindful of the cyclical risks inherent in the memory semiconductor industry.
@Gate_Square @Gate广场_Official
repost-content-media
  • Reward
  • Comment
  • Repost
  • Share
#24hCryptoFuturesLiquidationsTop400M
The cryptocurrency market entered a highly volatile phase following a sharp escalation in geopolitical tensions between the United States and Iran. On May 28, 2026, the digital asset market experienced a rapid and emotionally driven selloff, with Bitcoin briefly dropping below $74,500 and printing intraday lows near $72,912. This sudden move triggered widespread liquidations across derivatives markets, wiping out leveraged positions and forcing rapid deleveraging across exchanges.
Total market liquidations surged to approximately $407 million within 24 hou
HighAmbition
#24hCryptoFuturesLiquidationsTop400M
The cryptocurrency market entered a highly volatile phase following a sharp escalation in geopolitical tensions between the United States and Iran. On May 28, 2026, the digital asset market experienced a rapid and emotionally driven selloff, with Bitcoin briefly dropping below $74,500 and printing intraday lows near $72,912. This sudden move triggered widespread liquidations across derivatives markets, wiping out leveraged positions and forcing rapid deleveraging across exchanges.
Total market liquidations surged to approximately $407 million within 24 hours, impacting nearly 100,000 traders globally. The event highlighted the fragility of highly leveraged positioning in uncertain macro environments. While a partial recovery followed, overall sentiment remained cautious as traders reassessed geopolitical risk premiums and liquidity conditions across the crypto ecosystem.
This report provides a detailed breakdown of price action, macro drivers, liquidation mechanics, institutional flows, and strategic trading frameworks for navigating current conditions.
The Geopolitical Catalyst: US-Iran Military Escalation
Breaking Developments
The primary catalyst behind the market downturn was renewed military escalation in the Middle East. Late on May 27, 2026, the United States conducted targeted airstrikes on Iranian military infrastructure near the strategically critical Strait of Hormuz. This development immediately injected uncertainty into global markets, particularly risk-sensitive assets like cryptocurrencies.
Compounding the shock, the White House denied any formal diplomatic memorandum with Iran, reversing earlier market optimism about potential de-escalation. The sudden shift from negotiation hopes to active conflict created a sharp sentiment breakdown.
Statements from President Donald Trump emphasized that no single nation would be allowed to control the Strait of Hormuz, reinforcing concerns over prolonged geopolitical friction. Subsequent retaliatory actions by Iranian forces further escalated tensions, intensifying global risk-off positioning.
Market Reaction Timeline
The reaction across financial markets was swift and synchronized:
Cryptocurrencies declined 3%–4% within hours
Bitcoin broke below $73,000 psychological support
Oil markets initially spiked over 2%
Equity futures turned volatile with risk-off flows
Safe-haven demand increased in gold and bonds
The reaction demonstrated the strong correlation between crypto assets and global macro risk sentiment. The breakdown in Bitcoin accelerated once algorithmic and leveraged trading systems triggered cascading stop-loss orders.
Bitcoin Price Analysis: Technical Breakdown
Current Market Data
As of May 29, 2026, Bitcoin is trading around:
Current Price: $73,771.50
Daily High: $73,947
Daily Low: $72,581.90
Open Price: $73,171.40
24h Change: +0.82% (~$600 rebound)
Despite the modest recovery, price action remains fragile and heavily dependent on macro headlines.
Historical Price Context
Bitcoin has experienced a notable correction from its recent peak above $81,250 (May 6, 2026). The current structure reflects:
Weekly decline: ~6.3%
Loss of $75,000 support zone
Breakdown from consolidation range
Increased volatility clustering
The rejection from the $83,500 Fibonacci 0.618 zone confirms strong overhead resistance and suggests that the prior bullish impulse has fully exhausted for now.
Critical Support and Resistance Levels
Key technical zones now define market direction:
Immediate Support:
$72,500 (recent swing low)
$70,000 (psychological level)
$68,000 (macro demand zone)
Resistance Levels:
$75,000 (broken support, now resistance)
$78,000 (mid-range liquidity zone)
$82,000 (200 EMA cluster)
A sustained recovery above $75,000 would be required to restore short-term bullish structure.
Technical Indicators Overview
Market indicators currently show near-equilibrium conditions:
RSI: Neutral (no directional bias)
MACD: Slight bearish crossover pressure
MA models: ~50/50 directional probability
Bollinger Bands: Mid-band compression phase
KDJ: Balanced but slightly downward skew
Overall, the market is in an inflection zone, where the next major catalyst will likely determine directional breakout or continuation of consolidation.
Ethereum and Altcoin Performance
Ethereum Market Dynamics
Ethereum has mirrored Bitcoin’s weakness but with slightly higher volatility sensitivity.
Current price: ~$1,974.96
Recent peak: ~$2,100+
Structure: Bearish continuation pressure
Trend: Lower highs forming consistently
Technical analysts note a potential extended downside scenario if current support fails, with projected targets near $1,075–$1,100 range under extreme bearish continuation conditions.
Altcoin Market Conditions
The broader altcoin ecosystem continues to struggle under:
Reduced liquidity inflows
Increased BTC dominance volatility
Risk-off capital rotation
Declining speculative appetite
Total crypto market capitalization remains near $2.6 trillion, reflecting a controlled but persistent contraction phase.
Sentiment indicators confirm entry into Fear territory, historically associated with accumulation phases but also prolonged drawdown risk if macro conditions worsen.
Liquidation Analysis: Understanding the $407 Million Wipeout
Scale and Structure of Liquidations
The liquidation cascade totaled approximately:
$407 million wiped in 24 hours
~100,000 traders affected
93% long-position liquidations
Concentrated in BTC and ETH derivatives
This event highlights excessive leverage concentration on the bullish side prior to geopolitical shock.
Cascade Mechanism
The liquidation sequence followed a predictable but destructive pattern:
Initial geopolitical shock
Sharp downside move in BTC
Stop-loss triggering across exchanges
Forced long liquidations
Additional downward pressure
Secondary liquidation waves
This feedback loop amplified volatility far beyond the initial news impact.
Historical Context
While significant, this liquidation event remains smaller than:
2021 multi-billion liquidation cycles
2022 crypto deleveraging events
However, it is large enough to reset short-term leverage positioning and improve structural stability temporarily.
Institutional Flows and ETF Dynamics
Spot Bitcoin ETF Outflows
Institutional sentiment has shifted notably:
7 consecutive days of ETF outflows
Highest 3-month withdrawal level
Reduced buy-side absorption
This suggests institutional caution amid macro uncertainty and geopolitical instability.
Large-Scale Dark Pool Activity
A reported $1.29 billion ETF-related sell order executed via dark pools highlights:
Institutional profit-taking or risk reduction
Reduced market transparency during execution
Potential pressure on spot liquidity
Such flows often precede extended consolidation phases.
Options Market Positioning
With approximately $8 billion in BTC/ETH options expiring, market makers are actively hedging exposure. This creates:
Short-term volatility spikes
Pinning effects near strike clusters
Increased gamma-driven price swings
Macroeconomic and Market Sentiment Factors
Risk Asset Correlation
Crypto remains highly correlated with:
Technology equities
High-beta growth assets
Global liquidity cycles
During geopolitical stress, capital rotates into:
Gold
US Treasuries
Cash-equivalent assets
Fear and Greed Index
Market sentiment remains in Fear territory, reflecting:
High uncertainty
Weak momentum
Defensive positioning
Historically, such phases can precede accumulation—but timing remains uncertain.
Volatility Expansion
Both implied and realized volatility have increased sharply:
Higher option premiums
Wider intraday ranges
Increased liquidation risk
This environment favors disciplined risk management over aggressive positioning.
Trading Strategy Considerations
Question One: Performance of Recent Trades
Spot holders: ~4–5% unrealized drawdown
Leveraged longs: significant liquidation exposure
Shorts: profitable during breakdown phase
Hedged traders: relatively stable outcomes
Leverage remains the dominant risk factor determining survival.
Question Two: Buy the Dip or Hold?
Bullish Argument:
Historical recovery cycles intact
Halving cycle support still valid
DCA strategies reduce timing risk
Oversold conditions present opportunities
Bearish Argument:
Ongoing geopolitical instability
ETF outflows persist
Technical breakdown confirmed
Liquidity uncertainty remains
Recommended Strategy
A balanced approach is preferred:
Gradual DCA accumulation
Strict risk-defined positioning
Avoid high leverage exposure
Maintain cash reserves for lower levels
Focus on multi-zone entry strategy
Risk Factors and Future Catalysts
Geopolitical Risk
The US-Iran situation remains the dominant macro driver. Any escalation involving the Strait of Hormuz could significantly impact:
Oil prices
Inflation expectations
Risk asset sentiment globally
Regulatory Environment
Ongoing regulatory developments in major economies continue to influence institutional participation and long-term capital flows into crypto markets.
The market currently sits in a high-volatility equilibrium phase, where neither bulls nor bears hold complete control. Directional resolution will likely depend on:
Geopolitical stabilization or escalation
ETF flow reversal
Liquidity cycle recovery
Key technical level reclaim or breakdown
Until then, the market is expected to remain reactive, headline-driven, and structurally unstable in the short term.@Gate_Square @Gate广场_Official
repost-content-media
  • Reward
  • 2
  • Repost
  • Share
AngelEye:
To The Moon 🌕
View More
#XLM
XLM Stellar Surges Over 24% as DTCC Partnership Ignites the RWA and US Stock Tokenization Narrative
The cryptocurrency market witnessed a sharp move this week as Stellar (XLM) surged over 24% in 24 hours, extending weekly gains to more than 43%. The rally was driven by a major institutional catalyst: the DTCC (Depository Trust & Clearing Corporation) selecting the Stellar network to advance its real-world asset (RWA) tokenization strategy, including potential tokenization of US equities, ETFs, and Treasuries.
This development has significantly strengthened the RWA narrative, positioning
XLM1.73%
RWA-0.68%
BTC-0.11%
HighAmbition
#XLM
XLM Stellar Surges Over 24% as DTCC Partnership Ignites the RWA and US Stock Tokenization Narrative
The cryptocurrency market witnessed a sharp move this week as Stellar (XLM) surged over 24% in 24 hours, extending weekly gains to more than 43%. The rally was driven by a major institutional catalyst: the DTCC (Depository Trust & Clearing Corporation) selecting the Stellar network to advance its real-world asset (RWA) tokenization strategy, including potential tokenization of US equities, ETFs, and Treasuries.
This development has significantly strengthened the RWA narrative, positioning it as one of the most important macro themes in crypto for 2026–2027.
Price Surge Breakdown and Market Reaction
Before the announcement, XLM was trading near $0.16. After the DTCC news on May 27, 2026, price action accelerated rapidly:
Immediate spike to $0.19 – $0.20
Intraday highs reaching ~$0.21
Weekly gain exceeding +43%
24h trading volume surged to $1.12B – $1.78B
Market cap expanded from ~$5.6B to ~$6.6B
This move clearly showed decoupling behavior, as Bitcoin and major altcoins remained relatively stable while XLM rallied strongly on its own institutional catalyst.
The move is widely viewed as fundamental-driven rather than speculative hype, making it one of the strongest narrative-based rallies of the current cycle.
DTCC Partnership: Why It Matters
The DTCC is the backbone of US capital markets, processing over $4.7 quadrillion in securities transactions annually. It is responsible for clearing and custody of nearly all US equities, ETFs, and a large portion of bonds.
Key development:
DTCC + Stellar Foundation announced plans to enable tokenization of DTC-custodied assets
Includes US stocks, ETFs, Treasuries, and bonds
Expected operational timeline: H1 2027
Built on prior regulatory clearance from the US SEC (Dec 2025 No-Action Letter)
This is not a pilot experiment—it represents a structured pathway for integrating traditional finance infrastructure with blockchain settlement systems.
Why Stellar Was Chosen
Stellar was selected due to its institutional-grade design focus:
Key advantages:
Transaction fees: fractions of a cent
Settlement speed: 3–5 seconds
Built-in compliance controls (KYC/AML enforcement at protocol level)
Asset issuance and permissioned transfer features
Proven institutional usage (e.g., Franklin Templeton tokenized fund)
Unlike general-purpose blockchains, Stellar is optimized for regulated financial environments, making it suitable for DTCC-scale integration.
RWA Market Context: The Bigger Picture
The real-world asset tokenization sector has been expanding rapidly:
Total on-chain RWA market: ~$31B (2026)
Growth from ~$20B in 2025
Tokenized equities: ~$963M
Tokenized Treasuries dominate sector:
BlackRock BUIDL: ~$2.44B
WisdomTree: ~$943M
Long-term projections:
$10T – $16T by 2030 (BCG / Standard Chartered estimates)
Despite this growth, RWAs still represent a very small fraction of global financial markets, meaning adoption is still in early structural stages.
Is the RWA Narrative Returning Stronger?
Yes—but with a major shift in quality.
Earlier RWA cycles were driven by:
Startup experiments
Small-scale pilots
Limited regulatory clarity
Current cycle differs because:
DTCC is directly involved
SEC regulatory framework is in place
Real custody infrastructure is being tokenized
US equities are included in scope
This transforms RWA from a concept narrative into institutional infrastructure development.
Technical Levels and Market Structure
After the sharp rally, XLM entered a technically extended zone.
Key levels:
Resistance:
$0.2306 (pivot zone)
$0.2352
$0.2402
$0.2447
Support:
$0.2256
$0.2211
$0.2161
Strong base: ~$0.22
Market indicators:
RSI likely in overbought territory
High probability of short-term consolidation
Volatility expansion followed by cooling phase is expected
Trading Strategy Outlook (Traders’ Perspective)
1. Accumulation Strategy
Long-term participants may consider:
Primary accumulation zone: $0.17 – $0.18
Strong historical support near $0.16 (pre-news zone)
Gradual DCA approach preferred over lump entries
This strategy focuses on post-news retracement cycles, which are common after narrative-driven rallies.
2. Breakout Strategy
If momentum continues:
Break above $0.235
Next targets: $0.24 → $0.26 → extended $0.28 zone
Requires sustained volume above $1B+ daily
Breakout traders must confirm:
Volume expansion
Market-wide risk-on sentiment
No rejection at pivot resistance
3. Pullback Strategy
Most conservative approach:
Wait for retest of $0.21 – $0.22 zone
Ideal re-entry: deep retracement toward $0.18
Avoid chasing above resistance clusters
This aligns with historical behavior of post-catalyst correction phases.
4. Risk Management Rules
Traders should consider:
Stop-loss below $0.216
Avoid full exposure during news spikes
Reduce leverage due to volatility expansion
Expect sharp 10–20% intraday swings
Market Sentiment and Trader Psychology
Market participants are currently divided into three groups:
Early accumulators: Locking profits after 40%+ weekly gains
Momentum traders: Riding continuation toward $0.24+
Late entrants: Waiting for correction or confirmation breakout
The key psychological driver is fear of missing institutional narrative expansion, especially around US stock tokenization.
Long-Term Outlook: US Stock Tokenization Era
Several macro forces support continued growth:
SEC regulatory clarity expanding
DTCC blockchain integration underway
Crypto exchanges exploring equity-based products
Increasing institutional demand for 24/7 markets
If implementation succeeds, crypto exchanges may evolve into full-spectrum financial marketplaces offering:
Tokenized stocks
ETFs
Treasuries
Crypto assets
Synthetic equity exposure
This would represent one of the most significant structural shifts in global finance since electronic trading.
Final Market Takeaway
XLM’s rally is not just a price spike—it is a signal event for institutional blockchain adoption.
However, key risks remain:
Long timeline until 2027 deployment
Potential narrative cooling phase
Macro volatility across crypto markets
For traders, the current phase is best described as: “high conviction narrative + short-term technical exhaustion”
Disciplined strategy, patience, and risk control remain essential as the market transitions from announcement-driven volatility to infrastructure-driven long-term adoption. .@Gate_Square @Gate广场_Official
repost-content-media
  • Reward
  • 3
  • Repost
  • Share
HighAmbition:
good information
View More
#TradFi交易分享挑战
#XBR
XBR Brent Crude Oil Near $94.70:
Brent crude oil is currently trading around $94.70 per barrel (May 29, 2026) after one of the most violent and geopolitically driven price cycles in modern energy history. Over just three months, prices have swung from $73 lows, surged above $116.73 at peak war escalation, and retraced back toward the low $90s as ceasefire speculation and renewed tensions repeatedly collide.
The market is now trapped in a highly sensitive range where $4–$6 intraday moves are triggered by a single headline. At the center of this volatility is the ongoing US
GS0.39%
HighAmbition
#TradFi交易分享挑战
#XBR
XBR Brent Crude Oil Near $94.70:
Brent crude oil is currently trading around $94.70 per barrel (May 29, 2026) after one of the most violent and geopolitically driven price cycles in modern energy history. Over just three months, prices have swung from $73 lows, surged above $116.73 at peak war escalation, and retraced back toward the low $90s as ceasefire speculation and renewed tensions repeatedly collide.
The market is now trapped in a highly sensitive range where $4–$6 intraday moves are triggered by a single headline. At the center of this volatility is the ongoing US–Iran conflict and the partial closure of the Strait of Hormuz, which has disrupted global oil flows and reshaped supply expectations for 2026–2027.
This is no longer a normal oil cycle. It is a structural geopolitical supply shock.
Current Price Snapshot and Market Conditions
As of May 29, 2026:
Brent Crude: ~$94.70
WTI Crude: ~$90.82
Weekly range: ~$92.25 → $116.73 (recent peak cycle)
Daily volatility: 2%–6% swings driven by headlines
Market condition: extreme geopolitical sensitivity + liquidity-driven swings
Recent key moves:
May 27: Brent dropped to $92.25 (-4.6%) on ceasefire optimism
May 28: Rebounded above +2% after renewed US-Iran strikes
May 29: Slight decline amid renewed negotiation uncertainty
The market is effectively trading a binary outcome: peace deal vs escalation continuation.
Major Catalyst: Strait of Hormuz Crisis
The central driver of the oil shock is the partial shutdown and disruption of the Strait of Hormuz, through which nearly 20% of global oil flows normally pass.
Before disruption:
~14 million barrels/day passed through Hormuz
Current estimates:
~11 million barrels/day of supply effectively disrupted or delayed
Significant OPEC export bottlenecks (Saudi Arabia, UAE, Kuwait, Iraq)
Key consequences:
Shipping insurance premiums surged exponentially
Vessel transits dropped from 100+ per day to irregular flows
Multiple tanker delays, detentions, and rerouting events
LNG shipments severely disrupted
This has created a physical shortage environment, not just a financial one.
Supply Shock and Global Production Impact
According to industry estimates:
Global supply fell by ~10 million barrels/day at peak disruption
IEA data shows output falling to ~97 million barrels/day in March 2026
Over 1.2 billion barrels of cumulative lost supply since escalation began
OPEC+ response:
Output increase of only 188,000–206,000 bpd
Largely symbolic due to export route constraints
UAE withdrawal from OPEC further complicates coordination
Despite attempts at stabilization, physical supply remains structurally constrained.
Futures Curve and Market Expectations
Brent futures show a clear backwardation structure, signaling short-term stress:
July 2026: $103.54
August 2026: $100.21
September: $96.64
October: $93.29
November: $90.55
Interpretation:
Immediate shortage = higher near-term pricing
Medium-term expectation = gradual normalization
Market assumes partial resolution of crisis by late 2026
However, physical markets remain extremely tight, with spot cargoes trading at strong premiums over futures.
Institutional Forecast Divergence (Extreme Uncertainty)
Forecast range reflects unprecedented geopolitical uncertainty:
Barclays: ~$100 average (upside risk remains)
UBS: ~$105 base case
EIA: ~$106 short-term, ~$89 Q4 2026
JPMorgan: ~$60 bearish scenario
Goldman Sachs: ~$55–$60 long-term normalization case
Bernstein: ~$75–$77 equilibrium range
Extreme bull cases: $120–$150+ under prolonged disruption
Key takeaway: 👉 Forecast dispersion itself signals broken model reliability due to geopolitical shock
Bull vs Bear Narrative Split
1. Structural Bull Case (Supply Crisis Continuation)
Bullish arguments:
Inventory depletion accelerating globally
Shipping instability persists
Hormuz remains partially non-functional
Physical crude scarcity intensifying
Extreme scenarios:
Brent $120–$130 baseline escalation target
Spike risk: $150–$160 spot cargoes
Prolonged crisis could sustain $120–$150 range
Key driver: 👉 Physical shortage > financial speculation
2. Deal / Resolution Case (Bearish Correction Scenario)
Bearish arguments:
Tentative ceasefire extension discussions ongoing
Possible reopening of Hormuz within 30 days
Diplomatic pressure increasing
If realized:
Brent could fall toward $85–$90 equilibrium
Overshoot downside toward $70–$75 range
Long-term normalization toward $60s (pre-war assumptions)
Key risk: 👉 Market is pricing peace faster than reality allows
Geopolitical Background and War Impact
The crisis originates from the US–Iran conflict escalation in early 2026, which rapidly evolved into:
Maritime disruption in Hormuz
Missile exchanges and proxy escalation
Energy infrastructure targeting risks
Global shipping insurance breakdown
Strategic impact:
Energy flows weaponized
Oil becomes geopolitical leverage tool
Maritime chokepoints regain Cold War-style importance
This represents one of the largest supply disruptions in modern oil history.
Trading Strategy Outlook
1. Range Trading Strategy
Current range structure:
Support: $92 – $93 zone
Mid-range: $94 – $100
Resistance: $103 – $105
Extreme resistance: $110+
Strategy:
Buy dips near support zones
Sell rallies into resistance clusters
Avoid chasing breakout headlines
2. Breakout Strategy
Bullish breakout triggers:
Hormuz closure escalation
Failed negotiations
Shipping disruptions intensify
Targets:
$108 → $112 → $120
Extreme spike: $130+
Requires:
High volume confirmation
Sustained geopolitical shock
3. Breakdown Strategy (Ceasefire Scenario)
Bearish triggers:
Verified reopening of Hormuz
Stable ceasefire agreement
Shipping normalization
Targets:
$90 → $85 → $80
Overshoot zone: $70s
4. Risk Management Framework
Due to extreme volatility:
Use tight position sizing
Avoid high leverage exposure
Expect 5–10% intraday swings
No overnight exposure on headline risk
Always hedge geopolitical gaps
Trader Sentiment and Market Psychology
Market participants are divided into three groups:
Aggressive bulls: targeting $120–$150 oil spike
Event traders: playing headline-driven swings
Macro hedgers: protecting inflation and energy exposure
Key behavioral driver: 👉 Fear of missing escalation vs fear of sudden peace reversal
This creates liquidity traps on both sides of the market.
Macro Impact: Inflation and Global Economy
Oil surge is now directly feeding into global inflation:
US CPI projected near 6% in Q2 2026
Energy-driven inflation spreading into goods and logistics
Shipping costs doubled on key trade routes
Input costs rising across manufacturing sectors
Central banks face dilemma:
Tighten policy → risk recession
Ignore inflation → long-term price instability
Outlook: What Happens Next?
Three critical triggers will define Brent’s next major move:
Hormuz status (open vs restricted vs closed)
US–Iran diplomatic outcome (Trump approval key factor)
Actual physical vessel movement data
Until clarity emerges:
Brent remains a headline-driven volatility asset
$10–$15 moves remain possible in short timeframes
Structural uncertainty dominates pricing logic
Final Market Takeaway
Brent crude at $94.70 is not equilibrium—it is tension pricing.
The oil market is no longer functioning as a standard supply-demand system. It is operating as a geopolitical risk engine, where:
Diplomacy moves price more than production
Shipping routes matter more than reserves
Headlines override fundamentals in seconds
Whether Brent moves toward $130 or $80 depends entirely on one fragile question:
👉 Does the Strait of Hormuz stabilize—or remain a contested geopolitical chokepoint?
Until that is answered, oil will remain one of the most violent and unpredictable markets in the global financial system.
@Gate_Square @Gate广场_Official
repost-content-media
  • Reward
  • 2
  • Repost
  • Share
Vortex_King:
2026 GOGOGO 👊
View More
#TradFi交易分享挑战
#TradFi交易分享挑战
#MU
Micron Technology is trading near $951.5 on May 29, 2026, and the company has rapidly transformed from a traditional cyclical memory-chip manufacturer into one of the most powerful AI infrastructure plays in the entire semiconductor sector. What was once viewed as a volatile DRAM business is now sitting at the center of the global AI boom, with Micron officially crossing the $1 trillion market capitalization threshold after one of the strongest rallies ever seen in a large-cap technology stock.
Micron’s Historic Rally and Price Explosion
The most dramatic pha
HighAmbition
#TradFi交易分享挑战
#TradFi交易分享挑战
#MU
Micron Technology is trading near $951.5 on May 29, 2026, and the company has rapidly transformed from a traditional cyclical memory-chip manufacturer into one of the most powerful AI infrastructure plays in the entire semiconductor sector. What was once viewed as a volatile DRAM business is now sitting at the center of the global AI boom, with Micron officially crossing the $1 trillion market capitalization threshold after one of the strongest rallies ever seen in a large-cap technology stock.
Micron’s Historic Rally and Price Explosion
The most dramatic phase of the rally arrived on May 26, 2026, when Micron surged nearly 19.3% in a single trading session. Shares exploded from roughly $751 to close near $895.88, instantly adding hundreds of billions in market value and pushing the company into the trillion-dollar club. Momentum did not stop there. The stock climbed further to around $929.01 on May 27 before extending toward the current $951.5 level on May 29, with new all-time highs continuing to print almost daily.
The scale of the move becomes even more shocking when looking at the longer-term price trajectory. Micron traded near $285.41 in December 2025 before climbing toward $414.88 in January 2026. February held near $412.37 before March delivered a sharp correction toward $337.84, which later proved to be one of the best buying opportunities in the semiconductor market. April brought recovery momentum as MU pushed toward $517.16, but May became the true breakout month. From approximately $448 at the start of May to nearly $951.5 now, Micron has added more than $500 per share in less than a month. Over the past 52 weeks, the stock has rallied nearly 600%, massively outperforming both the S&P 500 and broader semiconductor indexes.
The AI Memory Supercycle Is Changing Everything
The entire bull case revolves around AI-driven high-bandwidth memory demand. Micron’s HBM production capacity for 2026 is reportedly completely sold out, with long-term agreements already extending visibility deep into 2027. This is a massive structural change for a business that historically suffered from brutal pricing cycles and oversupply conditions.
Micron’s advanced 12-high HBM3E memory stacks are critical components inside Nvidia’s Blackwell B200, B300, and Vera Rubin AI systems. Every major AI accelerator now requires massive memory bandwidth, and memory demand per chip continues increasing with every generation. Unlike previous semiconductor cycles where oversupply eventually crushed margins, AI infrastructure demand is currently expanding faster than manufacturing capacity can be built.
The hyperscaler spending numbers alone explain why investors remain aggressively bullish. Meta, Microsoft, Amazon, and Alphabet are collectively expected to spend more than $725 billion on AI infrastructure expansion during 2026. Every GPU cluster deployed inside these data centers requires enormous amounts of HBM memory, directly benefiting Micron. Reports that ByteDance could spend nearly $70 billion on additional AI data-center expansion have added even more fuel to the bullish narrative.
Financial Results Supporting the Bullish Thesis
Micron’s earnings growth has completely validated the AI supercycle story. Fiscal Q1 2026 revenue reached approximately $13.64 billion with diluted EPS near $4.60. Then came the explosive Q2 report. Revenue surged toward $23.86 billion, representing nearly 196% year-over-year growth and crushing analyst expectations by more than 24%.
EPS came in around $12.20 versus forecasts near $8.79, producing a stunning 38.79% earnings beat. Gross margins expanded dramatically toward 75%, far above the 25% to 35% range traditionally associated with commodity memory businesses. Cloud memory revenue alone surged above $7.75 billion during the quarter.
The guidance for fiscal Q3 2026 shocked Wall Street even further. Micron projected approximately $33.5 billion in revenue with gross margins potentially reaching 81%, numbers almost unheard of in the memory-chip industry. Analysts now expect Q3 EPS near $18.97 compared to just $1.73 during the same quarter last year. Full-year fiscal 2026 EPS estimates have climbed toward $57.71, compared to only $7.68 in fiscal 2025.
Analyst Targets Continue Moving Higher
Wall Street price targets have exploded higher alongside the stock. UBS issued the most aggressive forecast, raising its target from $535 all the way to $1,625. That target alone implies roughly 71% upside from the current $951.5 price area. UBS argues Micron deserves a much higher valuation multiple because AI demand and long-term contracts have fundamentally changed the predictability of earnings.
DA Davidson lifted its target toward $1,500 from $1,000, while Barclays increased its target to $1,175 from $675. Mizuho moved to $1,150, and Melius Research raised its outlook to $1,100. Citigroup also boosted its forecast from $425 to $840, although that target now sits below current market prices due to the speed of Micron’s rally.
The most important detail is that despite the massive move, Micron still trades around 16.6x forward earnings based on current projections. That remains below the S&P 500 forward multiple near 21x, which many bulls interpret as evidence the stock still has room for further re-rating.
Trader Sentiment and Market Psychology
Trader sentiment across social-media platforms and trading communities remains overwhelmingly bullish. Many investors no longer view Micron as a cyclical semiconductor company and instead compare it directly to Nvidia due to its central role in the AI ecosystem.
Discussions frequently focus on Micron’s extremely low PEG ratio near 0.07, which suggests earnings growth expectations remain far above the valuation multiple currently assigned by the market. Some traders believe the stock could eventually challenge $1,500 to $1,625 over the next 12 months if AI spending momentum remains intact. The most aggressive long-term projections even discuss prices above $2,000 by 2027, though those scenarios assume continued extraordinary growth conditions.
Risks and Warning Signs
Despite the explosive momentum, risks remain significant. Micron’s nearly 600% rally means expectations are now extremely elevated. Any slowdown in AI infrastructure spending, weaker guidance, or signs of HBM supply normalization could trigger sharp corrections.
The company is investing nearly $200 billion into future manufacturing expansion, including giant fabrication projects in Idaho and New York. While these projects support long-term growth, they also introduce the possibility of future oversupply if AI demand eventually cools before the new capacity becomes operational.
Analysts have also warned that parabolic semiconductor rallies historically experience violent corrections. Even within strong bull markets, pullbacks of 15% to 25% are entirely possible.
Trading Strategy and Key Levels
The next major catalyst is Micron’s Q3 earnings report scheduled for June 24, 2026. Traders expect another major beat given the company’s recent history of outperforming estimates by enormous margins.
Near-term upside targets remain around $1,000 to $1,050 if momentum continues into earnings season. A strong beat-and-raise report could accelerate the move toward $1,100 or even $1,175 quickly.
Important support zones include approximately $895, which marked the trillion-dollar breakout close, followed by the earlier May breakout region near $804. Stronger long-term support sits near the $448 to $500 zone where the latest vertical rally originally began.
Risk management remains essential because Micron has demonstrated the ability to move 15% to 20% in very short periods. Position sizing and stop-loss planning are critical given the stock’s extreme volatility.
How High Can Micron Realistically Go?
The answer depends entirely on whether the AI memory supercycle continues through 2027 and beyond. If hyperscaler spending remains near the projected $725 billion level, if HBM demand continues outpacing supply, and if Micron maintains gross margins near 75% to 81%, then analyst targets between $1,100 and $1,625 appear achievable over the next year.
More aggressive scenarios projecting $2,000 by 2027 assume Micron continues delivering extraordinary earnings growth while maintaining tight supply conditions across the HBM market. However, semiconductor history shows that no cycle lasts forever, and future supply expansion from Micron, Samsung, and SK Hynix could eventually pressure pricing power.
Micron currently stands at the center of the global AI infrastructure revolution. The company has transitioned from a highly cyclical commodity memory producer into one of the most strategically important suppliers for the AI era. Sold-out HBM production, triple-digit revenue growth, rapidly expanding margins, and massive hyperscaler capex commitments continue driving bullish momentum.
At approximately $951.5, the stock remains one of the market’s hottest AI trades heading into the June 24 earnings report. Analyst targets now range from roughly $1,100 on the conservative side to $1,625 among the most bullish firms, while traders continue debating whether the AI memory supercycle could eventually push MU toward even higher levels over the coming years.
The opportunity remains enormous, but so does the volatility. As long as AI infrastructure demand continues accelerating and Micron keeps delivering explosive earnings growth, the bullish narrative remains intact. However, given the unprecedented nature of this rally, traders should remain prepared for sharp corrections even within the broader long-term uptrend.
repost-content-media
  • Reward
  • 3
  • Repost
  • Share
HighAmbition:
thnxx for the update
View More
#TradFi交易分享挑战
#mrna
Moderna, Inc. (NASDAQ: MRNA) is currently trading around $46.54, reflecting a volatile post-COVID transformation phase where the company is shifting from pandemic-driven revenues toward long-term mRNA platform execution. The stock has recovered strongly from its 52-week low of $22.28, but remains well below its $59.55 high, showing a market still uncertain about fair value.
Current Price Context and Market Structure
MRNA’s current position near $46–47 sits significantly above its yearly average of roughly $35.48, confirming a medium-term recovery trend. However, price act
HighAmbition
#TradFi交易分享挑战
#mrna
Moderna, Inc. (NASDAQ: MRNA) is currently trading around $46.54, reflecting a volatile post-COVID transformation phase where the company is shifting from pandemic-driven revenues toward long-term mRNA platform execution. The stock has recovered strongly from its 52-week low of $22.28, but remains well below its $59.55 high, showing a market still uncertain about fair value.
Current Price Context and Market Structure
MRNA’s current position near $46–47 sits significantly above its yearly average of roughly $35.48, confirming a medium-term recovery trend. However, price action has been highly unstable.
The stock previously traded near $23–24 in late 2025, then rallied sharply to the $50–59 range by early 2026, before entering a consolidation phase. This structure reflects a catalyst-driven equity where momentum is not steady but event-dependent.
Key interpretation:
Strong rebound from lows → accumulation phase visible
Rejection near $59.55 → profit-taking and distribution
Current zone → equilibrium between bulls and shorts
Catalyst-Driven Movements: What Is Driving Price
The most recent rally was driven by two major factors:
1. Infectious Disease Fear Trade (Hantavirus Event)
A reported hantavirus cluster triggered speculative inflows into vaccine stocks. Moderna benefited due to existing research programs in hantavirus vaccines. This created a short-term momentum spike, but fundamentally the virus lacks pandemic-scale transmission potential, limiting long-term impact.
2. Improving Biotech Sentiment
Q1 2026 results showed ~$400M revenue, a strong improvement year-over-year. While still far below COVID peak levels, it confirmed Moderna is stabilizing its commercial base instead of collapsing.
Analyst Forecasts and Market Divergence
Wall Street remains deeply split on MRNA, with targets ranging widely:
Bear case estimates: $32–$40
Consensus range: $35–$48
Bull case estimates: $70–$110
This wide dispersion reflects uncertainty in:
Oncology pipeline success probability
Sustainability of vaccine revenues
Future mRNA platform expansion
Consensus view places the stock near fair value, but with extreme upside and downside asymmetry depending on clinical outcomes.
Upside Scenarios: How High Can MRNA Go?
Base Case ($55–65)
Assumes:
Stable COVID + flu vaccine adoption
Moderate pipeline progress
No major clinical breakthrough
This scenario implies gradual upside of 20–40%.
Bull Case ($70–85)
Requires:
Strong oncology Phase 3 data (Keytruda combo success)
Successful flu + COVID combination vaccine launch
Sustained revenue expansion
This could re-rate Moderna as a multi-platform biotech leader.
Extreme Bull Case ($100+)
Depends on:
Breakthrough oncology approval
Multiple successful product launches
Unexpected infectious disease demand spike
Low probability, but high impact scenario.
Bear Case ($25–30)
Triggered by:
Failed oncology trials
Weak vaccine adoption
Rising cash burn concerns
This would revisit prior accumulation zones.
Financial Position and Cash Dynamics
Moderna remains relatively well-capitalized but under pressure:
Revenue (2025): ~$1.9B
Q1 2026: ~$400M
Cash runway: $4.5–5.0B expected
Annual burn: ~$1B+
The company is not in immediate danger, but cash depletion is a long-term concern if pipeline monetization fails.
A major distortion in recent results came from a large litigation settlement, highlighting ongoing legal risk exposure.
Short Interest and Squeeze Potential
MRNA carries significant short positioning:
Short float: ~16.47%
Days to cover: ~10 days
This creates a structurally volatile setup:
Positive news → sharp short covering rallies
Negative news → accelerated downside pressure
The stock remains highly sensitive to squeeze dynamics, especially around clinical or regulatory catalysts.
Insider Activity and Market Signal
Recent insider activity shows:
Predominantly selling activity
Limited insider buying interest
While much of the selling is pre-planned, the absence of strong insider accumulation suggests cautious internal sentiment rather than aggressive bullish positioning.
Pipeline Outlook: Core Value Driver
Moderna’s valuation hinges on its ~35-program pipeline.
Key assets:
Intismeran (Cancer vaccine, Phase 3)
Most important catalyst. Success could redefine Moderna as an oncology leader.
Next-gen COVID vaccine (mNEXSPIKE)
Supports respiratory franchise continuation.
Flu vaccine program
Large global market opportunity.
Combination flu + COVID vaccine
Potential seasonal dominance product.
RSV and emerging infectious disease programs
Provide diversification layer.
Pipeline success or failure will determine long-term direction more than current earnings.
Trader Sentiment Breakdown
1. Momentum Traders
Trade news cycles and outbreak headlines
Focus on short-term volatility
Exit quickly after spikes
2. Long-Term Bulls
Believe in mRNA platform transformation
Expect oncology to unlock multi-billion-dollar markets
Accumulate on dips
3. Bears / Skeptics
Focus on cash burn and declining COVID demand
Expect valuation compression toward $25–30
Market behavior is driven by interaction of these three groups, creating sharp volatility cycles.
Trading Strategy Framework
Swing Trading Approach
Enter on catalyst confirmation
Hold 3–10 days
Target: 15–25% moves
Stop-loss: 8–12%
Position Trading Approach
Accumulate near $40–46 range
Target $55–65 medium term
Scale out on strength
Risk-Averse Approach
Wait for:
Break below $35 (value entry) OR
Confirmed Phase 3 success (momentum entry)
Short Strategy (High Risk)
Only after failed clinical events
Strict stop management required due to squeeze risk
Key Price Levels
$59.55 → Major resistance / yearly high
$50–55 → Supply zone
$46–47 → Current equilibrium
$35 → Structural support (key zone)
$22.28 → Long-term floor reference
Moderna sits at a critical transition point. The company is no longer a pandemic growth story, but not yet a proven multi-product biotech platform either. This creates a valuation gap that markets are actively trying to resolve.
At $46.54, MRNA reflects:
Partial recovery optimism
Significant pipeline uncertainty
High volatility expectations
The next major move will likely be driven by:
Oncology Phase 3 results
Vaccine approvals
Infectious disease catalysts
Until then, MRNA remains a high-volatility, event-driven trading stock with strong upside optionality but equally meaningful downside risk.@Gate_Square @Gate广场_Official
repost-content-media
  • Reward
  • 7
  • Repost
  • Share
Vortex_King:
2026 GOGOGO 👊
View More
#TradFi交易分享挑战
#MMM
3M Company (NYSE: MMM) — Comprehensive Analysis at $153.40
Company Overview and Business Profile
is a globally recognized industrial conglomerate headquartered in the United States, operating across safety, industrial, transportation, electronics, and consumer markets. Founded in 1902, the company has built a diversified product ecosystem including adhesives, abrasives, filtration systems, and personal protective equipment. After spinning off its healthcare unit (Solventum), 3M has become a more focused industrial player, concentrating on core manufacturing and technology-
MMM1.15%
HighAmbition
#TradFi交易分享挑战
#MMM
3M Company (NYSE: MMM) — Comprehensive Analysis at $153.40
Company Overview and Business Profile
is a globally recognized industrial conglomerate headquartered in the United States, operating across safety, industrial, transportation, electronics, and consumer markets. Founded in 1902, the company has built a diversified product ecosystem including adhesives, abrasives, filtration systems, and personal protective equipment. After spinning off its healthcare unit (Solventum), 3M has become a more focused industrial player, concentrating on core manufacturing and technology-driven segments.
The company operates in over 70 countries and employs around 60,000 people. Its business model is divided into Safety & Industrial, Transportation & Electronics, and Consumer. Safety & Industrial is the largest segment, driven by demand for respirators, tapes, and industrial solutions. Transportation & Electronics supports automotive and semiconductor supply chains, while Consumer includes well-known brands like Post-it and Scotch.
Current Price Performance and Market Situation
MMM trades near $153.40, reflecting a weak performance trend in 2026. The stock has underperformed both the S&P 500 and industrial peers, remaining in the lower half of its 52-week range. Year-to-date performance is negative, showing that investor sentiment remains cautious.
Recent earnings showed mixed signals. Revenue reached around $6 billion in Q1 2026, with adjusted EPS of $2.14 beating expectations. However, GAAP earnings declined due to legal and restructuring costs. Organic growth remained weak, and guidance was modest, limiting bullish momentum. As a result, the stock has not seen strong follow-through buying after earnings.
Analyst Forecasts and Price Targets
Wall Street sentiment is neutral-to-slightly bullish. Most analysts rate MMM as Hold or Buy, with a consensus price target around $170–$180. This suggests moderate upside from current levels.
Bullish scenarios point toward $185–$190 if margins improve and legal risks stabilize. Bearish estimates sit near $133, reflecting downside risk if litigation costs rise or growth slows further. Overall, analysts expect steady recovery rather than rapid growth.
Valuation Analysis
MMM trades at a forward P/E near 17–18x, which is reasonable for an industrial company. Dividend yield is around 2%, supported by strong cash flow and long-term payout stability. The company has maintained dividends for over 100 years, making it a strong income-focused holding.
Valuation is fair rather than cheap. Upside depends mainly on earnings growth and improved investor confidence after restructuring and legal clarity.
Technical Outlook
Technically, MMM remains weak on long-term charts. The stock is below its 200-day moving average near $158, which acts as resistance. Short-term momentum is slightly improving, but no strong breakout trend has formed.
Key support sits around $148–$150, while resistance lies at $158–$160 and then $170–$180. A breakout above $158 would be an early bullish signal.
Strengths and Positive Drivers
3M benefits from strong global brands, high cash flow generation, and diversified industrial exposure. The Solventum spin-off simplified operations and improved focus on core industrial segments. Margin expansion and cost-cutting efforts are gradually improving profitability.
The company’s innovation pipeline and R&D investment support long-term stability. Its dividend history also makes it attractive for conservative investors.
Risk Factors
The biggest risk is ongoing litigation, especially PFAS environmental claims and earplug lawsuits. These legal issues create uncertainty and pressure sentiment. Organic growth is also weak, and GAAP earnings remain distorted by legal expenses.
Another risk is slow industrial demand, which limits revenue acceleration. Without stronger growth or legal resolution, valuation expansion may remain limited.
Market Sentiment and Outlook
Investor sentiment is mixed. Long-term investors see value in recovery potential and dividends, while short-term traders struggle with weak momentum and sideways price action. Options activity suggests moderate expectations around $165–$175.
represents a slow recovery industrial story with stable fundamentals but significant legal overhang. Upside potential is moderate, likely in the $170–$185 range, while downside risk remains tied to litigation outcomes. The stock requires patience, with performance dependent on steady execution and improved legal clarity..@Gate_Square @Gate广场_Official
repost-content-media
  • Reward
  • 4
  • Repost
  • Share
Vortex_King:
2026 GOGOGO 👊
View More
#TradFi交易分享挑战
#TSM
Taiwan Semiconductor Manufacturing Company (TSM) is currently trading around $419.60 as of late May 2026. The stock has delivered an exceptional rally of over +116% in the past year, making it one of the strongest large-cap performers in the global semiconductor sector. The company now holds a market capitalization of approximately $2.17 trillion, placing it among the most valuable technology-related firms in the world.
TSMC remains the world’s leading semiconductor foundry, producing advanced chips for major technology companies such as Nvidia, Apple, AMD, Qualcomm, and B
TSM-0.57%
NVDA0.49%
AMD-1.58%
HighAmbition
#TradFi交易分享挑战
#TSM
Taiwan Semiconductor Manufacturing Company (TSM) is currently trading around $419.60 as of late May 2026. The stock has delivered an exceptional rally of over +116% in the past year, making it one of the strongest large-cap performers in the global semiconductor sector. The company now holds a market capitalization of approximately $2.17 trillion, placing it among the most valuable technology-related firms in the world.
TSMC remains the world’s leading semiconductor foundry, producing advanced chips for major technology companies such as Nvidia, Apple, AMD, Qualcomm, and Broadcom. The recent price action reflects strong investor confidence driven by artificial intelligence demand, advanced chip manufacturing leadership, and long-term supply dominance.
Recent Performance and Price Action
TSM recently reached a new 52-week high above $422 before slightly pulling back toward the $415–$419 zone. This minor decline is considered a normal consolidation phase after a strong breakout. Over the past year, the stock has risen from approximately $170 to above $419, reflecting a gain of more than 140%.
The trend remains strongly bullish across all major timeframes. Buyers continue to step in on dips, while institutional demand remains steady due to long-term AI infrastructure expansion. Short-term volatility is present, but it is occurring within a clearly upward structural trend.
Earnings Performance and Financial Strength
The latest Q1 2026 earnings report showed strong fundamentals. Revenue reached approximately $35.9 billion, reflecting over 35% year-over-year growth and beating market expectations. Earnings per share also exceeded forecasts, confirming strong operational efficiency.
Gross margins expanded significantly to above 66%, driven by increasing production of advanced nodes such as 3nm and preparation for 2nm manufacturing. Management also raised full-year revenue guidance to above 30% growth, reinforcing confidence in continued demand strength.
Capital expenditure is projected to reach up to $56 billion in 2026, showing aggressive expansion plans to meet rising global chip demand. The company also emphasized that AI demand is not temporary but structural and long-term in nature.
AI Supercycle and Growth Drivers
The main growth driver for TSMC is the global artificial intelligence infrastructure cycle. The company manufactures the most advanced AI chips used in data centers, including GPUs and custom AI accelerators.
Demand from hyperscale cloud providers and AI companies continues to accelerate, requiring significantly more advanced semiconductor capacity. TSMC benefits directly from this trend because it controls leading-edge manufacturing technology and high-performance chip production.
Additional growth comes from advanced packaging technologies and new production nodes such as 3nm and upcoming 2nm chips. These technologies increase pricing power and improve margins.
Technical Analysis and Key Levels
TSM remains in a strong uptrend on the technical chart. The stock trades above its 20-day, 50-day, and 200-day moving averages, confirming a long-term bullish structure.
Key support levels are located around $400, followed by stronger support near $382. The 200-day moving average near $323 represents the long-term trend base. On the upside, resistance is seen near $420–$425. A breakout above this zone could lead to price movement toward $440–$460.
Momentum indicators show strength but also suggest short-term consolidation due to extended conditions after a strong rally.
Forecast and Price Outlook
Analyst forecasts remain generally positive. Most models suggest a 12-month price range between $460 and $500 under normal conditions. More optimistic projections suggest potential movement toward $520 if AI demand continues to accelerate and earnings remain strong.
Short-term expectations suggest trading between $400 and $425 as the market consolidates recent gains. Medium-term outlook points toward $440–$480 if resistance is broken with strong volume.
Long-term projections remain bullish due to structural AI demand, capacity expansion, and pricing power in advanced semiconductor manufacturing.
Market Sentiment and Trader Positioning
Investor sentiment is strongly positive. Institutional investors continue to accumulate positions due to TSMC’s central role in global AI infrastructure. Hedge funds and long-term portfolios view the stock as a core holding in semiconductor exposure.
Retail trader sentiment is also bullish, driven by strong price momentum and consistent earnings growth. Options activity shows balanced positioning, with both hedging and continuation trades present.
Despite strong optimism, some caution exists due to extended valuation levels and geopolitical exposure, which may lead to short-term volatility.
Risk Factors
The main risk for TSMC is geopolitical uncertainty, particularly related to Taiwan’s strategic position. Any escalation in regional tensions could significantly impact market sentiment.
Valuation risk is also present, as the stock trades at a premium due to strong growth expectations. Any slowdown in earnings or guidance could trigger corrections.
Other risks include global demand fluctuations, supply chain disruptions, and shifts in AI investment cycles. Short-term technical pullbacks of 5–10% remain possible even within a strong bullish trend.
Trading Strategy Overview
For short-term traders, the key resistance zone is $420–$425. A confirmed breakout above this level may open upside toward $440. Support near $400 provides a potential entry zone during pullbacks.
Medium-term traders may consider accumulation between $386 and $400 with targets toward $460–$480. Stop-loss levels are typically placed below $380 to manage downside risk.
Long-term investors may view dips as accumulation opportunities, focusing on the structural AI growth trend and semiconductor leadership position of TSMC.
Conclusion
Taiwan Semiconductor Manufacturing Company remains one of the strongest structural growth stories in global markets. The combination of AI-driven demand, technological leadership, and pricing power supports a long-term bullish outlook.
While short-term volatility and geopolitical risks remain important factors, the overall trend structure continues to favor upside. Medium-term targets point toward $460–$500, while extended bullish scenarios may reach beyond $520 if current conditions persist.
@Gate_Square @Gate广场_Official
repost-content-media
  • Reward
  • 5
  • Repost
  • Share
Emon_II:
What's up with you and you vai and I
View More
#CryptoSurvivalGuide
The cryptocurrency market represents one of the most volatile, fast-moving, and psychologically demanding financial environments in modern finance. It is a market where billions of dollars shift hands daily, and price movements of 10%–30% within hours are not unusual. Traders entering this space without preparation often find themselves overwhelmed not by a single mistake, but by a chain of avoidable errors driven by emotion, leverage, and poor risk control. This survival guide provides a structured framework designed to help traders navigate crypto markets with disciplin
HighAmbition
#CryptoSurvivalGuide
The cryptocurrency market represents one of the most volatile, fast-moving, and psychologically demanding financial environments in modern finance. It is a market where billions of dollars shift hands daily, and price movements of 10%–30% within hours are not unusual. Traders entering this space without preparation often find themselves overwhelmed not by a single mistake, but by a chain of avoidable errors driven by emotion, leverage, and poor risk control. This survival guide provides a structured framework designed to help traders navigate crypto markets with discipline, structure, and long-term consistency.
Understanding the Crypto Market Landscape
Before placing any trade, it is essential to understand the structure and behavior of cryptocurrency markets. Unlike traditional stock markets that operate within fixed trading hours and centralized regulatory systems, crypto markets operate continuously—24 hours a day, 7 days a week—across a fragmented global network of exchanges.
This constant operation creates both opportunity and risk. Price discovery happens simultaneously across multiple venues, meaning inefficiencies, arbitrage gaps, and liquidity mismatches frequently appear. However, it also means there is no “safe” closing period where risk resets. Events can occur at any time, including weekends and low-liquidity hours, often resulting in sharp and unexpected price movements.
Market cycles in crypto are significantly more extreme compared to traditional financial instruments. Bull markets often produce exponential growth, driven by speculation, innovation narratives, and liquidity expansion. In contrast, bear markets can erase 80%–90% of value across major assets, often within months. These cycles are amplified by retail participation, leverage usage, and rapid sentiment shifts.
Psychology plays a dominant role in price behavior. Fear of missing out (FOMO) drives aggressive buying during uptrends, while panic selling accelerates downturns. Understanding crowd behavior is not optional—it is a core analytical skill required to interpret market structure effectively.
Building Your Foundation: Risk Management Fundamentals
Risk management is the core pillar of long-term survival in crypto trading. Without strict control over downside exposure, even a high win-rate strategy will eventually fail.
Position sizing is the first critical component. A disciplined trader limits risk per trade to a small percentage of total capital, typically between 1% and 2%. This ensures that even a sequence of losses does not cause irreversible damage to the account. Survival in trading is more important than maximizing short-term profit.
Stop losses must be predefined before entering any position. A stop loss should represent the invalidation of the trade idea rather than an arbitrary percentage decline. If a trade moves to the point where the original thesis is no longer valid, exiting is not optional—it is structural discipline.
Diversification also plays a key role in risk reduction. This includes diversification across assets, strategies, and timeframes. Trend-following systems may perform well in directional markets, while mean-reversion strategies perform better in range-bound environments. Relying on a single approach increases vulnerability to changing market conditions.
Leverage introduces both opportunity and structural fragility. While high leverage can amplify gains, it significantly reduces tolerance for volatility. Even small price swings can trigger liquidation. Conservative leverage usage, typically between 2x and 3x, allows traders to participate in market movements without excessive liquidation risk. Over-leveraging remains one of the fastest paths to account destruction.
Developing Your Trading Strategy
A successful trading approach must be systematic, structured, and rule-based. Emotional or discretionary decision-making consistently leads to inconsistent outcomes over time.
Technical analysis remains the foundation of most crypto strategies. Market structure—support and resistance levels, trend formations, and breakout zones—provides the framework for trade planning. Moving averages help identify directional bias, while volume analysis confirms the strength or weakness behind price movement.
Momentum indicators such as RSI and MACD provide additional context, but they must be interpreted within broader market conditions. In strong trends, overbought conditions can persist for extended periods, making premature reversals common among inexperienced traders.
Fundamental analysis in crypto extends beyond traditional valuation metrics. Tokenomics plays a major role, including supply schedules, inflation rates, unlock events, and distribution models. These factors influence long-term price pressure and accumulation behavior.
Development activity, ecosystem growth, and community engagement also contribute to assessing project strength. Meanwhile, exchange listings, partnerships, and regulatory updates often act as short-term catalysts for volatility.
On-chain analysis adds another layer of insight. Exchange inflows may indicate potential selling pressure, while outflows suggest accumulation and long-term holding behavior. Wallet distribution highlights concentration risk, and network activity can indicate genuine adoption versus speculative interest.
Psychological Preparation and Emotional Control
Trading psychology is often the deciding factor between long-term success and failure. Fear and greed are the two dominant emotional forces influencing decision-making.
Fear causes hesitation, premature profit-taking, and avoidance of valid setups. Greed leads to excessive risk-taking, overtrading, and holding losing positions too long in hope of recovery. Both distort rational decision-making and weaken consistency.
A structured trading journal is one of the most effective tools for improving psychological discipline. Recording entries, exits, reasoning, and emotional state allows traders to identify behavioral patterns over time. This process builds self-awareness and reduces repeated mistakes.
Losses must be normalized as part of trading operations. Even professional traders experience win rates of 40%–50%. Profitability does not depend on winning every trade but on ensuring that average gains exceed average losses.
Revenge trading is one of the most damaging psychological behaviors. Attempting to recover losses immediately often leads to impulsive decisions and larger drawdowns. Stepping away from the market after significant losses helps restore objectivity and prevents emotional escalation.
Exchange Selection and Security Practices
Choosing a reliable exchange is essential for both execution quality and asset safety. Factors such as liquidity, uptime, security track record, and transparency must be considered before committing capital.
Centralized exchanges offer ease of use and high liquidity but require trust in third parties. Decentralized exchanges provide greater self-custody but often come with higher fees and lower liquidity.
Security practices are non-negotiable in crypto. Two-factor authentication should always be enabled using authentication apps rather than SMS-based systems, which are vulnerable to SIM-swap attacks. Strong, unique passwords should be used for every platform.
Cold storage is critical for long-term asset protection. Hardware wallets keep private keys offline, reducing exposure to hacks and exchange failures. Only active trading capital should remain on exchanges at any given time.
Phishing attacks remain one of the most common threats in the crypto space. Fake websites, malicious links, and impersonation attempts are widespread. Direct navigation and careful verification of URLs are essential habits for safe participation.
Market Analysis and Timing
Understanding market structure is essential for identifying favorable trading conditions. Markets alternate between trending and ranging environments, and each requires a different strategic approach. Applying the wrong strategy to the wrong environment is a common cause of losses.
Volatility is not constant—it clusters in cycles. Low-volatility periods often precede large breakouts, while high-volatility periods require wider stop-losses and smaller position sizes to manage risk effectively.
Correlation between assets also shifts over time. During risk-on phases, cryptocurrencies often move in sync with equities and other risk assets. During crypto-specific narratives, individual assets may decouple and follow independent momentum.
Macroeconomic factors increasingly influence crypto behavior. Interest rates, inflation data, and global liquidity conditions all affect investor appetite for risk assets. Institutional participation has strengthened this connection over time.
Long-Term Survival and Growth
Long-term success in crypto trading requires treating it as a structured business rather than speculative activity. Detailed record-keeping is essential for performance evaluation, tax compliance, and strategy refinement.
Continuous learning is a necessary component of survival. Markets evolve, and strategies that once worked may lose effectiveness. Traders must adapt by studying new tools, technologies, and market conditions.
Diversifying income streams reduces dependency on active trading performance. Many traders combine spot trading with longer-term investing, staking, or yield-based strategies to stabilize returns across cycles.
Physical and mental health also directly influence trading performance. Sleep quality, stress management, and lifestyle discipline all contribute to decision-making quality. Trading under fatigue or emotional stress increases the likelihood of errors.
Common Pitfalls and How to Avoid Them
Overtrading is one of the most consistent causes of capital erosion. Frequent trading increases exposure to market noise and reduces decision quality. High-quality setups are more important than high-frequency activity.
Confirmation bias leads traders to ignore contradictory information, reinforcing incorrect positions. Successful traders actively seek opposing viewpoints to test their assumptions.
Recency bias distorts expectations by overemphasizing recent performance. Each trade is statistically independent, and short-term outcomes do not guarantee future results.
FOMO-driven entries often lead to poor risk-reward ratios. Entering after major price movements reduces upside potential and increases downside exposure.
Ignoring fees, funding rates, and execution costs can significantly reduce net profitability, especially in high-frequency strategies. These costs must always be included in trade planning.
Advanced Considerations for Experienced Traders
Advanced traders expand into derivatives markets, including futures and options. These instruments allow hedging, short exposure, and more complex risk structures, but require deeper understanding of leverage and volatility.
Arbitrage strategies exist across exchanges and derivatives markets, although competition has reduced many simple inefficiencies. These strategies require speed, capital, and careful risk management.
Algorithmic trading allows systematic execution of strategies without emotional interference. However, it requires technical expertise, backtesting, and ongoing monitoring to remain effective in changing market conditions.
Cross-chain ecosystems introduce additional opportunities as blockchain interoperability increases. Understanding multiple networks can help identify early-stage trends and capital rotation opportunities.
Success in cryptocurrency trading is not defined by short-term gains but by long-term survival, discipline, and adaptability. The market rewards those who prioritize capital preservation, structured decision-making, and continuous learning.
.@Gate_Square @Gate广场_Official
repost-content-media
  • Reward
  • 6
  • Repost
  • Share
User_any:
2026 GOGOGO 👊
View More
#USIranNegotiation
As of May 27 2026 the United States and Iran remain engaged in one of the most important diplomatic negotiations of the modern financial era. What began as a major military confrontation earlier in 2026 has evolved into a fragile peace process capable of reshaping energy markets inflation trends cryptocurrency adoption and global investment flows for years ahead.
The conflict triggered extreme volatility across nearly every major asset class including oil gold equities bonds and digital assets. Investors worldwide are now closely monitoring every diplomatic statement becaus
HighAmbition
#USIranNegotiation
As of May 27 2026 the United States and Iran remain engaged in one of the most important diplomatic negotiations of the modern financial era. What began as a major military confrontation earlier in 2026 has evolved into a fragile peace process capable of reshaping energy markets inflation trends cryptocurrency adoption and global investment flows for years ahead.
The conflict triggered extreme volatility across nearly every major asset class including oil gold equities bonds and digital assets. Investors worldwide are now closely monitoring every diplomatic statement because the outcome of these negotiations could determine whether the global economy enters a new recovery phase or experiences another wave of inflationary and geopolitical instability.
The relationship between diplomacy energy markets and digital finance has never been more interconnected than it is today.
The Origins of the 2026 US-Iran Conflict
The current negotiations emerged after a rapid military escalation during early 2026 when the United States and Israel launched coordinated strikes against Iranian military and nuclear infrastructure targets. Iran responded through regional military operations and by threatening strategic maritime routes throughout the Persian Gulf.
The most critical development was the disruption of the Strait of Hormuz which remains the world’s most important energy shipping corridor. Roughly 21 million barrels of oil per day normally pass through the Strait making it essential for global trade and energy stability.
The closure of parts of the Strait immediately triggered a historic commodity shock across international markets.
Immediate Global Consequences
Brent crude surged from approximately $70-$75 toward $120 per barrel
WTI crude climbed above $110
Global gasoline and diesel prices accelerated sharply
Shipping insurance costs exploded higher
Inflation fears intensified globally
Safe haven demand increased rapidly
Bitcoin volatility expanded significantly
Global central banks faced policy uncertainty
By the 88th day of the conflict President Donald Trump stated that negotiations were progressing toward a potential framework agreement designed to reopen the Strait and stabilize markets.
The Latest Negotiations — Current Situation
As of May 27 2026 negotiations remain active but unresolved. President Trump announced on May 24 that a preliminary memorandum of understanding had been “largely negotiated” between both sides.
The proposed framework includes:
A temporary 60-day ceasefire extension
Reopening and demining of the Strait of Hormuz
Partial restoration of regional oil exports
Discussions regarding sanctions relief
Negotiations over Iranian nuclear activities
Gradual reduction of military escalation
Iran’s Core Demands
Iran continues demanding:
Full end to military operations
Removal of portions of the US naval blockade
Access to frozen overseas assets
Restoration of unrestricted oil exports
Guarantees regarding sovereignty
Reduction of foreign military pressure
US Strategic Objectives
The United States continues prioritizing:
Restrictions on uranium enrichment
Disposal or reduction of highly enriched uranium stockpiles
Long-term monitoring agreements
Maritime security guarantees
Protection of global energy routes
Despite progress significant disagreements remain unresolved and markets continue reacting to every development.
Oil Markets — The Center of Global Volatility
Oil markets remain the most sensitive component of the entire geopolitical situation.
Current Oil Prices
As of May 27 2026:
Brent crude trades near $96.22
WTI crude trades near $90.09
These prices remain substantially above pre-war levels despite recent declines.
Oil Market Timeline
Initial Conflict Phase
Brent surged beyond $120
WTI crossed $110
Energy inflation accelerated globally
Negotiation Optimism
Brent dropped nearly 4.5%
Markets priced in potential reopening of Hormuz
Shipping fears eased temporarily
Renewed Military Tensions
Oil rebounded another 4%
Traders feared renewed supply disruptions
Volatility returned immediately
Why Hormuz Matters So Much
The Strait of Hormuz handles:
Roughly 20% of global oil trade
Massive LNG shipments
Critical Asian energy imports
Even partial disruptions create severe supply chain instability for:
China
India
Japan
South Korea
European economies
Oil Forecast Scenarios
Bullish Oil Scenario
If negotiations collapse:
Brent could revisit $110-$125
WTI may exceed $115
Inflation pressure intensifies
Bearish Oil Scenario
If the Strait fully reopens:
Brent could decline toward $80-$85
WTI may stabilize near $75-$80
Gold Markets — Safe Haven vs Risk Recovery
Gold experienced highly volatile trading behavior throughout the conflict.
Current Gold Prices
Spot gold fluctuates between $4,500-$4,560
Gold futures reached roughly $4,713
Intraday swings remain historically elevated
Why Gold Became Unstable
Gold normally rises during wars but several competing forces affected price action:
Bullish Forces
Geopolitical fear
Inflation concerns
Dollar weakness
Central bank demand
Bearish Forces
Equity market resilience
Rising Treasury yields
Improved ceasefire expectations
Profit taking
Technical Gold Outlook
Bullish Scenario
Break above $4,700
Potential rally toward $5,000+
Bearish Scenario
Breakdown below $4,400
Possible decline toward $4,000
Kitco analysts currently describe gold momentum as unstable with strong sensitivity to geopolitical headlines.
Bitcoin and Crypto Markets — Digital Assets Enter Geopolitics
One of the biggest stories of 2026 has been Bitcoin’s emergence as a geopolitical macro asset.
Bitcoin Current Price Range
As of May 27 2026:
Bitcoin trades between $75,500-$77,300
Despite extreme volatility Bitcoin has outperformed many traditional safe haven assets during parts of the conflict.
Bitcoin’s Performance During The War
Since February 2026:
Bitcoin gained roughly 25%
Gold experienced periods of weakness
Institutional crypto participation increased
Why Bitcoin Benefited
Several factors supported BTC:
Inflation Hedge Narrative
War-driven inflation strengthened Bitcoin’s digital scarcity narrative.
Weakening Dollar
Dollar softness increased demand for alternative stores of value.
Institutional Adoption
ETF participation and corporate treasury accumulation continued.
Geopolitical Utility
Iran introduced “Hormuz Safe” a Bitcoin-backed shipping insurance framework tied to regional trade activity.
This marked one of the first major integrations of crypto into geopolitical infrastructure planning.
Ethereum and Altcoins During The Crisis
Ethereum remained under pressure despite continued institutional interest.
Ethereum Current Prices
ETH trades near $2,070-$2,100
Down sharply from 2025 highs
Major Ethereum Challenges
Risk-off sentiment
Slower ETF inflows
High interest rates
Layer-1 competition
Institutional ETH Accumulation
Despite bearish price action companies like BitMine continued aggressively accumulating Ethereum.
This signals that institutions still view current prices as long-term opportunity zones.
Global Equity Markets — Surprising Strength
One of the most surprising developments has been the resilience of global stock markets.
Current Major Index Levels
S&P 500 futures near 7,559
Nasdaq futures around 30,202
Dow futures near 50,791
Why Stocks Stayed Strong
AI Boom
Artificial intelligence investment remains the largest market driver.
Strong Corporate Earnings
Q1 earnings growth approached 29% year over year.
Liquidity Expectations
Markets still expect eventual monetary easing later in the cycle.
Technology Leadership
Companies tied to semiconductors AI infrastructure and cloud computing continue leading global capital flows.
Federal Reserve and Inflation Pressures
The Federal Reserve faces one of its most difficult policy environments in decades.
Core Problems Facing The Fed
Energy inflation remains elevated
Oil prices remain unstable
Economic growth is slowing
Financial markets remain sensitive
Treasury Yield Situation
10-year Treasury yields fluctuate between 4.46%-4.58%
Bond markets continue pricing inflation uncertainty
PCE Inflation Data
The May 29 PCE inflation release is viewed as critical because it may reveal:
The inflationary impact of the war
Energy pass-through effects
Consumer demand conditions
Iran’s Crypto Expansion Strategy
Iran’s growing integration of cryptocurrency into economic infrastructure represents a major long-term development.
Key Crypto Strategies
Increased Bitcoin settlement usage
Stablecoin expansion
Sanctions workaround systems
Bitcoin-backed maritime insurance
Why This Matters
This creates:
Additional global BTC demand
Higher crypto geopolitical relevance
Regulatory concerns for western governments
Crypto is no longer purely speculative technology. It is increasingly becoming part of international financial strategy.
Market Scenarios Going Forward
Scenario One — Framework Agreement Achieved
Probability: Moderate
Outcomes:
Strait reopens gradually
Oil declines toward $80-$90
Equities rally further
Bitcoin strengthens above $80,000
Gold weakens moderately
This remains the market’s current base expectation.
Scenario Two — Negotiations Collapse
Probability: Moderate Risk
Outcomes:
Military escalation resumes
Oil surges above $110
Inflation spikes globally
Equities correct sharply
Bitcoin volatility intensifies
Gold rallies aggressively
This scenario represents the largest immediate risk for markets.
Scenario Three — Comprehensive Long-Term Deal
Probability: Low
Outcomes:
Permanent ceasefire
Nuclear agreement achieved
Iranian oil fully returns
Global growth accelerates
Energy costs normalize
Risk assets experience major expansion
This would create one of the strongest global macro recovery environments in years.
Diplomacy Now Drives Markets
The 2026 US-Iran negotiations demonstrate how deeply interconnected geopolitics energy and digital finance have become. Oil prices gold Bitcoin Treasury yields and stock markets are now reacting almost instantly to diplomatic headlines.
The reopening of the Strait of Hormuz could stabilize inflation improve global growth expectations and support risk assets worldwide. However unresolved disagreements continue creating uncertainty across every financial market.
Bitcoin’s role has evolved dramatically during this conflict moving beyond speculation into geopolitical relevance while oil remains the central driver of inflation and macroeconomic stability.
As of May 27 2026 investors remain focused on one central question:
Will diplomacy restore stability or will renewed conflict trigger another global financial shock?
The answer may shape the direction of global markets for the rest of the decade.#DailyPolymarketHotspot #StockTradingChallengeUpTo17000U #TrumpBacksCFTCAuthorityOverPredictionMarkets
repost-content-media
  • Reward
  • 8
  • Repost
  • Share
Vortex_King:
To The Moon 🌕
View More
Gate.AI: More than a trading assistant, it’s the new gateway to AI-powered Web3 integration. ✨
One-stop hub for conversational interaction, market insights, cross-chain queries and DeFi support. Natural language simplifies operations and elevates your efficiency in information processing and decision-making.
🎯 Experience the new way to interact: https://gate.ai/@Gate_Square @Gate广场_Official #TradeCFDWinGold
HighAmbition
Gate.AI: More than a trading assistant, it’s the new gateway to AI-powered Web3 integration. ✨
One-stop hub for conversational interaction, market insights, cross-chain queries and DeFi support. Natural language simplifies operations and elevates your efficiency in information processing and decision-making.
🎯 Experience the new way to interact: https://gate.ai/@Gate_Square @Gate广场_Official #TradeCFDWinGold
repost-content-media
  • Reward
  • 5
  • Repost
  • Share
Vortex_King:
2026 GOGOGO 👊
View More
#TradFi交易分享挑战
#xpt
May 25, 2026
Current Spot Price: $1,964.50/oz
Platinum is trading at $1,964.50 per ounce on May 25, 2026. This level sits 33% below the all-time high of $2,923/oz hit on January 26, 2026, but still reflects a massive 220%+ rally from early 2025 lows near $970/oz.
Recent Price History
The 2025-2026 rally occurred in three phases:
Phase 1 (Q2 2025): Rose from $970/oz to $1,200–$1,400/oz on strong Chinese jewellery demand.
Phase 2 (Q3 2025): Climbed to $1,600–$1,750/oz amid US critical minerals policy.
Phase 3 (Dec 2025–Jan 2026): Final surge to $2,923/oz on geopolitical ris
XPT0.92%
HighAmbition
#TradFi交易分享挑战
#xpt
May 25, 2026
Current Spot Price: $1,964.50/oz
Platinum is trading at $1,964.50 per ounce on May 25, 2026. This level sits 33% below the all-time high of $2,923/oz hit on January 26, 2026, but still reflects a massive 220%+ rally from early 2025 lows near $970/oz.
Recent Price History
The 2025-2026 rally occurred in three phases:
Phase 1 (Q2 2025): Rose from $970/oz to $1,200–$1,400/oz on strong Chinese jewellery demand.
Phase 2 (Q3 2025): Climbed to $1,600–$1,750/oz amid US critical minerals policy.
Phase 3 (Dec 2025–Jan 2026): Final surge to $2,923/oz on geopolitical risk and monetary easing.
After the sharp correction in late January (from $2,923 to near $1,900), platinum has consolidated between $1,900–$2,050. It recently found support at $1,900–$1,950 and is rebuilding momentum at current $1,964.50.
Key Milestones:
All-Time High: $2,923 (Jan 26, 2026)
Jan 14, 2026: $2,399.65
2025 High: $1,747
52-Week Range: $971.60 – $2,923.66
Current: $1,964.50
Supply-Demand Fundamentals
Persistent structural deficits remain the core bull driver. WPIC projects deficits continuing through 2029 with above-ground stocks at critically low levels (under 3 months of demand).
Supply:
South Africa (70-75% of mine supply) faces high costs and geological limits.
Recycling up ~9% in 2026 but constrained by credit and scrappage delays.
Demand (diversified):
Automotive (~40%): Stable despite minor 2% decline forecast.
Jewellery (~25-30%): Strong substitution due to gold-to-platinum ratio at 2.35–2.50 (vs historical 1.0–1.5).
Industrial (~20-25%): Record high expected in 2026, +14% growth, boosted by AI and refining.
Investment: Bar/coin demand +33% in 2026.
Hydrogen economy could add nearly 900 koz demand by 2030.
Macro Drivers
Gold Correlation: Gold near $4,600–$4,700/oz. Extreme ratio supports platinum as value play.
Rates: Easing expectations supportive; higher rates remain a risk.
Geopolitics: Iran tensions keep safe-haven flows alive and oil above $100/bbl.
USD/ZAR: Key cost driver for South African production.
Technical Analysis
Platinum stays in a long-term ascending channel. TradingView consensus: BUY.
Resistance: $2,050 (immediate), $2,100, $2,299 (2008 high), $2,400–$2,500, $2,923.
Support: $1,900–$1,950, $1,575, $1,500, $1,250–$1,300.
RSI neutral-bullish. Price above key moving averages with elevated lease rates confirming physical tightness.
CFD Trading Considerations (XPT/USD)
Contract size: 1 oz
Typical spread: $4–$5
Leverage: 1:10 to 1:50
At $1,964.50: 1 lot (100 oz) = $196,450 notional.
$1 move = $100 P/L per lot.
Long Strategy: Break above $2,050 targets $2,100 then $2,299. Stop below $1,900.
Risk Management: Max 2% account risk, hard stops, max 1:20 leverage.
Price Forecasts
Metals Focus: +71% in 2026 (implies well above $3,000 potential).
Bank of America: ~$2,450 for 2026.
TradersUnion: $2,472.85 end-2026, $2,594.79 by 2029.
WPIC: Robust investment demand, deficits through 2029.
Scenario Targets:
Bullish: $2,400 – $2,923+
Base: $2,100 – $2,450
Bearish: $1,500 – $1,900
Risks
Iran resolution (major downside catalyst)
Sharp rate hikes
Faster EV shift
Stronger recycling supply
Platinum vs Gold
At ratio 2.35–2.50, platinum offers relative value. Reversion to 2.0 could push platinum to $2,350–$2,600 even if gold stays near $4,700.
At $1,964.50, platinum offers a compelling setup with strong structural deficits, diversified demand, and attractive valuation versus gold. Traders should watch $2,050 breakout for bullish continuation while maintaining strict risk controls given volatility (52-week swing of over 200%).@Gate_Square @Gate广场_Official #TradeCFDWinGold #StockTradingChallengeUpTo17000U #DailyPolymarketHotspot
repost-content-media
  • Reward
  • 3
  • Repost
  • Share
Vortex_King:
To The Moon 🌕
View More
  • Pinned