CryptoForestKai

vip
Age 0.1 Year
Peak Tier 10
5-year professional trading career | Focused on cryptocurrency intraday contracts with an overall short-term success rate of 87% | Industry-certified intraday contract swing king. Dedicated to practical trading, rejecting hindsight analysis. Follow me to accurately grasp market trends.
Pin
Welcome to my plaza chat, where we discuss daily operational ideas!
https://gate.onelink.me/Hls0/group?chatroom=xpYCOe3293&ref=VFJFVVXFAW&ref_type=105
View Original
post-image
  • Reward
  • 1
  • Repost
  • Share
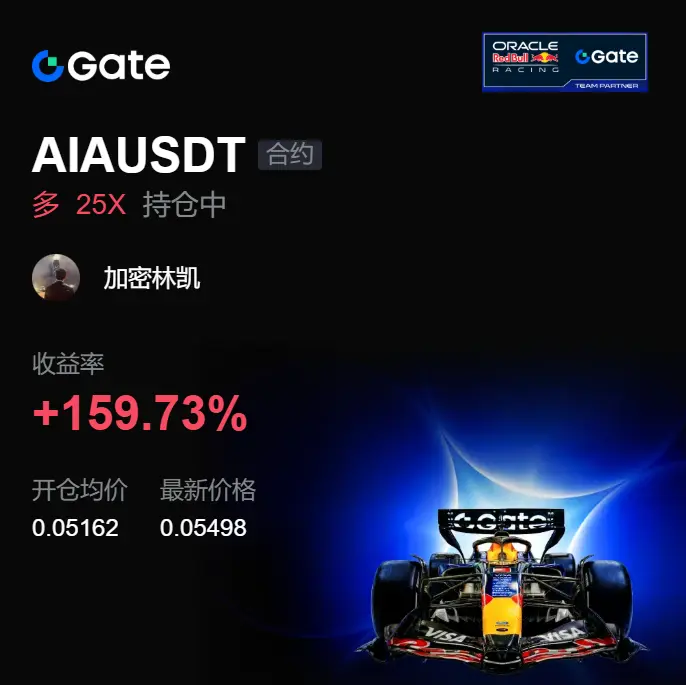
This $AIA long finally played out—here are the results first: from 0.05162 to 0.05498 now, current profit +159.73%, and the market’s room in this leg was released really cleanly.

Back then, I wasn’t watching for a single bullish candle, but for a pullback that couldn’t break, key levels being lifted, and volume starting to pick up. A lot of people were still worried about a fake breakout then, but the chart gave me a different feel—the structure had clearly changed. The bears couldn’t push it down, and the bulls had reasons to keep pushing.

What really made me deepen my judgment was the fo
AIA2.95%
BTC2.09%
ETH2.95%
View Original
post-image
  • Reward
  • Comment
  • Repost
  • Share
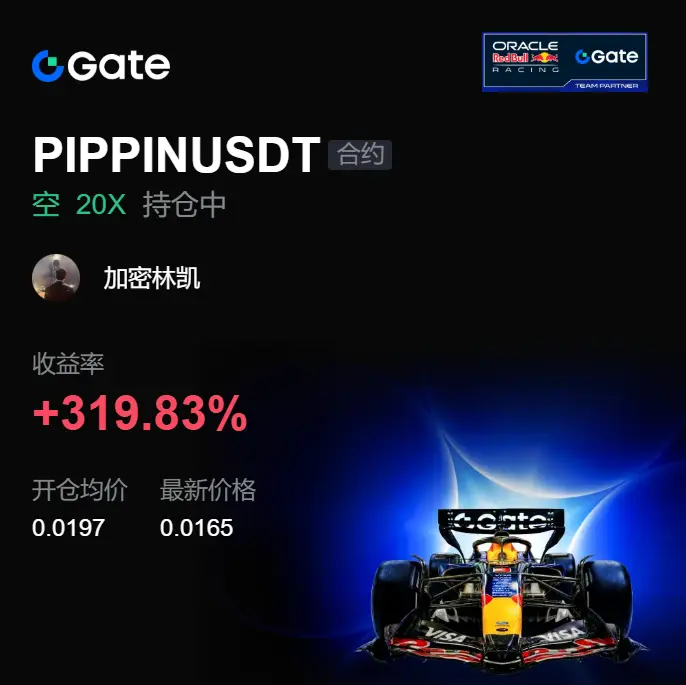
This short position finally pays out—what the chart is giving is very straightforward. When $PIPPIN first surged higher, many people were still chasing it. Back then, I wasn’t focused on how violently it was pumping; I was watching how it kept facing consecutive resistance overhead, and then the buy-side started to fall behind.
After opening the short around 0.0197, what truly confirmed it for me was that each subsequent bounce-back was weaker than the last—price didn’t keep expanding upward. Instead, it began to drop. Now it’s at 0.0164, and the unrealized profit is already +319.83%. The mark
PIPPIN-0.61%
BTC2.09%
ETH2.95%
View Original
post-image
  • Reward
  • Comment
  • Repost
  • Share
INJ sold off hard in this round—the first thing to change wasn’t the price, but the strength of the rebound; it’s been extremely weak.
I was watching the support after the $INJ pullback. When the price went up, nobody took it; when it came down, it moved smoothly. This kind of market action is the easiest to make chasing longs feel awful. I already paid attention to this level earlier—if the price can’t hold above the high, I’m going to look for a short. After entering around 5.542, the market didn’t give much hesitation; once the level broke, the shorts took over the pace immediately.
Now it’
INJ2.31%
BTC2.09%
ETH2.95%
View Original
post-image
  • Reward
  • Comment
  • Repost
  • Share
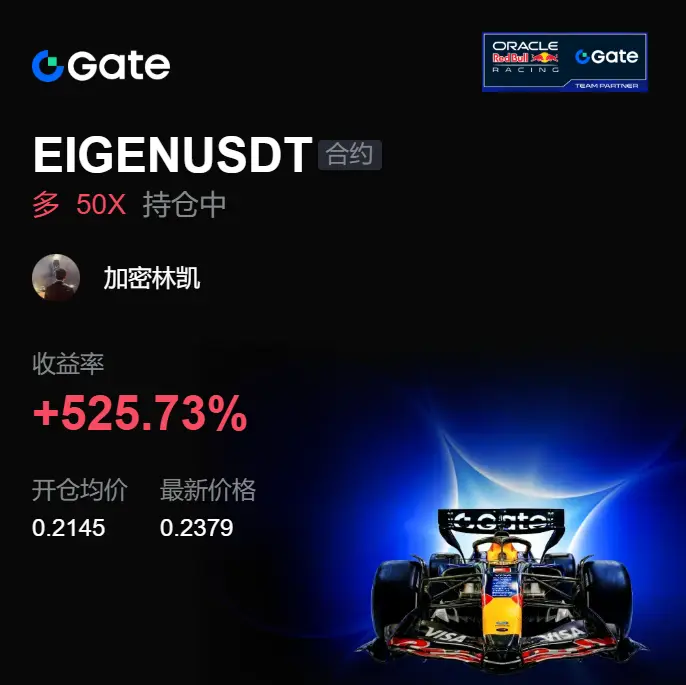
This wave of $EIGEN momentum clearly wasn’t pushed by retail on its own. It was held down to prevent a breakout at first; then suddenly, volume surged and it broke through. The long positions entered at 0.2145 are now at 0.2379—+525.73% has already been realized, and the order-book “taste” on the chart is very heavy.
What really caught my attention is that each time it pulled back, it was quickly picked up. The sell orders resting above look thick, but the moment they get touched, they get eaten. Many people thought the key level wouldn’t be able to hold, but the main players are actually usin
EIGEN-2.91%
BTC2.09%
ETH2.95%
View Original
post-image
  • Reward
  • Comment
  • Repost
  • Share
This drop isn’t unexpected—it’s the gap left by that earlier fake pump, and today it finally got driven down.
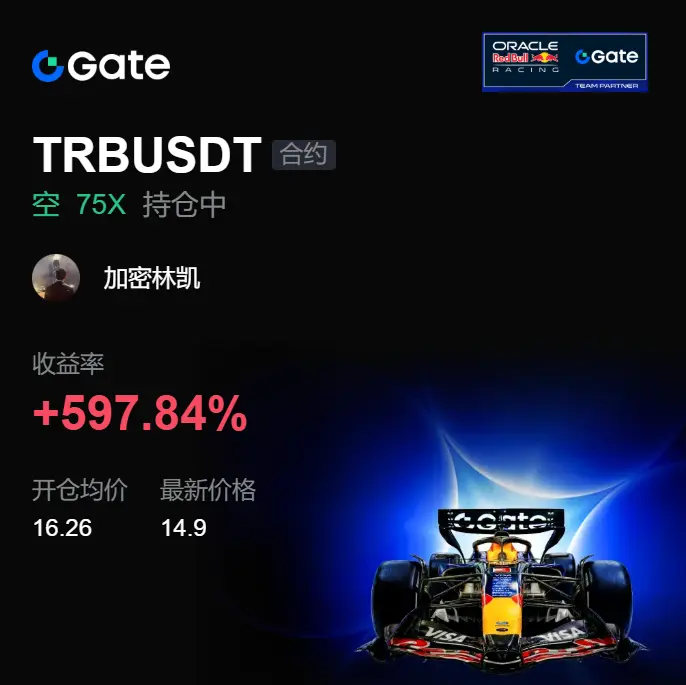
A few times at the $TRB high, attempts went in and couldn’t hold. It looks strong on the surface, but in reality it’s sweeping a batch of people who chased longs. The key is right here: many people see the pump and want to follow. What I see is that after the liquidity above gets consumed, the price starts to refuse to keep pushing higher. Around 16.26, I gave a short entry. I chose to follow the key level instead of being led by emotion.
Now the current price is 14.9, with an unrealiz
TRB-0.46%
BTC2.09%
ETH2.95%
View Original
post-image
  • Reward
  • Comment
  • Repost
  • Share
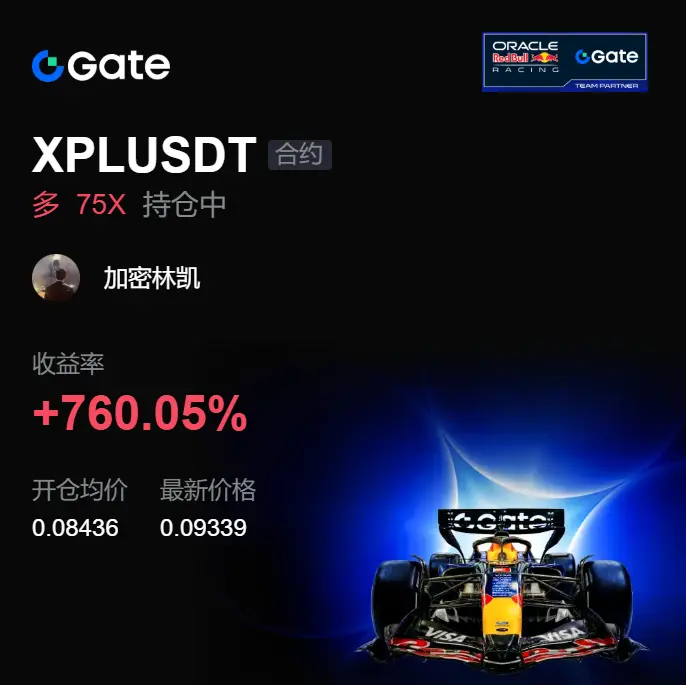
That sudden rally just now was interesting. The earlier wave of sharp drop scared a lot of people, but after $XPL failed to continue breaking down, it instead pushed from 0.08436 all the way to 0.09339, with longs up 760.05% in profit.
Back then, the most critical thing wasn’t how much it fell, but how fast it reclaimed after dipping. A lot of people panic when they see the sudden sell-off—the first reaction is that the market is going to get worse—but here it didn’t seem to be the case. After panic was shaken out, nobody was really willing to keep selling below.
I made this trade by watching
XPL1.54%
BTC2.09%
ETH2.95%
View Original
post-image
  • Reward
  • Comment
  • Repost
  • Share
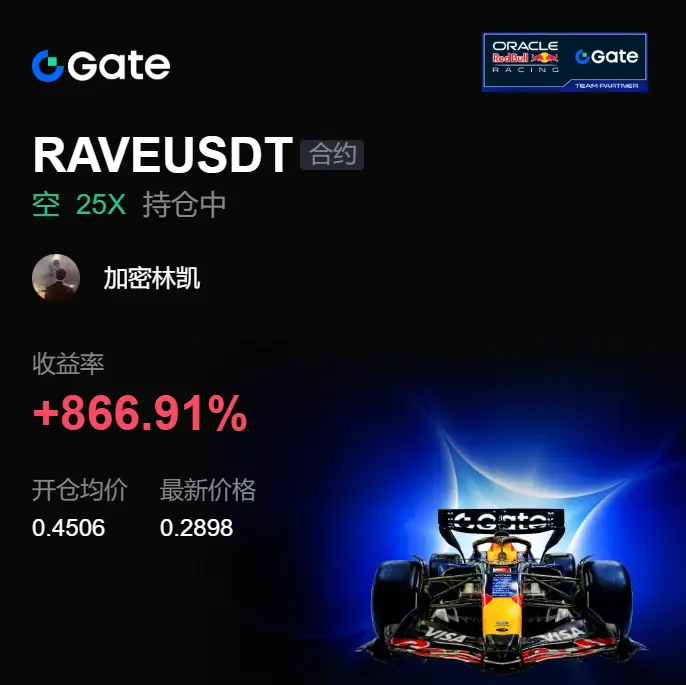
Many people were still yelling that RAVE was going to bounce a moment ago, but the chart directly answered—this time the shorts’ kick landed brutally.
Earlier, I was already watching that key level zone just above $RAVE . Before any signal appeared, I had observed the changes: the push up came without volume, the pullback followed through, and especially after it bounced back to the key level, it was immediately smashed down. For a market like this, I’m not going to bet on going long. I opened a short around 0.4506—the logic is simple: if you can’t hold on at the highs, then it will just slide
RAVE17.11%
BTC2.09%
ETH2.95%
View Original
post-image
  • Reward
  • Comment
  • Repost
  • Share
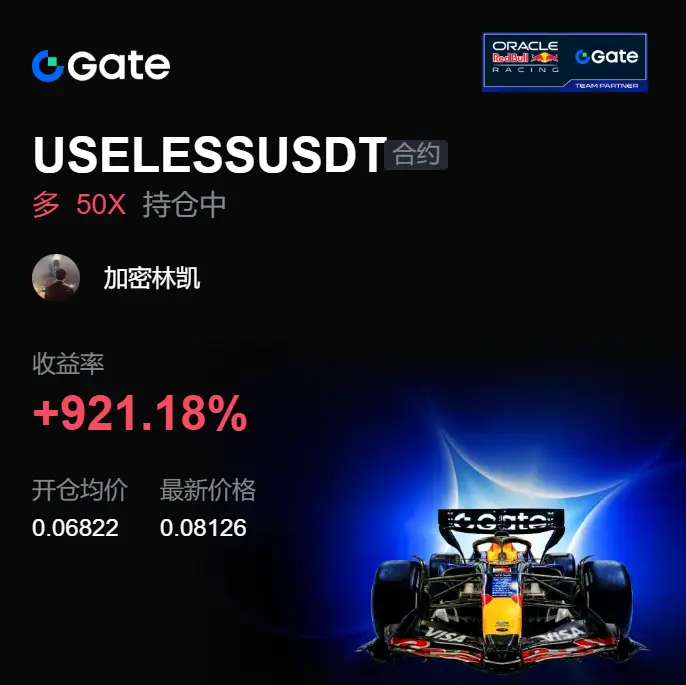
Many people are still hesitating, but $USELESS has already set the direction. Long positions went from 0.06822 to 0.08132, up +921.18%. This move isn’t a hard push based on emotions—it’s the rhythm, step by step, delivering the answer.

Earlier, I focused on the follow-through after the pullback, especially the several dips that didn’t continue to sell-volume-press through. This shows the bears’ pressure is starting to weaken. Before the signal appeared, I’d already observed the changes, so when the real move started, what I cared about more was whether price could hold the key zone—not guess
USELESS-6.99%
BTC2.09%
ETH2.95%
View Original
post-image
  • Reward
  • Comment
  • Repost
  • Share
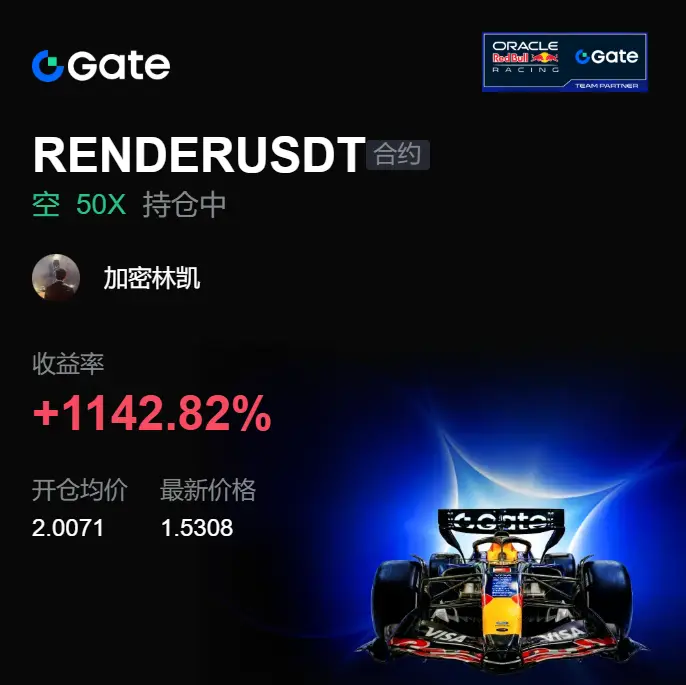
This short position finally paid off. $RENDER was pushed down from the highs—the pace was even more decisive than I expected.

At the time, I wasn’t focused on a single bearish candle. What I noticed was that price kept failing to move up: the successive breakouts couldn’t get traction, and each pullback was weaker than the last. A lot of people were still waiting for a breakout, but I felt something was already off here. After getting a fill around 2.0071, I entered the short. What truly confirmed it for me was that it couldn’t pull back up—buyers couldn’t step in and absorb the bids.

Now
RENDER0.89%
BTC2.09%
ETH2.95%
View Original
post-image
  • Reward
  • Comment
  • Repost
  • Share
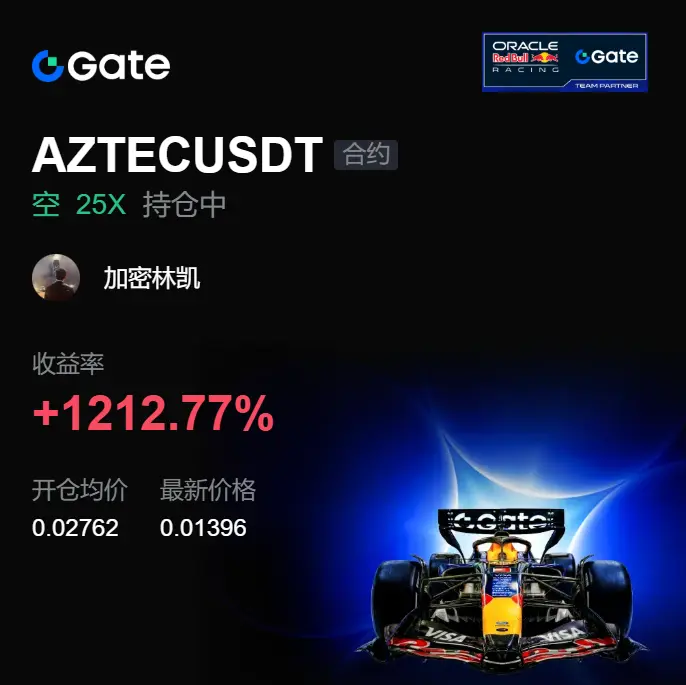
After these $AZTEC short positions were executed, the chart became very clear: it wasn’t suddenly getting weak; it had already been continuously sending signals earlier. Price couldn’t break up higher, but the key levels were slowly moving down. In this kind of position, I won’t fantasize that the bulls can come to the rescue.

I entered the short around 0.02762. Back then, I was watching the rebound strength and whether trading would follow through. The rebound didn’t keep up; instead, selling pressure became more and more obvious. Now the price is at 0.01401, profit is +1212.77%. The market
BTC2.09%
ETH2.95%
View Original
post-image
  • Reward
  • Comment
  • Repost
  • Share
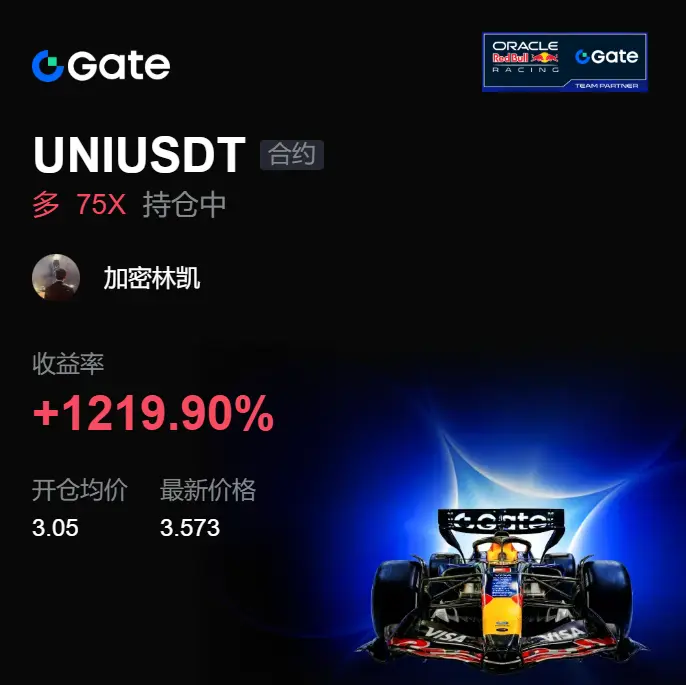
Right now, $UNI slapped the short sellers back to reality. A crowd of people were looking weak earlier, but the price pushed from 3.050 all the way to 3.575. Now you’re up +1222.23% in floating profit, and the trend is clearly extending. This move isn’t being shouted out—it’s being walked out on the chart.
What I was watching wasn’t whether the news was hot or not, but whether the price was repeatedly being held up in key zones. Every pullback gets bought up, which shows someone is quietly accumulating. When most people hesitate, opportunities are often already brewing. By the time everyone fi
UNI-1.55%
BTC2.09%
ETH2.95%
View Original
post-image
  • Reward
  • Comment
  • Repost
  • Share
$SUI ’s drop this round has been decisive. The most interesting part is that the more people at the front kept shouting for a rebound, the less the chart gave them any face. It started leaking once it had been chopping sideways at the top—what really got my attention was that after the follow-through weakened, the pullback couldn’t even reach the previous high.

I placed a short order around 1.0030. After entering, I didn’t rush to exit. I was watching the continuation strength after the breakdown. Now the price has come to 0.7517, and my return rate is +1206.58%. This isn’t luck—it’s trend-fo
SUI-0.64%
BTC2.09%
ETH2.95%
View Original
post-image
  • Reward
  • Comment
  • Repost
  • Share
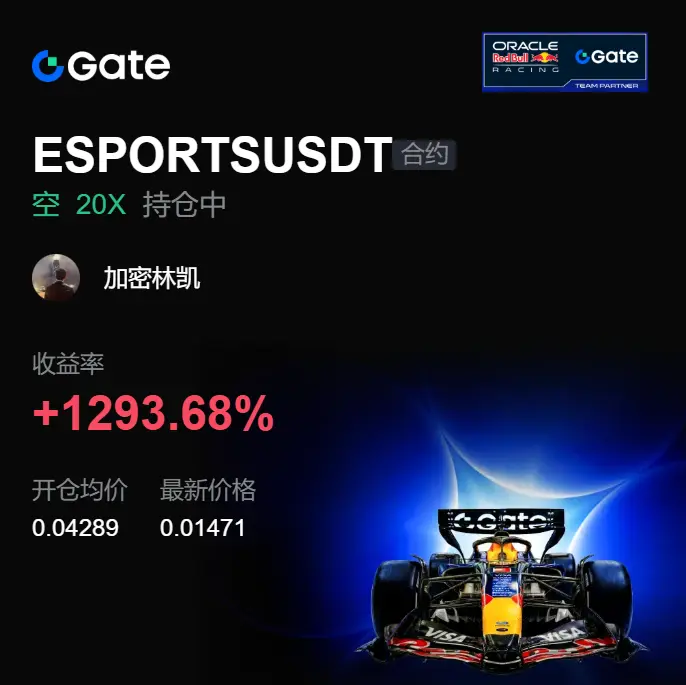
This trade isn’t a last-minute impulse, like the high-side moves of $ESPORTS . What I see isn’t strength—it’s holding on by force. The price keeps failing to push up, but the pullbacks are faster each time. In plain terms, this structure means the rhythm has changed.
Shorts entered around 0.04289. There was also fluctuation when opening, but the key here is: if the crucial level can’t be broken, the more it grinds, the easier it is to get smashed downward. The current price has now come to 0.01465, and the profit display shows +1294.6%. The short position has been closed out very smoothly, and
ESPORTS4.79%
BTC2.09%
ETH2.95%
View Original
post-image
  • Reward
  • Comment
  • Repost
  • Share
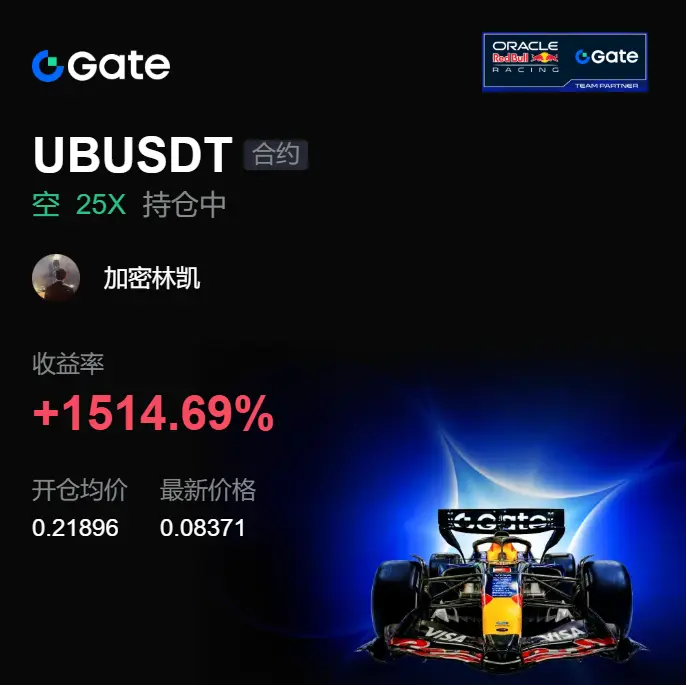
That sudden dump a moment ago caught many people off guard. The rhythm of $UB had already changed a long time ago. On the surface, it only looks like consolidation, but the real key is that every time it surged upward, it got pushed back down—showing that the overhead supply is loose and the bulls can’t hold it anymore.

I opened a short around 0.21896. I’d already noticed this level’s key support/resistance had been repeatedly effective, so I didn’t chase the long side. The price is now down to 0.08357, with unrealized profit of +1514.13%. The trend continuation is obvious; holding a trade
UB6.77%
BTC2.09%
ETH2.95%
View Original
post-image
  • Reward
  • Comment
  • Repost
  • Share
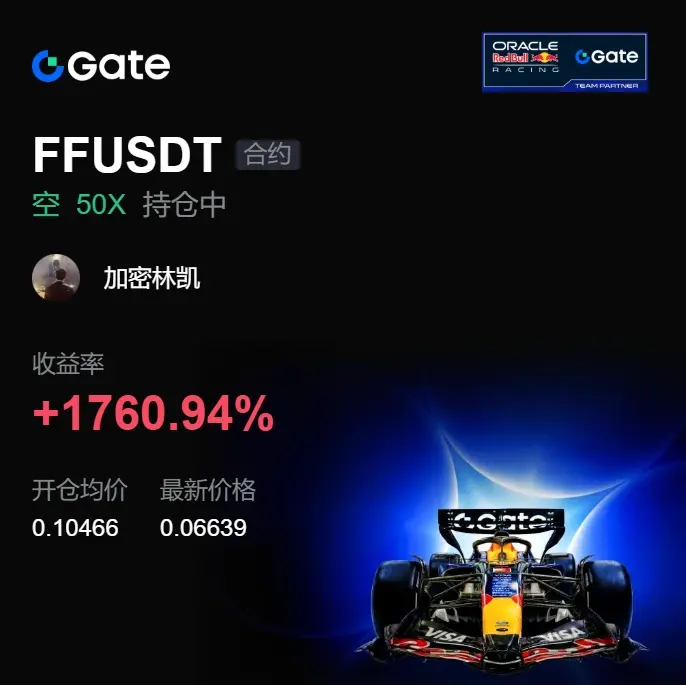
This batch of shorts finally paid off. The move where $FF was pushed down from the high was already very clear on the chart. Many people at the time were still waiting for a pullback and hoping it would keep pushing higher, but I was focused on the speed of the drop after it started facing resistance above—there was already something off there.

After entering around 0.10466, what really confirmed it was that the rebound kept getting weaker: the buy-side couldn't keep up, and the shorts continuously managed to suppress the tempo. Now the price is at 0.06644. This trade’s profit is already up
FF17.66%
BTC2.09%
ETH2.95%
View Original
post-image
  • Reward
  • Comment
  • Repost
  • Share
That quick break just now was essentially calling the game on all the hesitation in the previous stretch. When $ETH stays sideways at the high level, it looks strong on the surface, but every time it tries to surge, it gets pushed back. At that moment, I knew the bulls’ momentum had started to look shaky.

Before the signal came out, I had already observed the changes. After it gave the level near 2111.63, I went long directly according to plan. The key here is that it’s not that the price can’t rise—it's that once it goes up, nobody keeps buying. Instead, when it dips back, the sell orders f
ETH2.95%
BTC2.09%
SOL1.30%
View Original
post-image
  • Reward
  • Comment
  • Repost
  • Share
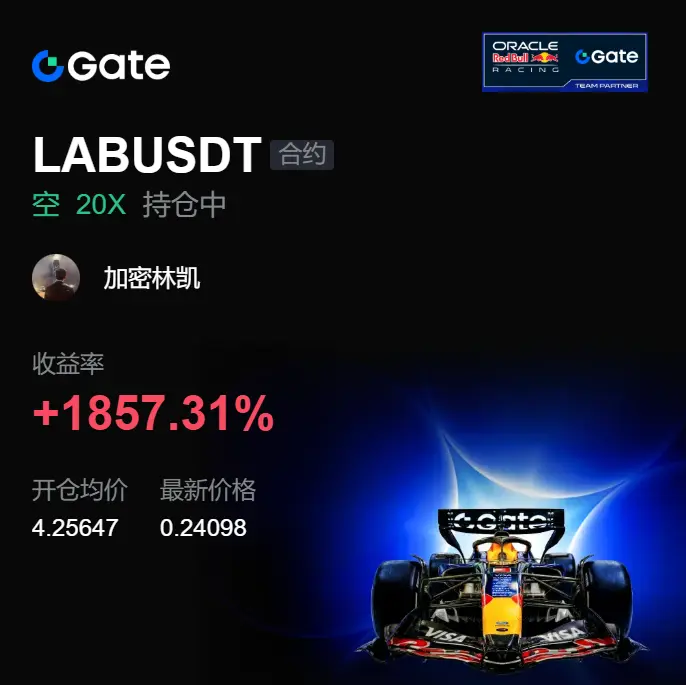
$LAB ’s drop this round is not the most impressive part because it only becomes clear after the fall—it’s that when it kept failing to break through at the highs, the funds were already pulling out. Many people only watch the surface-level ups and downs; I care more about whether someone is actually stepping in after each attempted push.
Around 4.25647, I chose to open a long. The reason is simple: the price gave a rebound, but it didn’t continue. What really caught my attention was that the sell limits above kept getting heavier. When the bid support thinned out, the shorts started to push alo
LAB-21.08%
BTC2.09%
ETH2.95%
View Original
post-image
  • Reward
  • 1
  • Repost
  • Share
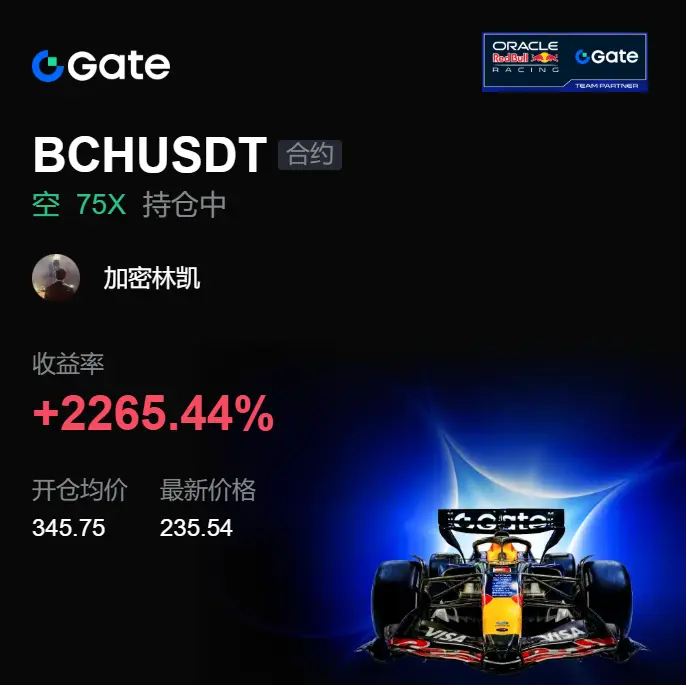
This sell-off is very typical: first lure people into the high position, then slowly break through the key levels. When $BCH first started to drop, many people thought it was just a normal shakeout, but what I saw was weaker and weaker support, with rebounds getting shorter and shorter.

At the time, I was watching how it rebounded around 345.75. Price couldn’t push higher and kept getting pressed back in succession. That already looked wrong, so I went long directly with a short-side mindset. The worst part isn’t that the market is falling—it’s that you can clearly see the structure has chan
BCH-1.96%
BTC2.09%
ETH2.95%
View Original
post-image
  • Reward
  • Comment
  • Repost
  • Share
  • Pinned