LiYangEncryption

vip
Active for: 1.4y
Market Analyst
Futures Trading Strategist
Specializing in medium- to long-term wave trading, sharing daily trading techniques, and various recovery strategies!
From Monday to Wednesday this week, a batch of key macroeconomic data will be released, including small non-farm payrolls employment, home prices, consumption, and EIA crude oil inventories, etc. This will directly affect the near-term direction of the US dollar, US Treasuries, and gold and crude oil, so market participants need to pay close attention to the volatility caused by the data. ​​​#CPI数据分析
GLDX0.95%
PAXG0.75%
XAU0.72%
View Original
post-image
  • Reward
  • 1
  • Repost
  • Share
Rajukhan75:
Hi Reality Hi hi Hi Hi Hi Hi
BTC
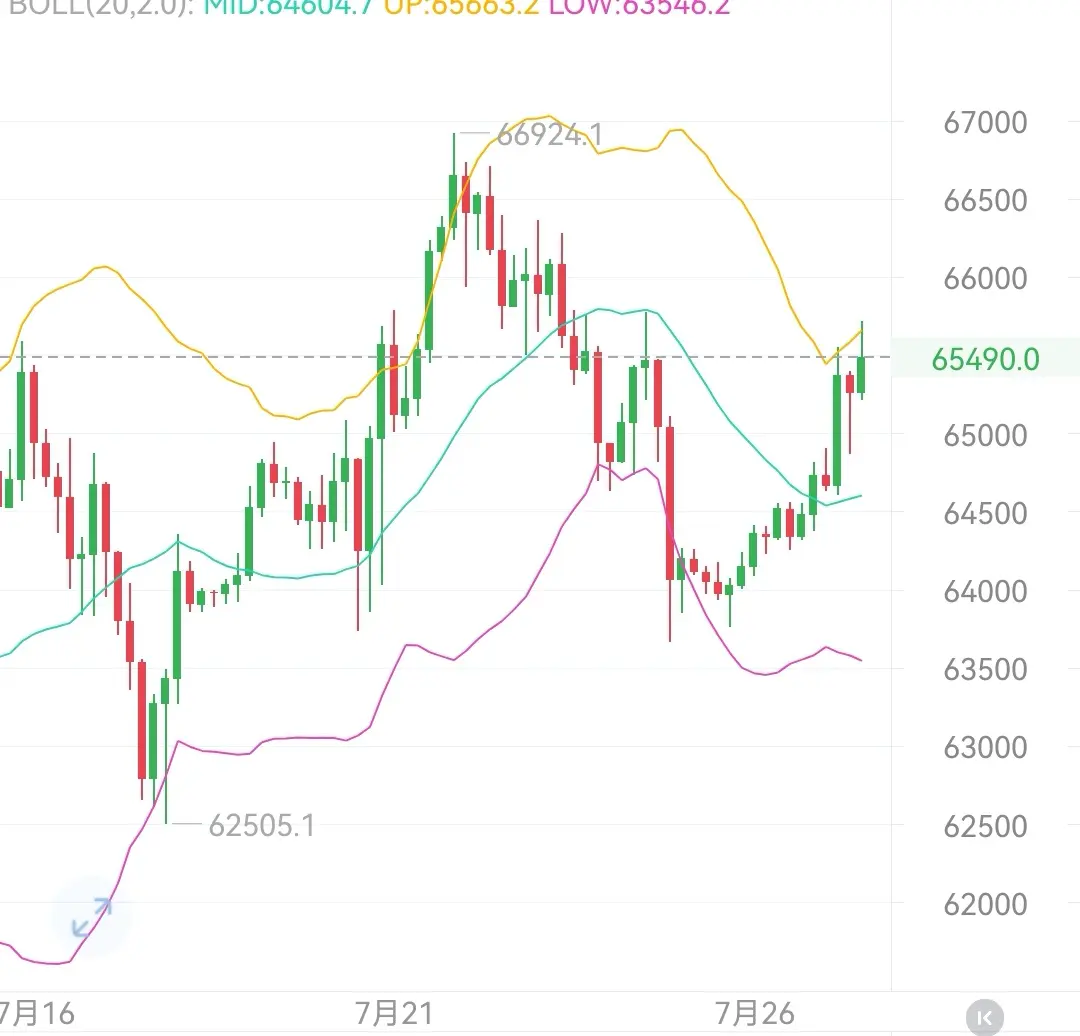
BTC today pay attention to the 648 level. As long as the 4-hour timeframe does not break below this position, the bulls will start to strengthen. Above, wait for short orders near 66150-67500-69500!
If today the 4-hour timeframe breaks below 648, then on the 1-2 hour timeframe it will start to pull back. Downside, wait for long orders near 637-626-615!
ETH
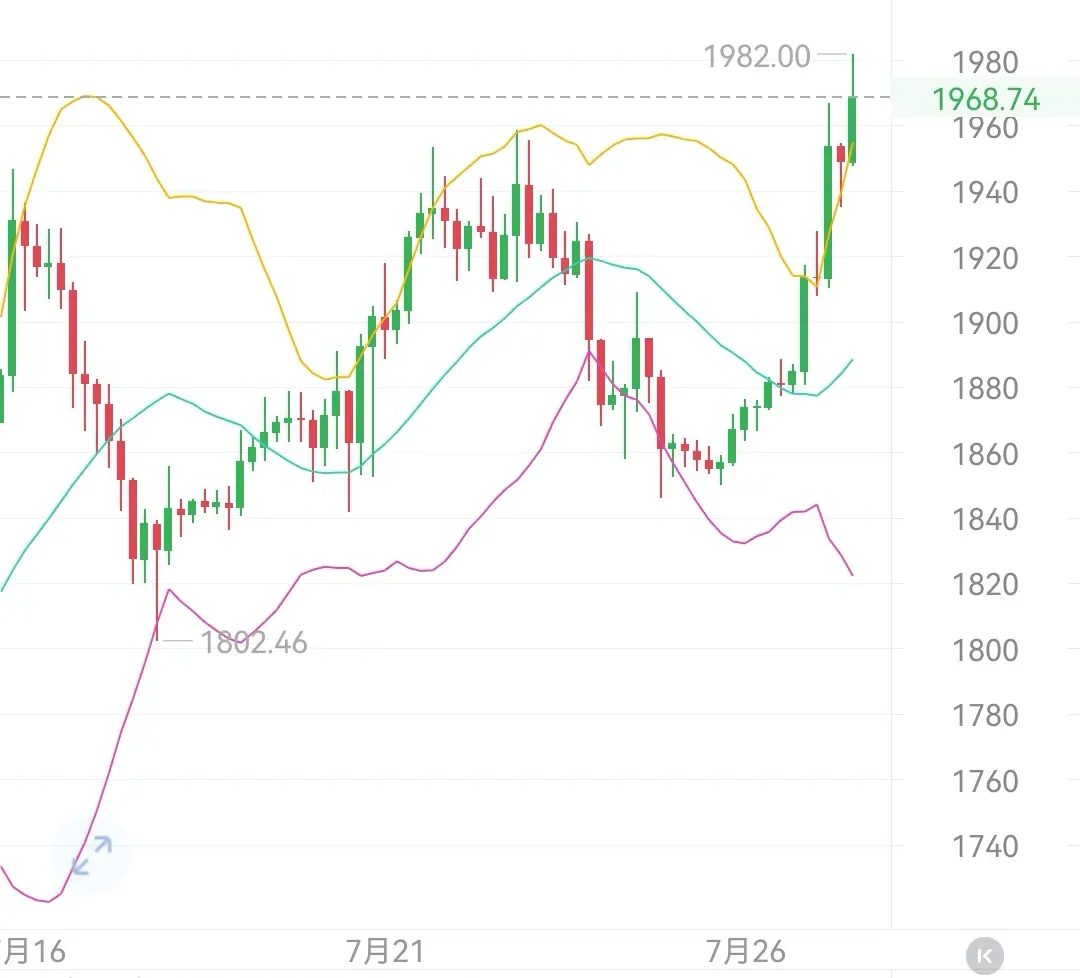
ETH has made new highs again. If the pullback support 1910-1900 does not break below this range, the market will stay in a bullish structure. Targets are 2000-2050. Longs are fine as long as 1900 is not broken; if it breaks, abandon the
BTC1.31%
ETH4.35%
SOL1.90%
BNB0.33%
View Original
post-image
post-image
  • Reward
  • Comment
  • Repost
  • Share
7, 27 morning market outlook analysis strategy:
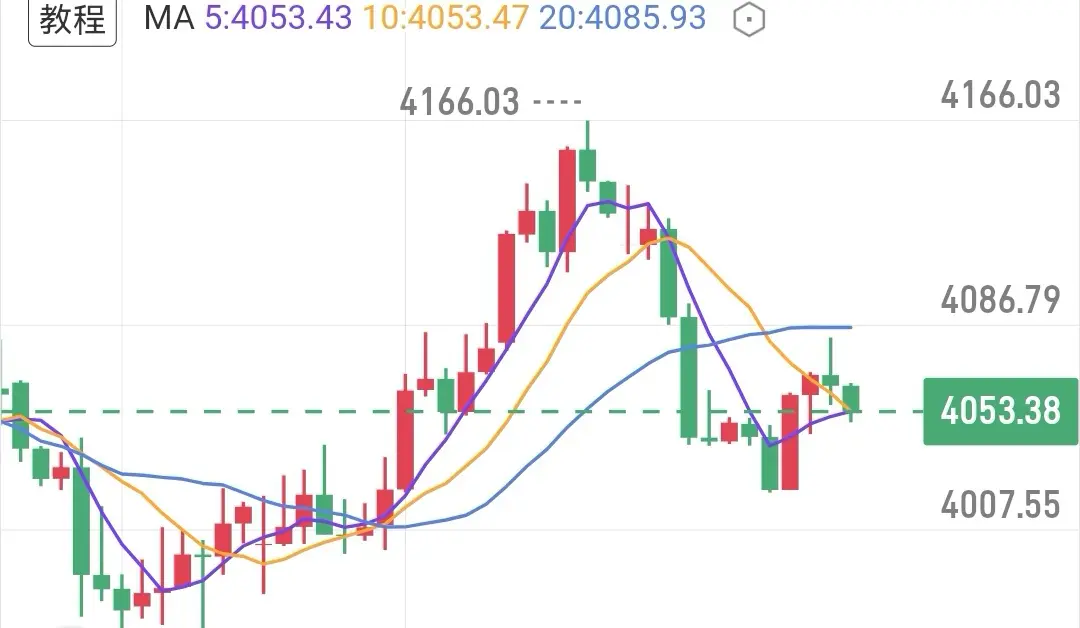
In the past few trading days, gold prices have remained trapped in a wide-range back-and-forth consolidation for a long time. In most of the ranges, the rise-and-fall rhythm has stayed consistent with our earlier predictions!
On the 4-hour timeframe, gold price is currently moving around the mean-line consolidation midline, where bulls and bears are fighting fiercely. The 20-period moving average at 4085.93 above forms the core resistance, while the prior low at 4007.55 below forms the key support. At this stage, the market has no clear one-way d
USIDX-0.20%
GLDX0.95%
PAXG0.75%
View Original
post-image
  • Reward
  • Comment
  • Repost
  • Share
7、25 Today’s market analysis directions:
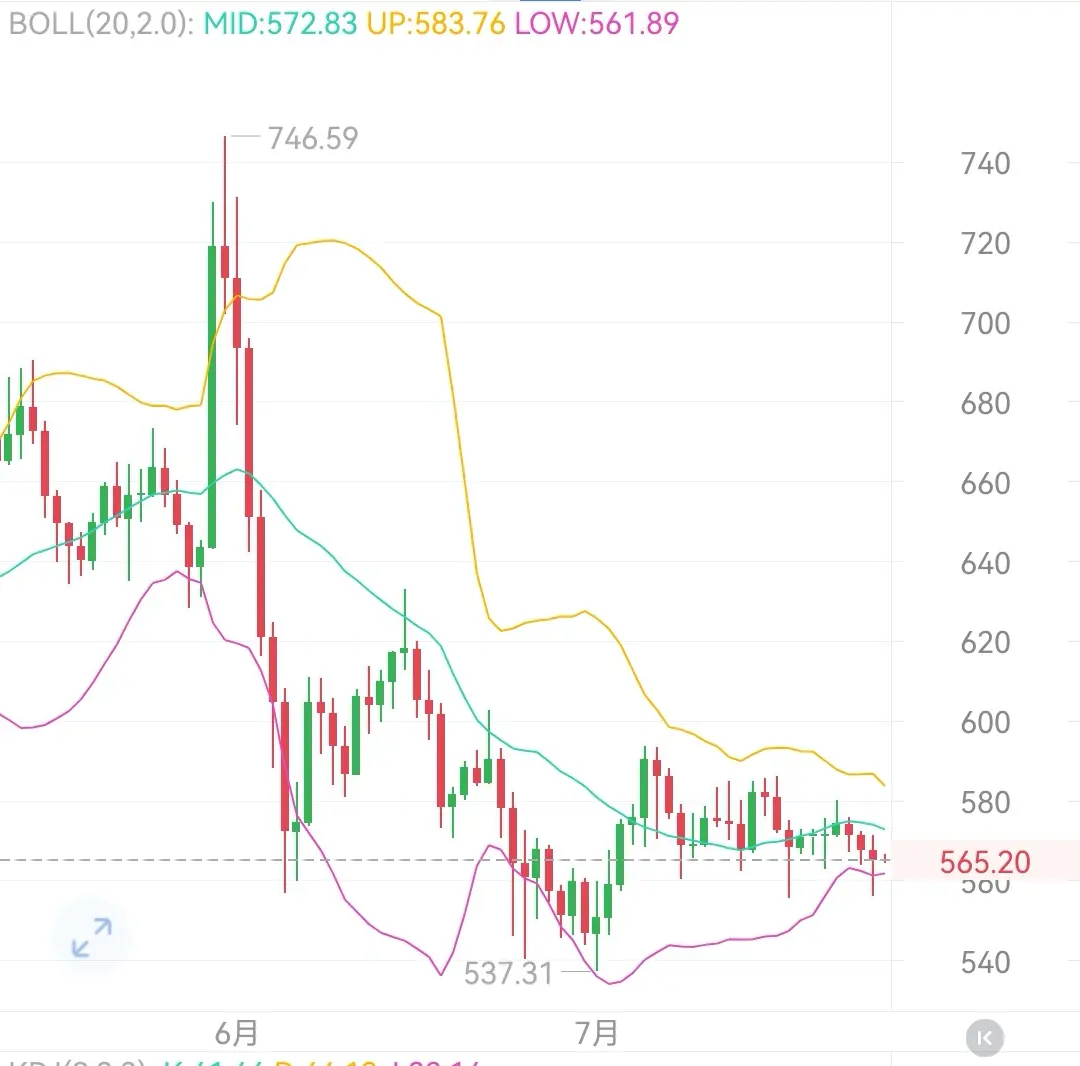
BNB’s rebound resistance remains unchanged at 575-580. In terms of trading, it’s recommended to wait for a breakout after 575 before chasing long positions; if it doesn’t break out, then wait for a wick/needle down near 555-545. For short-term short positions, only scalp/sell at 580! $BNB #BNB行情分析
BNB0.33%
View Original
post-image
  • Reward
  • Comment
  • Repost
  • Share
7、25 SOL today market trend suggestion:
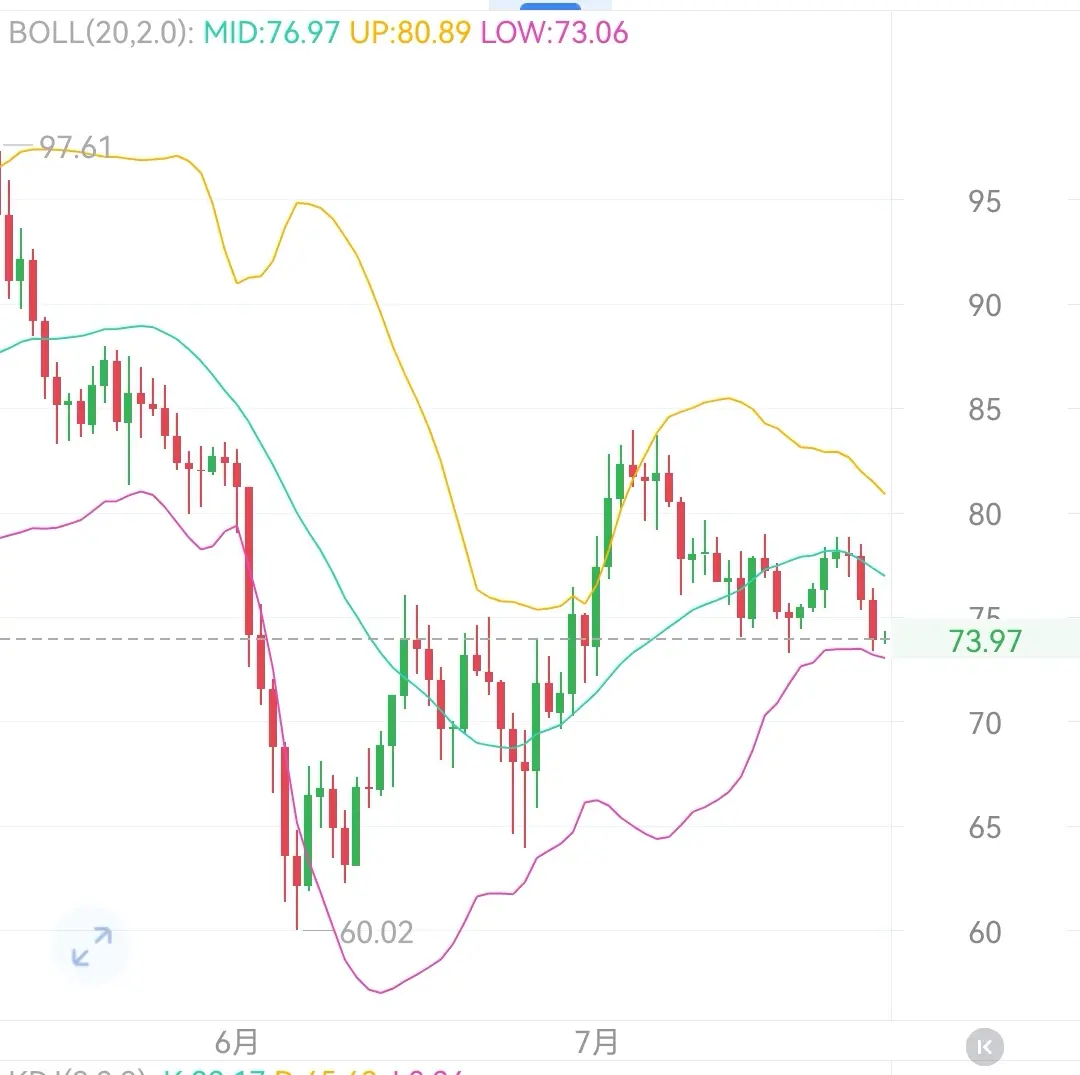
SOL is currently also breaking down in the daily chart pattern. For long positions, only consider “buying the dip” once it hits 75. For rebound resistance, first look at 77; only if 77 resistance can be broken will there be a chance to push higher toward 78-79. If it fails to break above 77 and then falls back below 75 again, the market will enter a new round of downside, with stop-pin targets at 73-72-70. Keep an eye on this range for possible longs! $SOL #SOL行情分析
SOL1.92%
View Original
post-image
  • Reward
  • Comment
  • Repost
  • Share
7/25 Today’s ETH market analysis and direction suggestions:
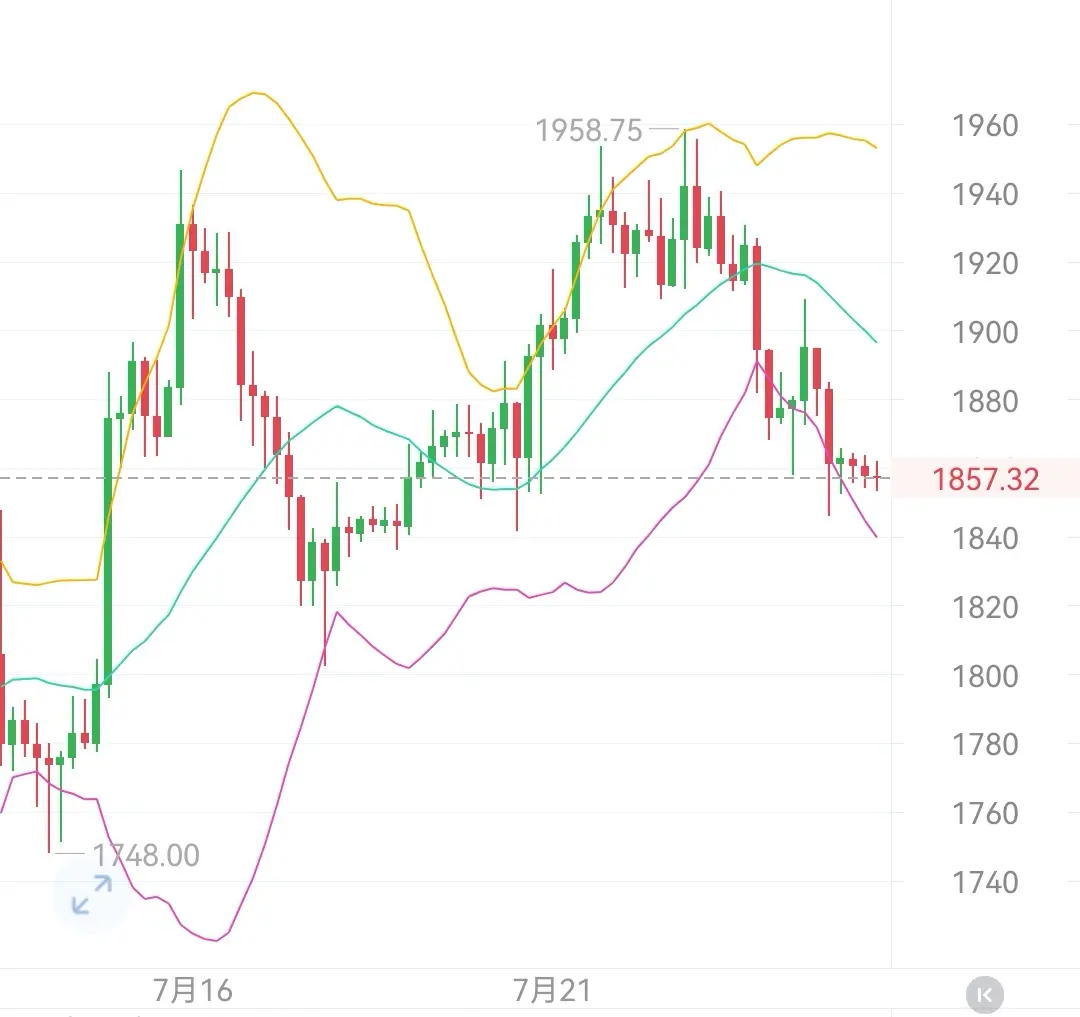
The daily chart pattern for ETH has broken down. This spike has just reached the target support. For long positions, enter longs only when it reaches 1858. For the rebound pressure, first watch for the second pressure at 1905—only if it can break through 1905 will there be a chance to push higher toward 1940-1950. If it can’t push through 1905 and instead breaks below 1858 again, the market will move into a new round of downside spike-pinning. The spike target is 1802-1780—keep an eye on this range for long entries. $ETH #ETH
ETH4.34%
View Original
post-image
  • Reward
  • Comment
  • Repost
  • Share
7、20 morning market outlook analysis strategy:
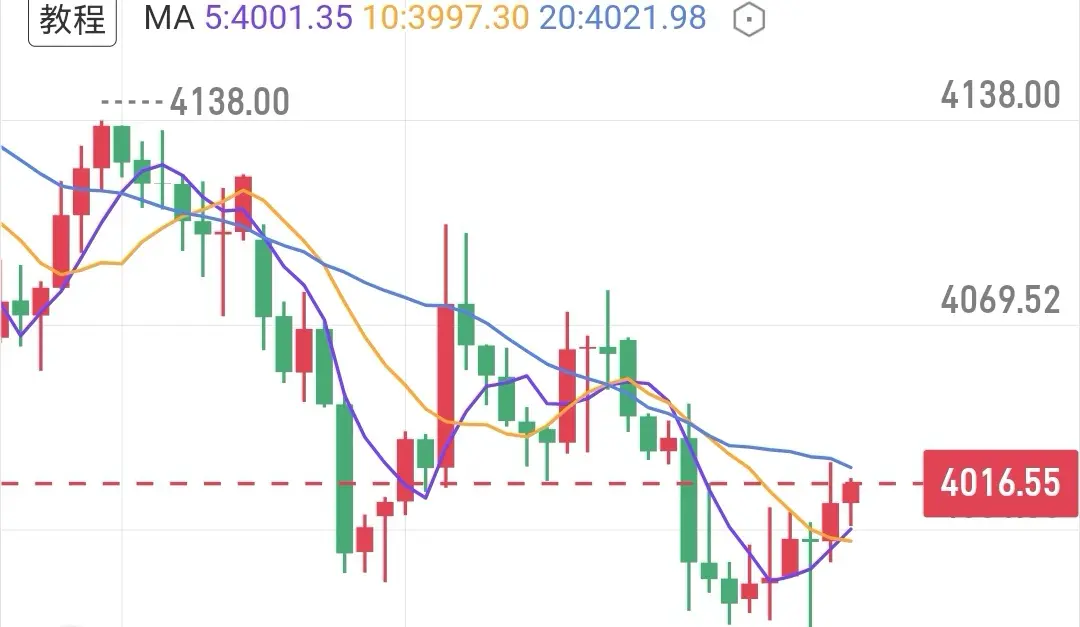
The four-hour moving average system shows a turn and repair. The short-term 5-period moving average crosses upward through the medium-to-long-term moving averages, temporarily easing the bearish pressure rhythm in this phase. The first major resistance above is the intraday high at 4023.72; next is the key pressure level at 4021.98. This level is the previous moving-average resistance point, and it is also the watershed for whether this rebound can continue. Below, the key supports in order are 4001 and the 3959 low; the former is the short-term b
GLDX0.95%
PAXG0.75%
View Original
post-image
  • Reward
  • Comment
  • Repost
  • Share
7、17 morning market outlook analysis strategy:
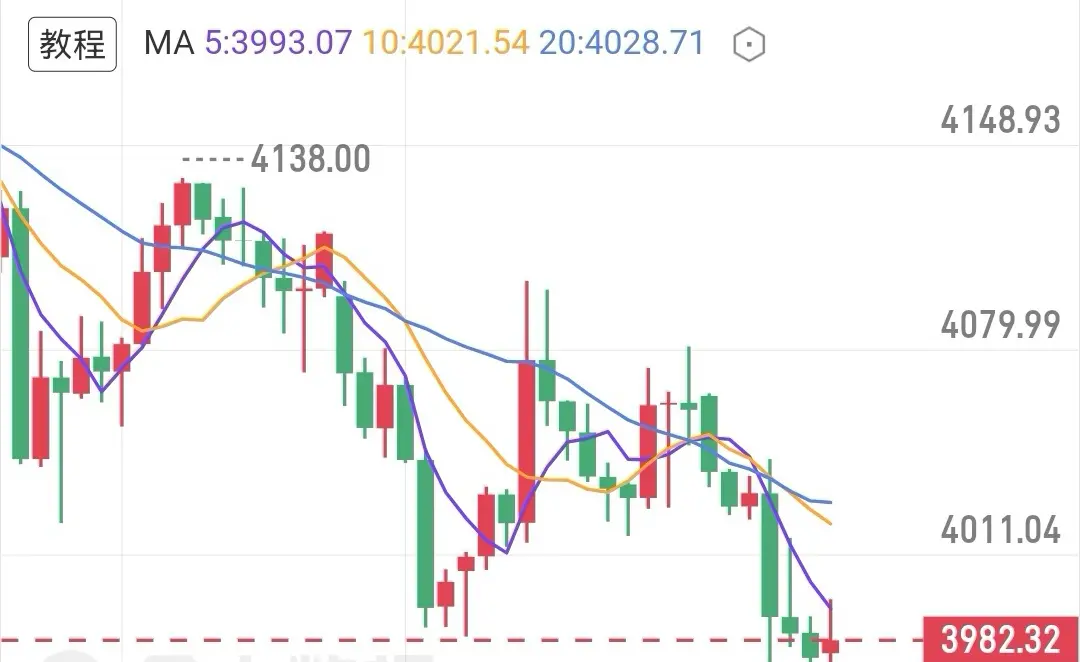
In the early session, there was a small, mild rebound. The current price is around 3982. Hawkish remarks from Fed officials have continued to weigh on gold price action. The bulls’ counterattack has been relatively weak, and the overall long-cycle remains in a downward channel.
On the four-hour chart, the moving-average system is entirely aligned bearish. The 5-period and 10-period moving averages continue to cap price action. The prior support around 4011 has flipped into the current key resistance level. The stage low at 3969 is an important nea
GLDX0.95%
PAXG0.75%
View Original
post-image
  • Reward
  • Comment
  • Repost
  • Share
7, 16 Morning Market Outlook Analysis & Trading Strategy:
Based on the four-hour technical patterns, the short-term moving average system is intertwined and flattening, and the near-term direction for bulls and bears is temporarily unclear. The earlier swing low of 3985 formed a stage-bottom support; the first resistance overhead is around 4065, with a stronger suppression zone concentrated near 4090. Gold is currently trapped within a box range. Until the range breaks decisively, a one-way move is unlikely to start.
4040 serves as the current bull-bear pivot. Price above this level still has
GLDX0.95%
PAXG0.75%
XAU0.72%
View Original
post-image
  • Reward
  • Comment
  • Repost
  • Share
7, 15 Today's market outlook analysis strategy:
From last night to this morning, BTC and Ethereum saw a strong rebound. On the 4-hour timeframe, a burst of aggressive rally pushed price up. Net capital inflows flipped positive at the same time, and short-term long sentiment was concentratedly released. However, the 4-hour KDJ indicators both reached the overbought zone, with the J value breaking through the 100 threshold. In the short term, there is a need for technical pullback and correction.
Recommendation #BTC走势分析
BTC $BTC : 65,000-65,800, short. Set protection above 65,800. Target 63,600
BTC1.31%
ETH4.35%
View Original
post-image
post-image
  • Reward
  • Comment
  • Repost
  • Share
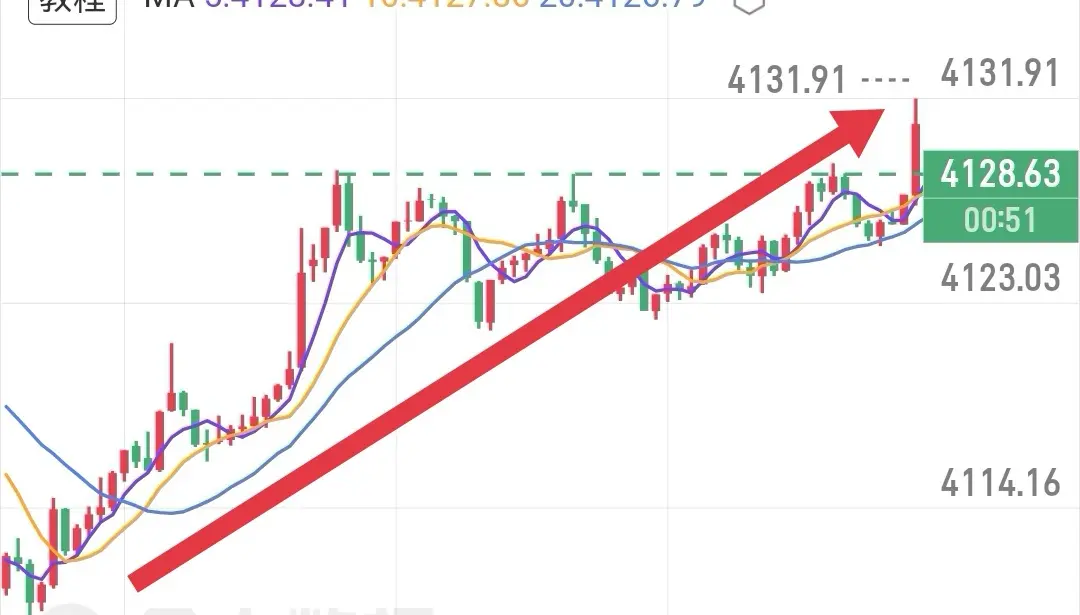
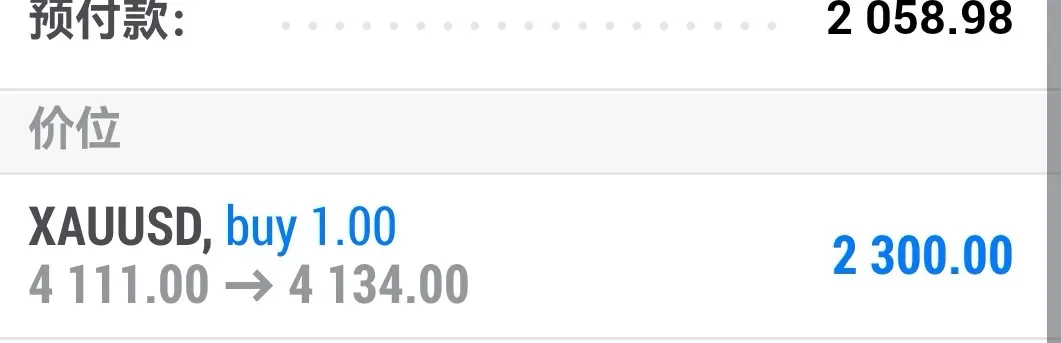
Over 4110, there is already over 30 points of space! Everyone saw it this morning! #黄金 #黄金行情 #XAU
PAXG0.75%
XAU0.72%
View Original
post-image
post-image
post-image
  • Reward
  • Comment
  • Repost
  • Share
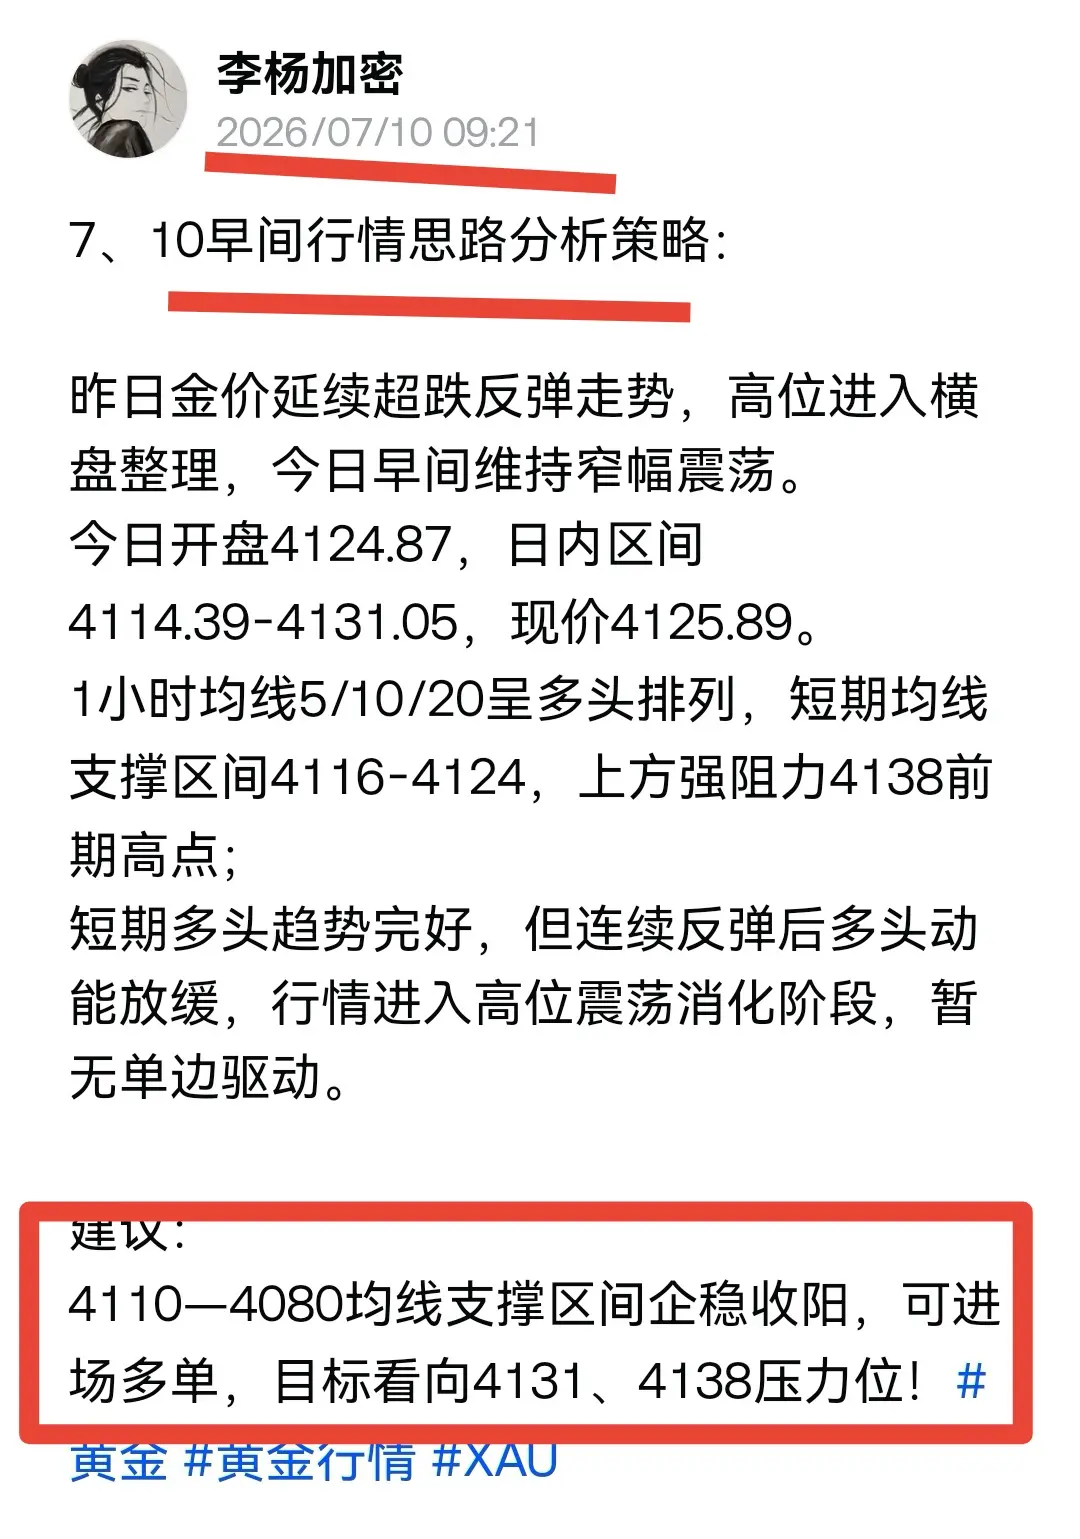
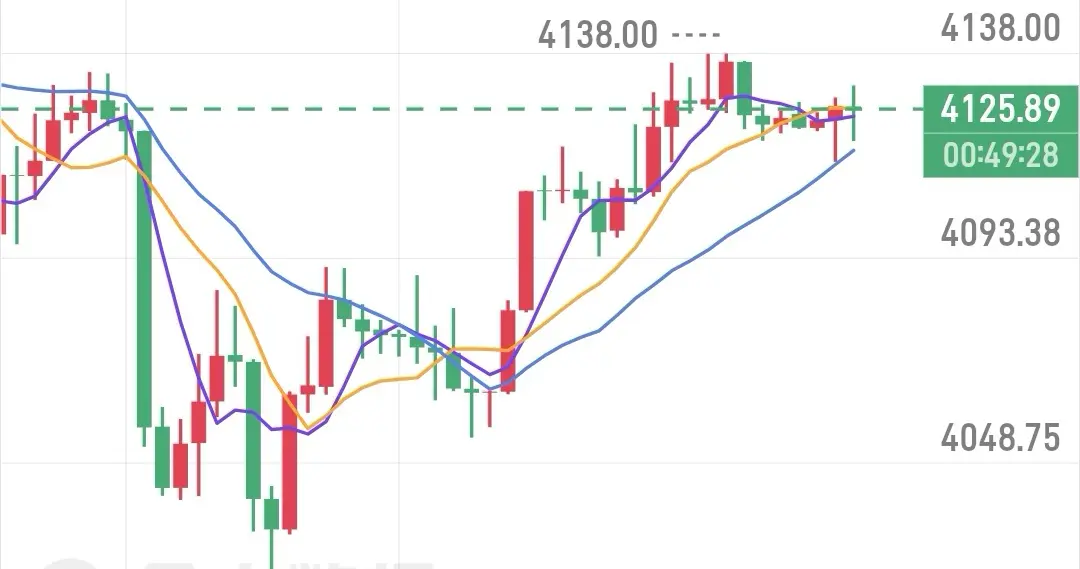
7、10 Morning Market Analysis & Trading Strategy:
Yesterday, gold prices continued the oversold rebound, and after moving into a range-bound consolidation at high levels, today’s morning session has maintained narrow-range fluctuations.
Today’s opening price is 4124.87, the intraday range is 4114.39–4131.05, and the current price is 4125.89.
The 1-hour moving averages 5/10/20 are aligned bullishly. The short-term MA support zone is 4116–4124, and the strong overhead resistance is 4138, the prior high.
The short-term bullish trend is still intact, but after consecutive rebounds, bullish mo
XAU0.72%
View Original
post-image
  • Reward
  • Comment
  • Repost
  • Share
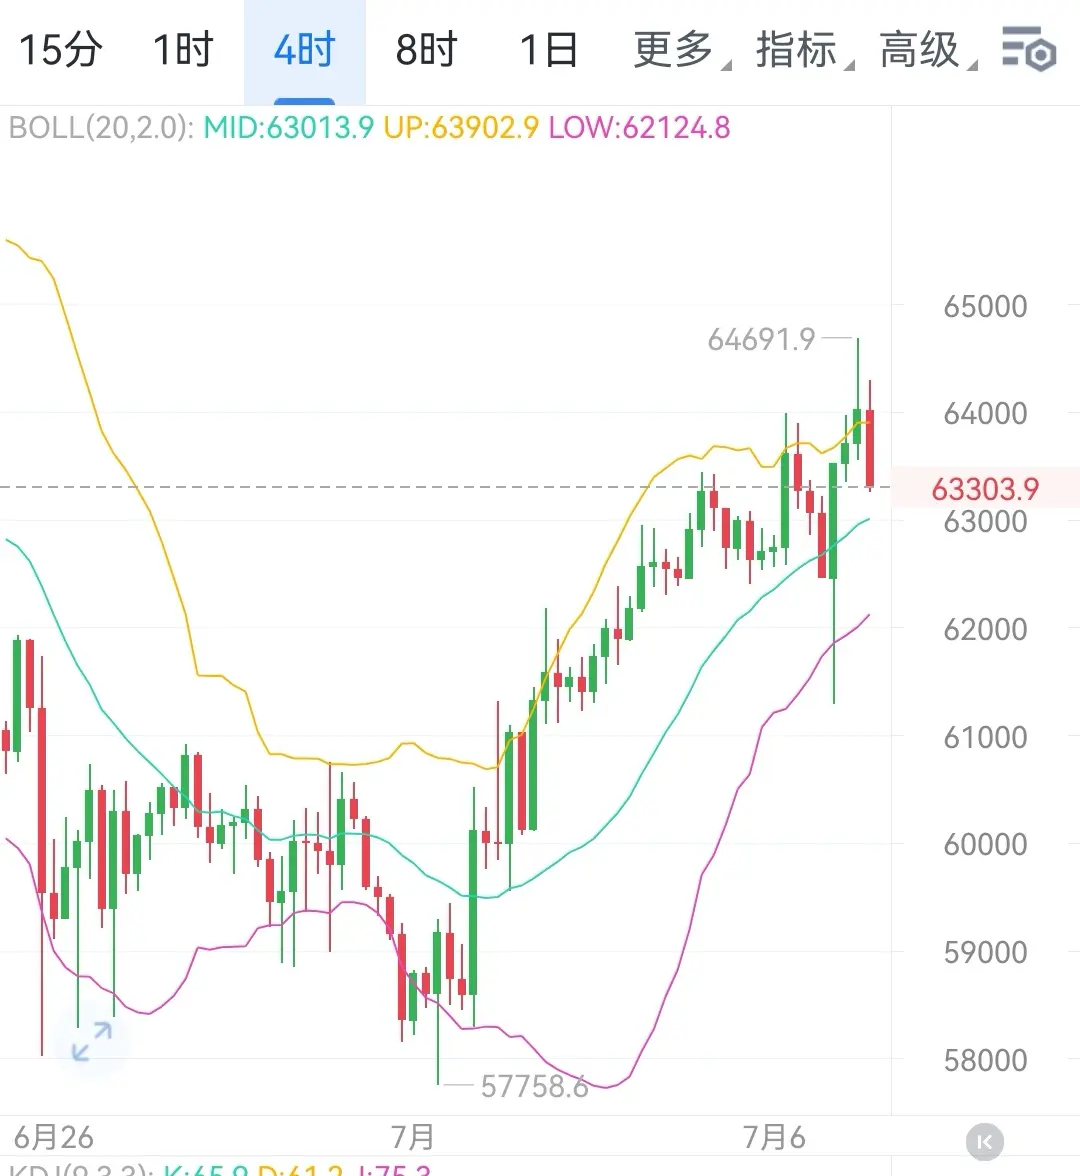
7、7 Today BTC ETH Market Analysis and Strategy:
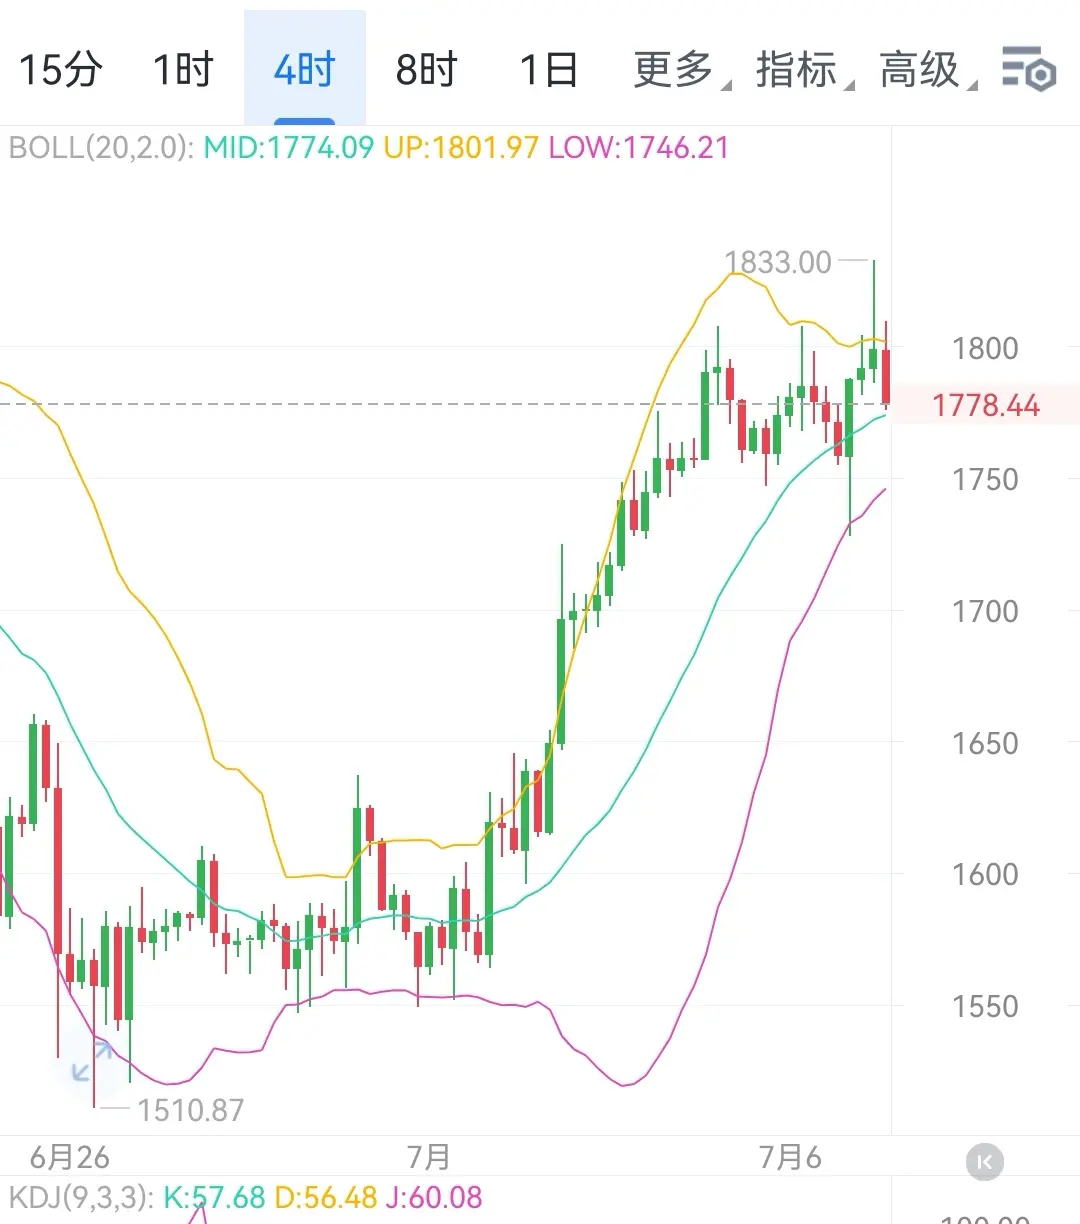
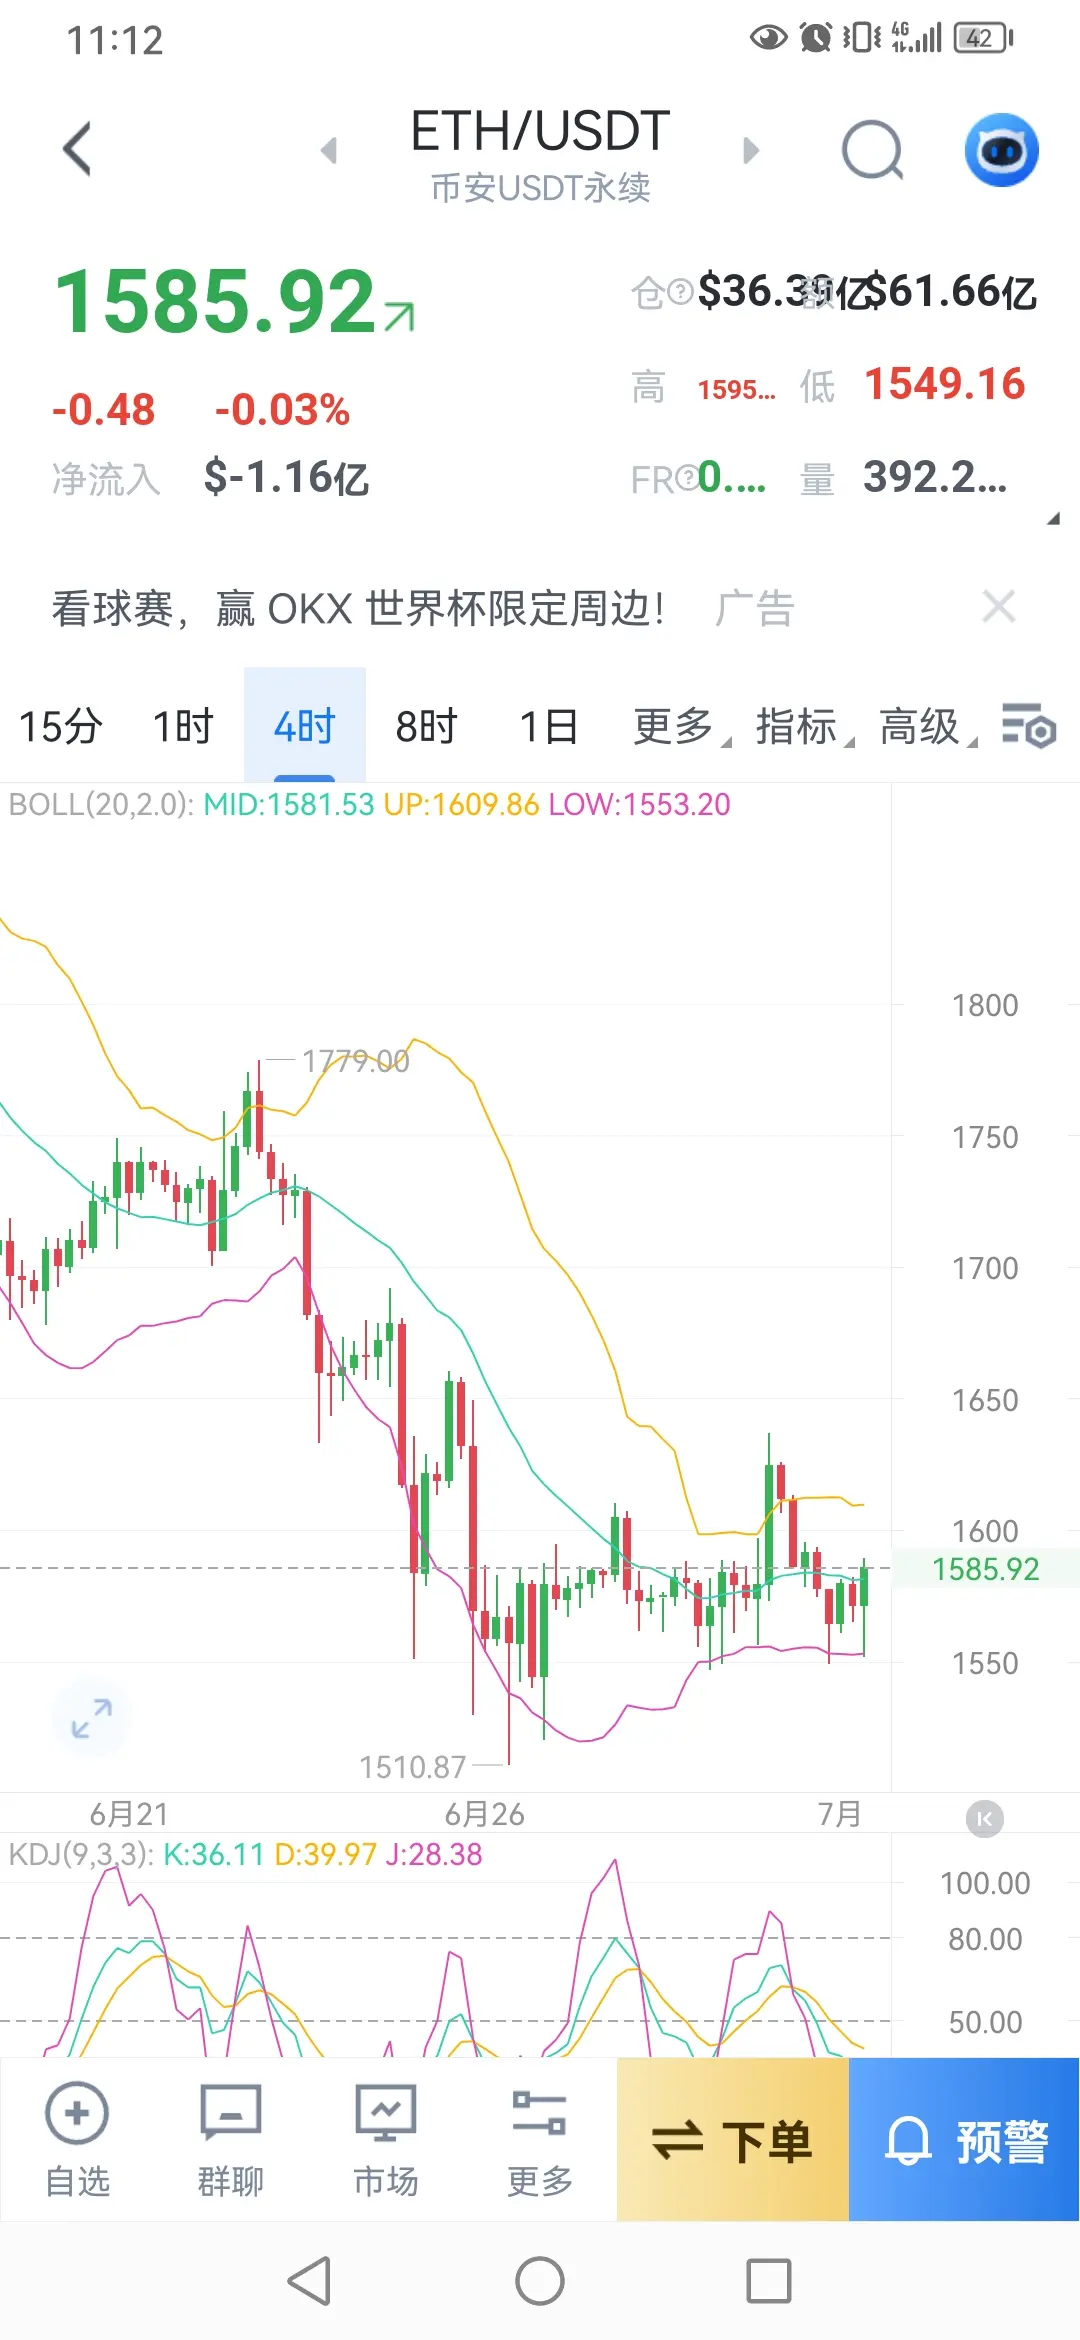
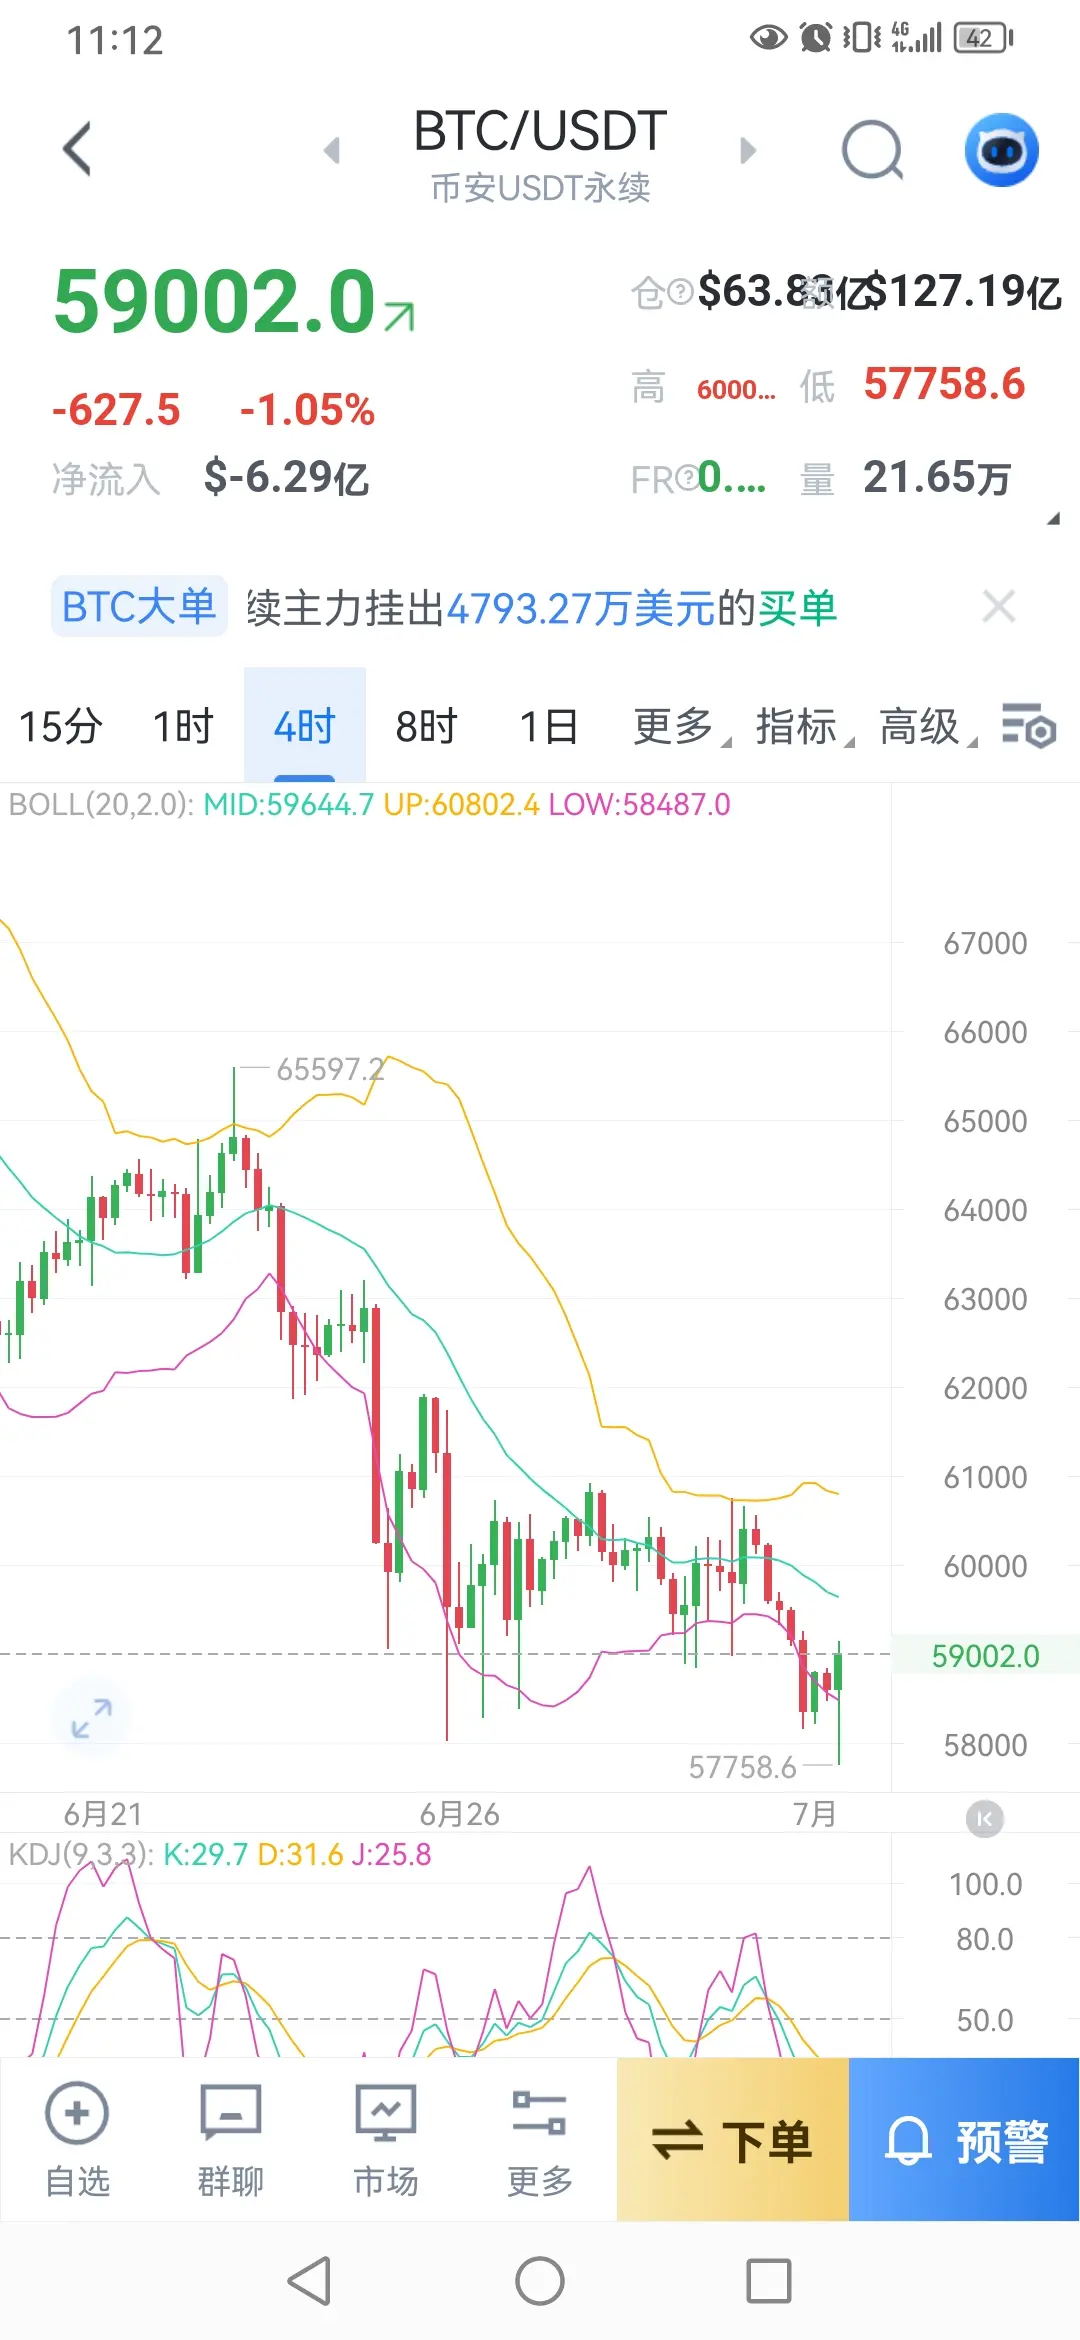
From the 4-hour Bollinger Bands opening upward, the price is oscillating tightly below the upper Bollinger Band. The KDJ indicator has moved into the high overbought region, and the indicator has a need to turn downward for correction. The operation strategy should be cautious and follow the trend. Do not blindly chase long at highs. Wait for the price to surge and face resistance before placing short orders to bet on a pullback. If the price retraces to support and stabilizes, then consider going long with a light position.
Suggestion:
BTC: Sho
BTC1.31%
ETH4.35%
View Original
post-image
post-image
  • Reward
  • Comment
  • Repost
  • Share
7. Today's Analysis and Strategy for Bitcoin and Ethereum Market Trends
Weekly level bearish pressure still firmly dominates; after the continuous weakness in the early stage, market bulls have low willingness to buy; each rebound faces resistance from the upper pressure and pulls back. At this stage, blindly bottom-fishing and going long has poor cost-effectiveness, and the potential downside risk far outweighs the profit gains.
On the 4-hour chart, the Bollinger Bands are moving downward overall, with prices under pressure below the middle band. The KDJ indicator is sluggish at low level
BTC1.31%
ETH4.35%
View Original
post-image
post-image
  • Reward
  • Comment
  • Repost
  • Share
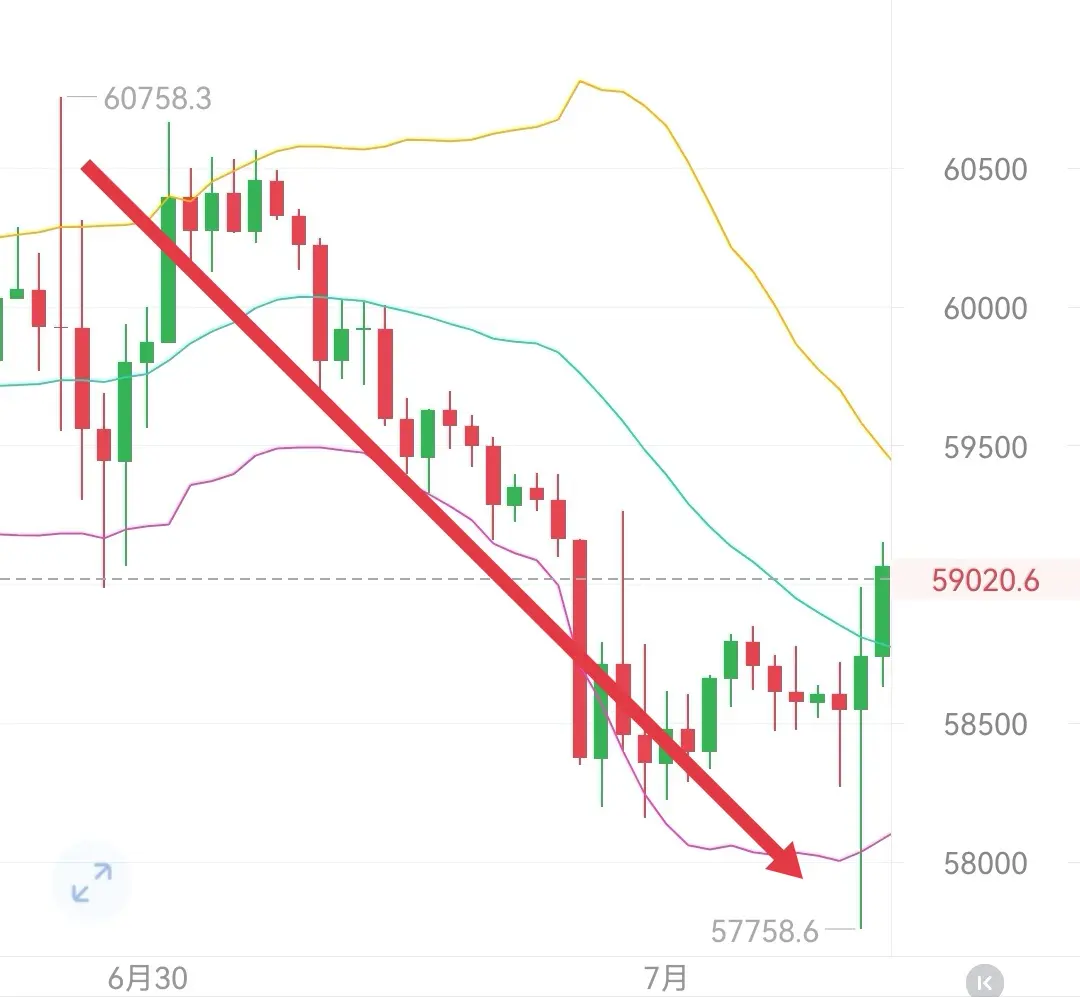
BTC Around 60758 high position 🈳 The target has been perfectly achieved — 1800 points of profit room!
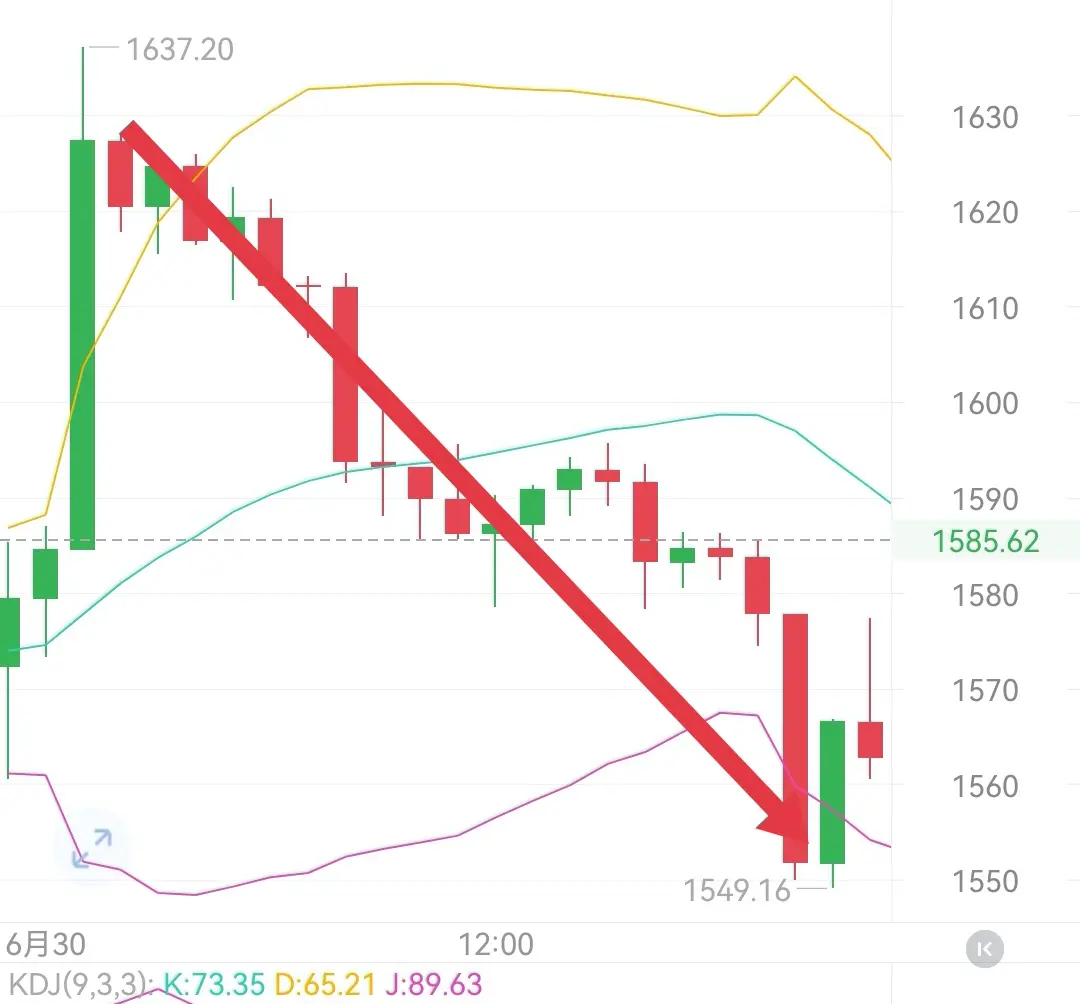
ETH Around 1620 high position 🈳 The target has been perfectly achieved — 71 points of profit room!
The idea is shared in advance—no hindsight, let the market results speak. #BTC #ETH
BTC1.31%
ETH4.35%
View Original
post-image
post-image
post-image
  • Reward
  • Comment
  • Repost
  • Share
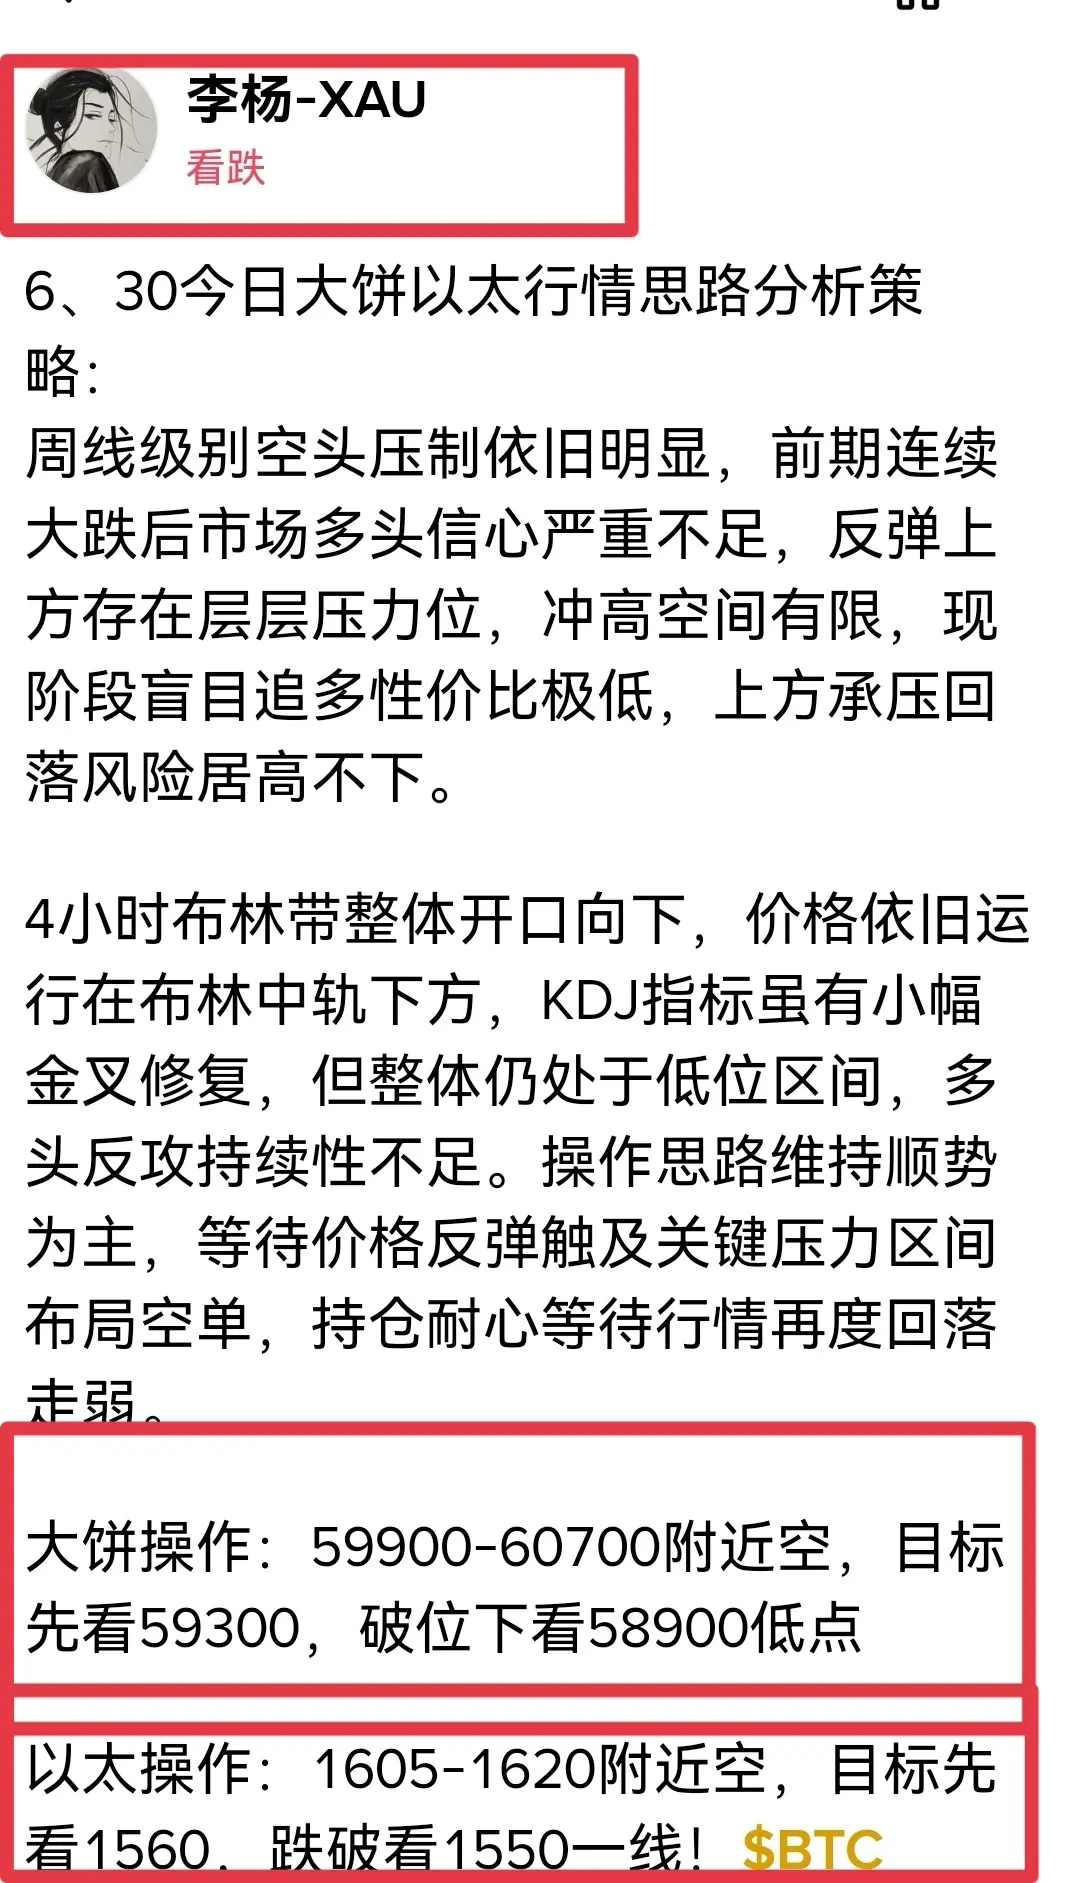
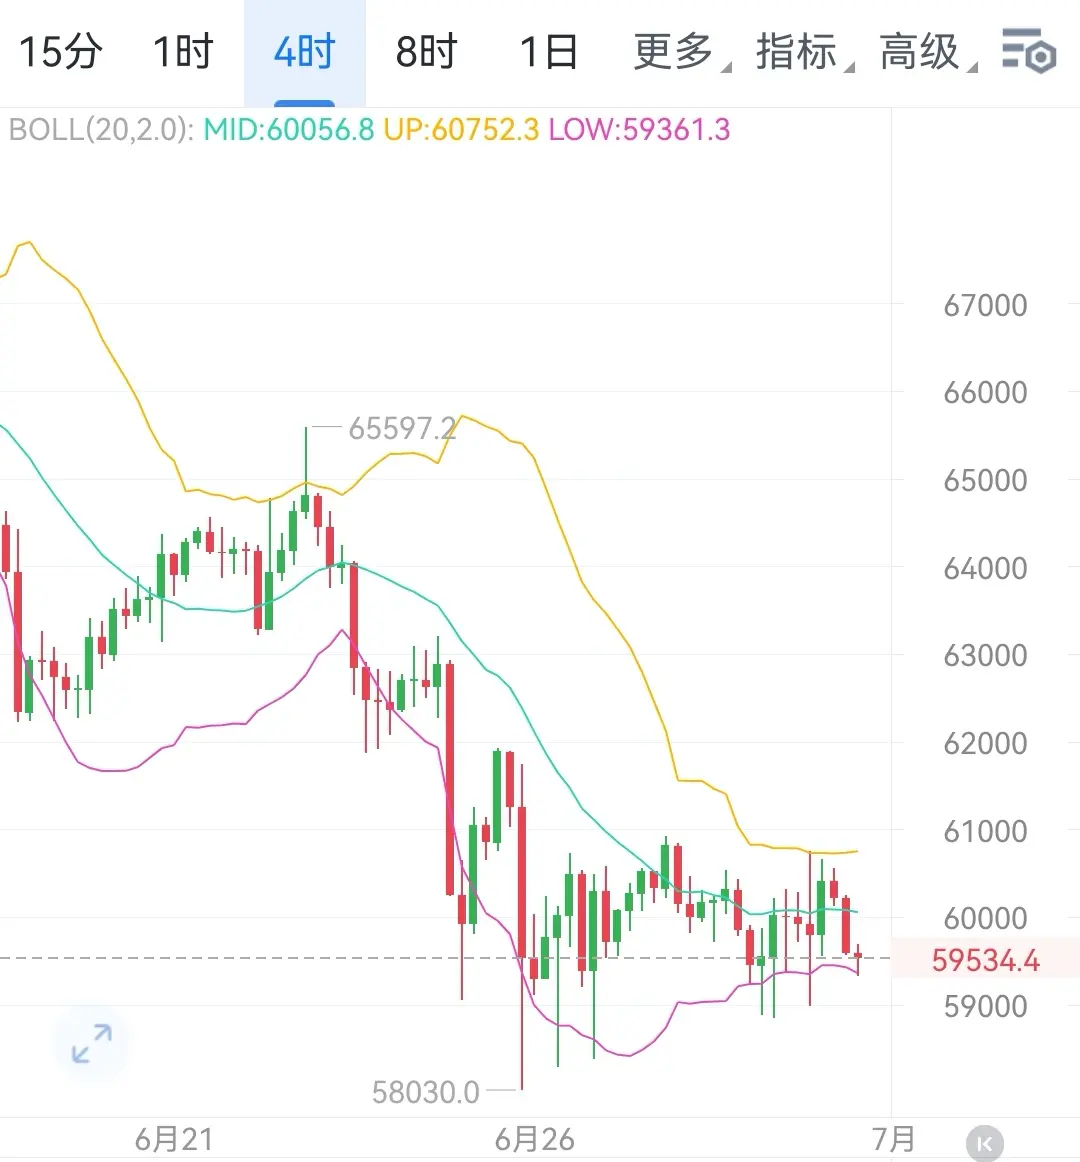
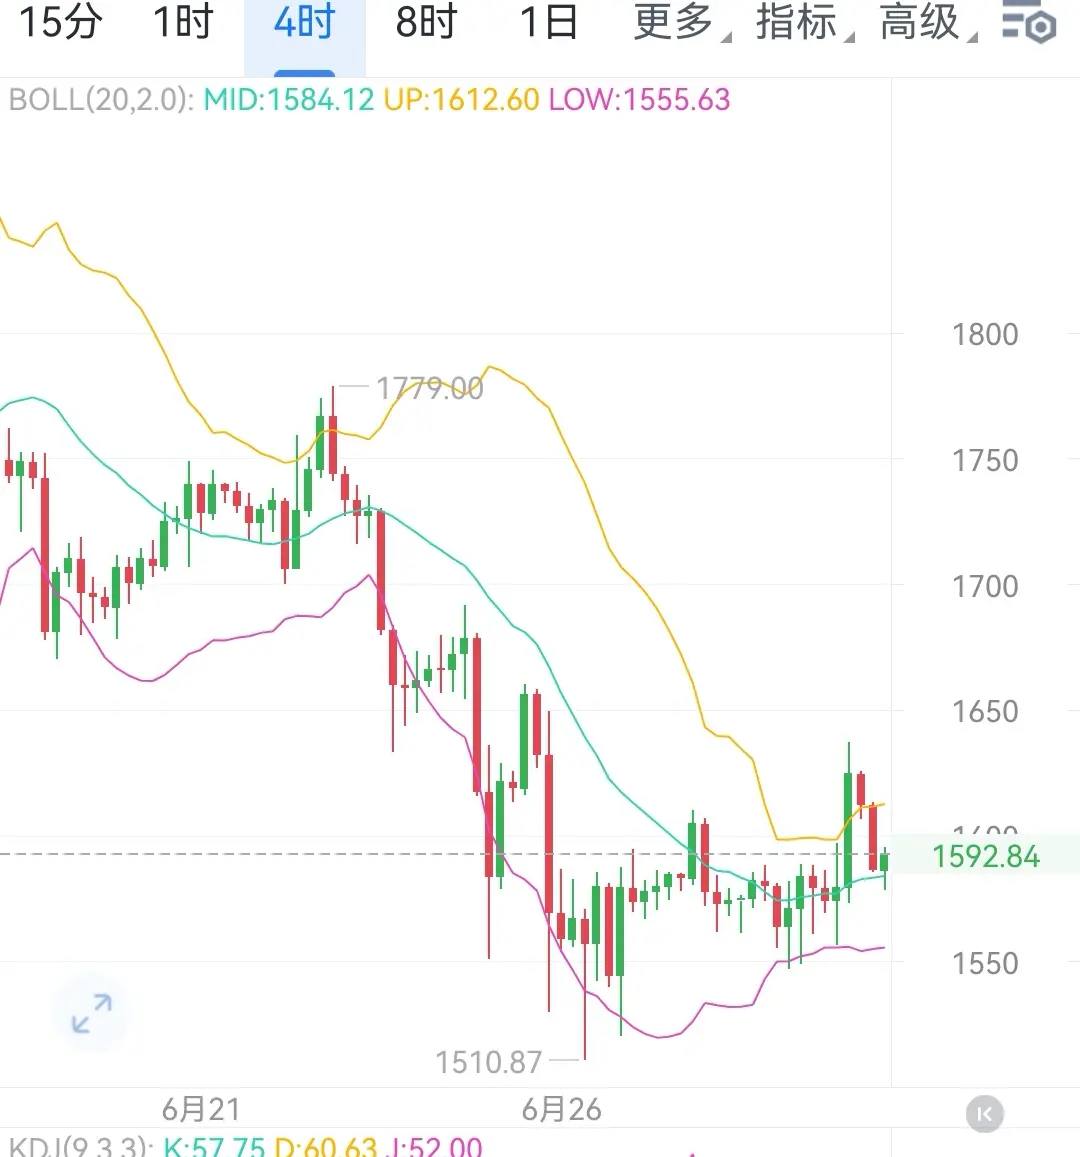
6, 30 Today's Big Cake and Ethereum Market Trend Analysis Strategy:
The bearish pressure on the weekly level remains obvious. After the previous continuous sharp decline, market bullish confidence is severely lacking. There are layers of resistance levels above for rebounds, leaving limited upside space. Blindly chasing longs at this stage offers extremely low cost-effectiveness, with high risk of falling back under pressure.
The 4-hour Bollinger Bands are opening downward overall, and the price is still running below the middle track of the Bollinger Bands. Although the KDJ indicator shows a
BTC1.31%
ETH4.35%
View Original
post-image
post-image
  • Reward
  • Comment
  • Repost
  • Share
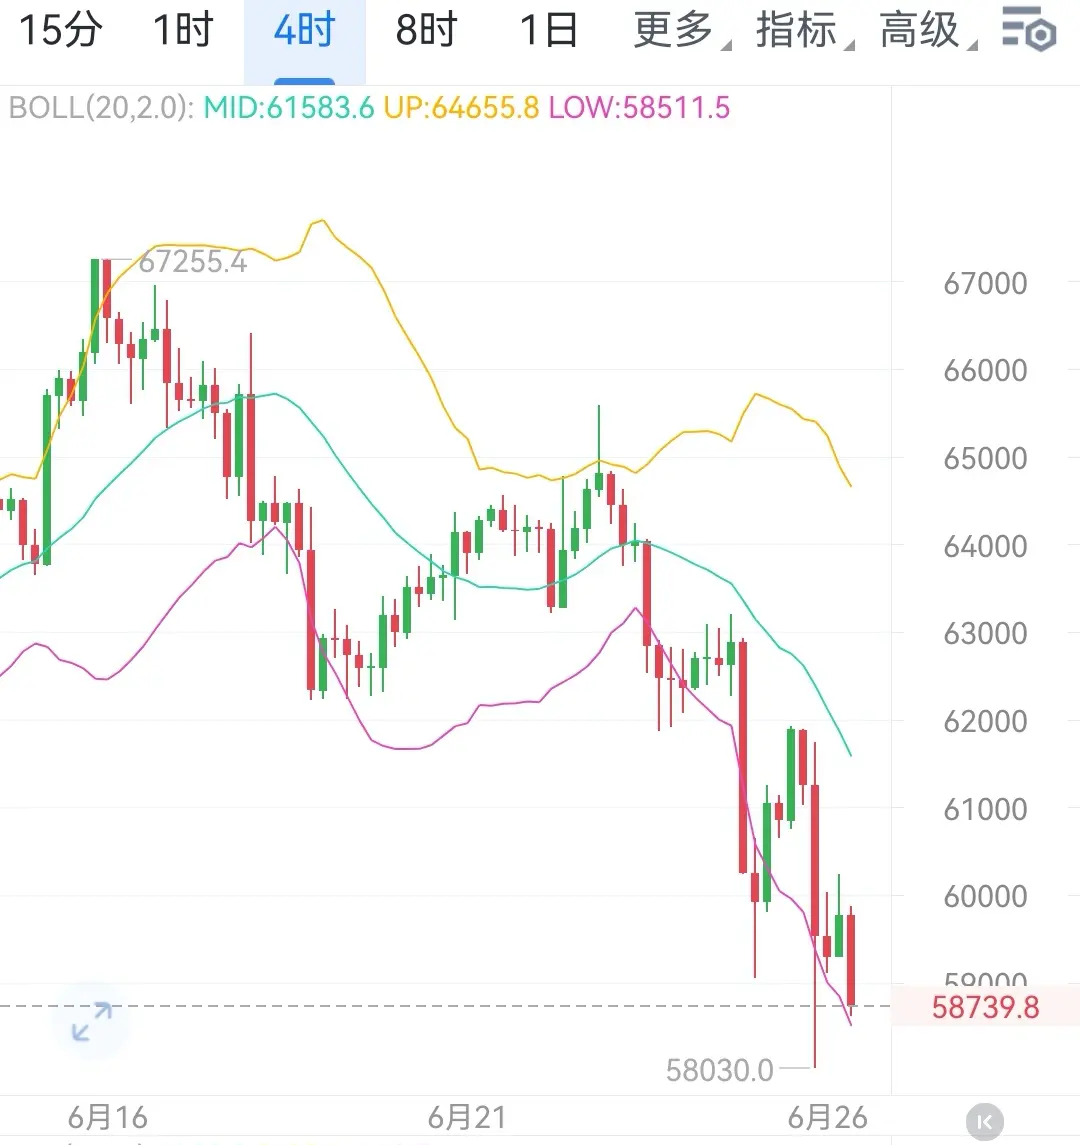
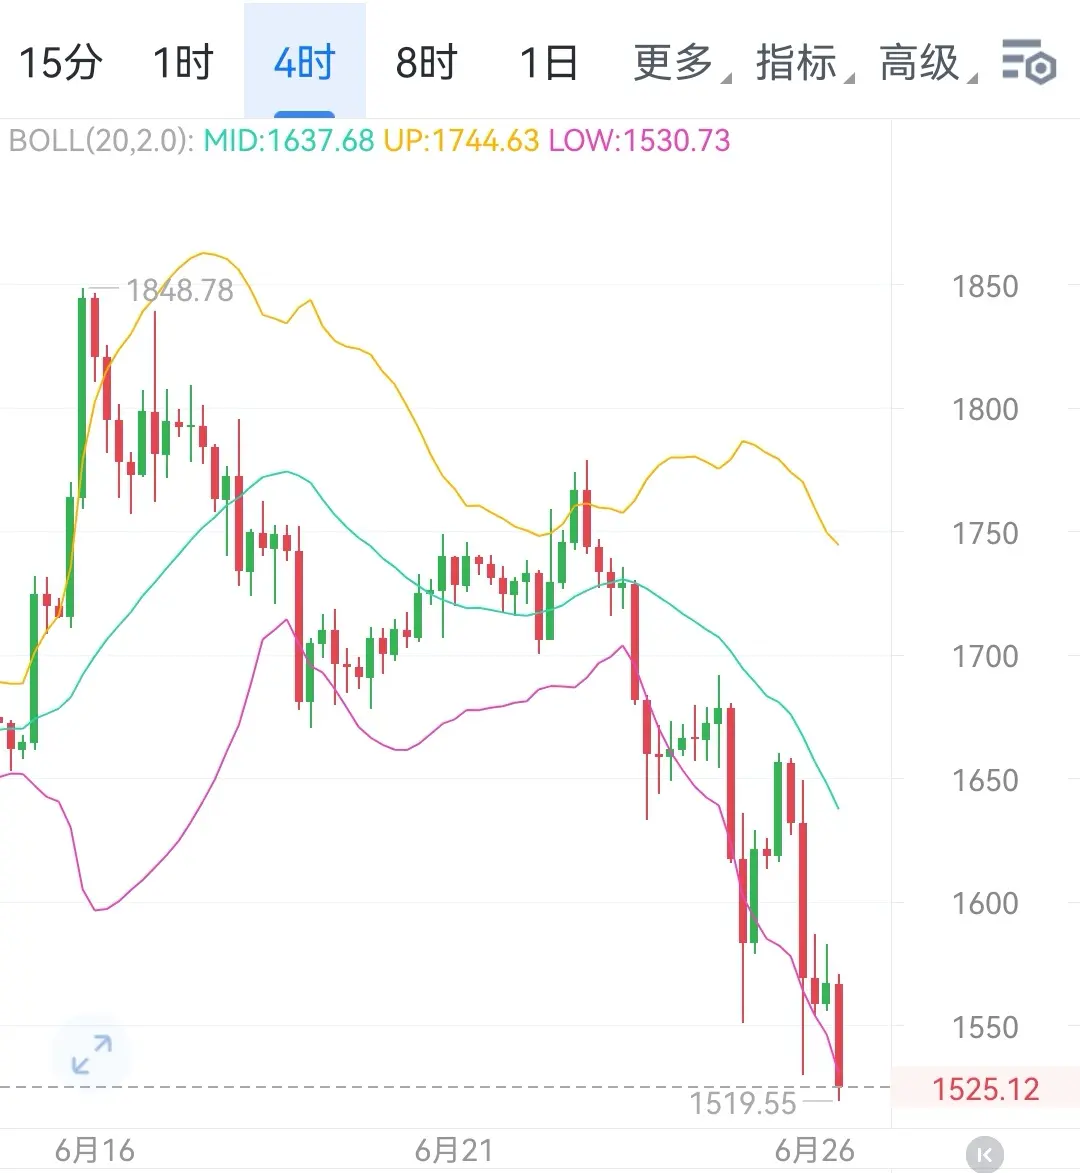
6.26 Bitcoin and Ethereum Midday Market Analysis and Strategy:
After a brief small stabilization during the day, bearish forces were unleashed again, pushing prices to new lows. The temporary halt in decline was only a brief pause during the downtrend, with no sign of a trend reversal. The current weak pattern is completely clear; every small rebound only creates opportunities for bears to enter.
From the 4-hour candle chart, the Bollinger Bands continue to open downward, and the KDJ indicator keeps moving lower. The downward channel is fully open, and the weekly level continues to maintain a
ETH4.34%
BTC1.32%
View Original
post-image
post-image
  • Reward
  • Comment
  • Repost
  • Share
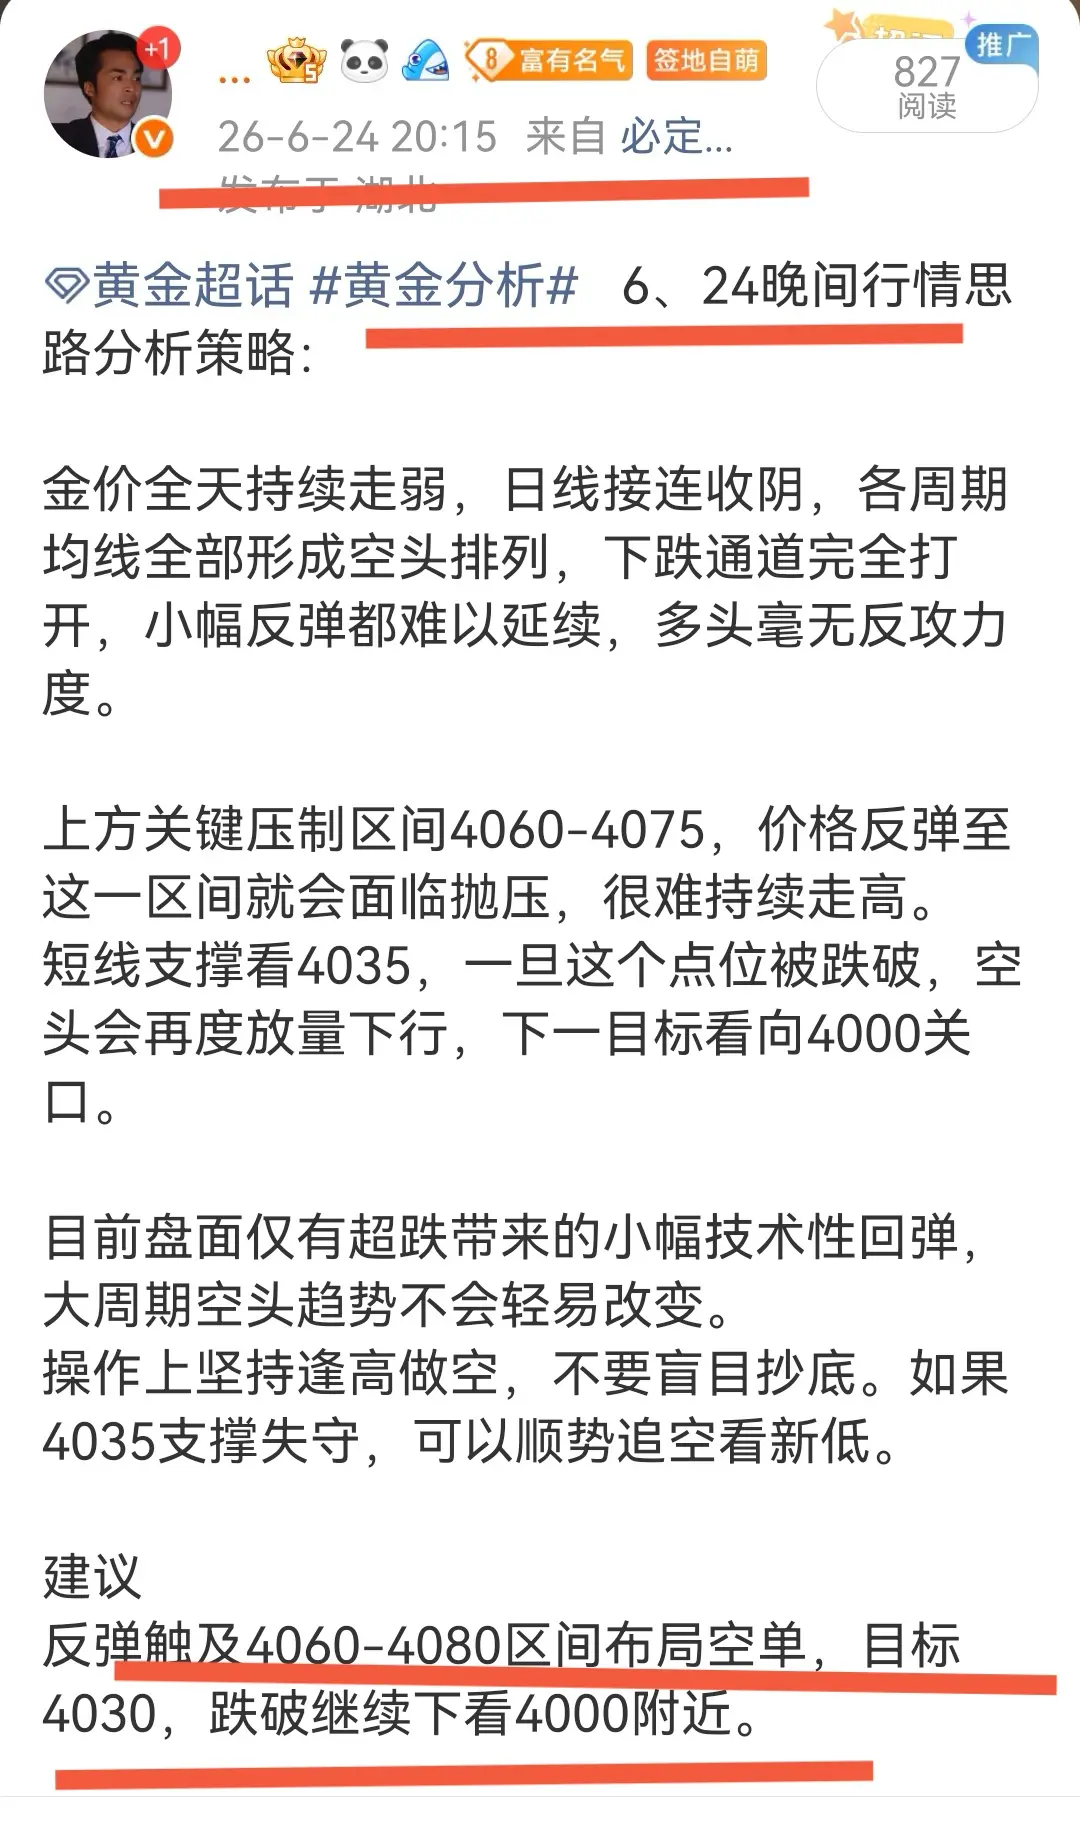
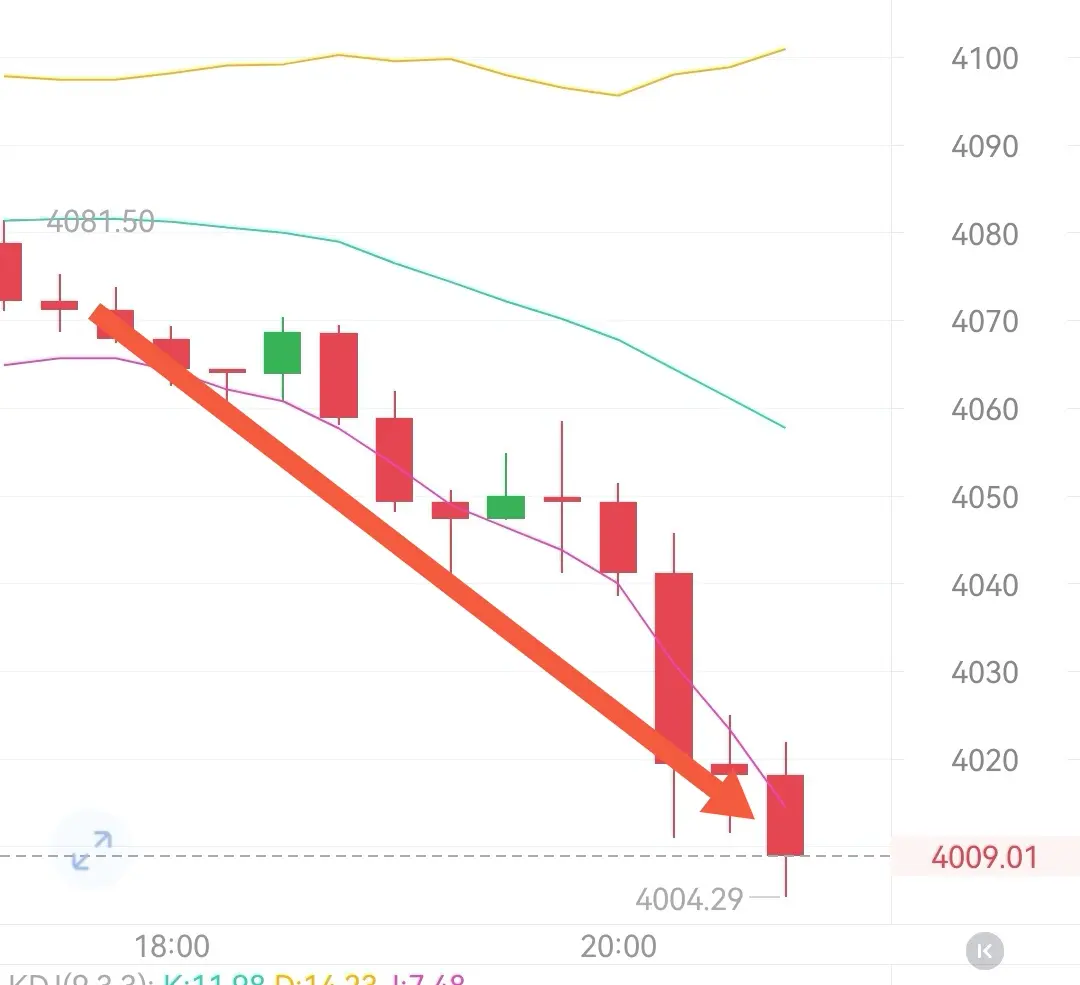
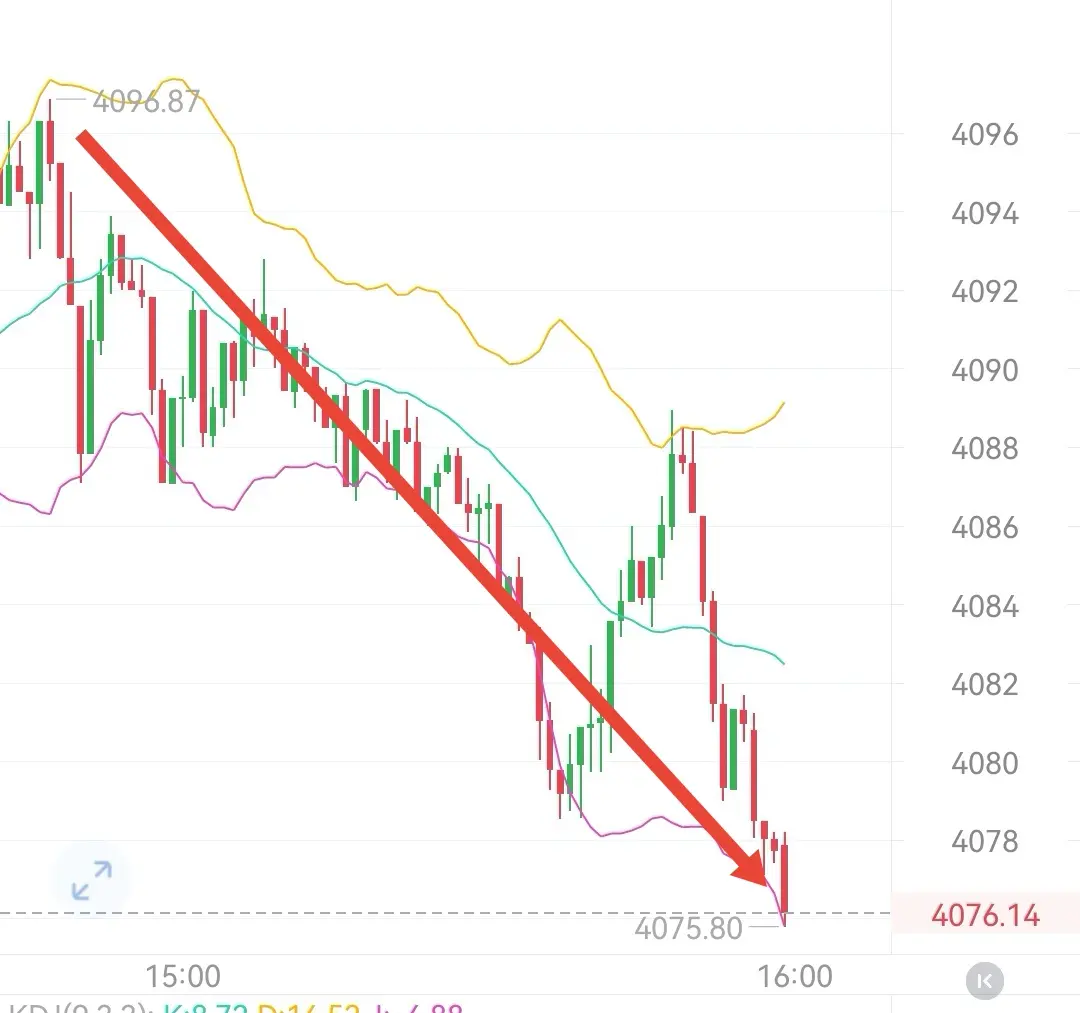
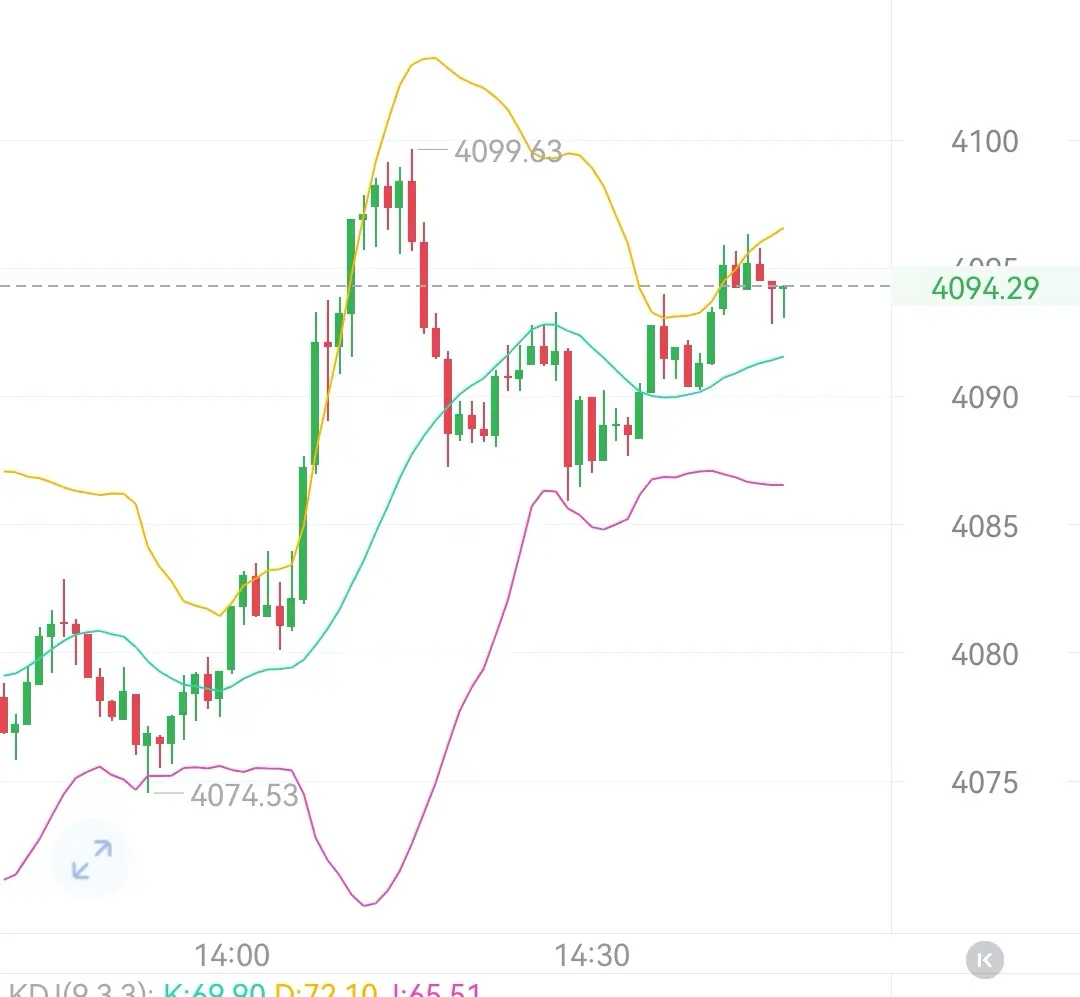
Pre-emptive disclosure, no post-event review; the market will provide the answer. ​​​#黄金 #黄金行情 #XAU
GLDX0.95%
PAXG0.75%
XAU0.72%
View Original
post-image
post-image
  • Reward
  • Comment
  • Repost
  • Share
The layout strategy is disclosed in advance, with no reservations.
Avoid hindsight analysis; the market trend is the best proof. #黄金 #黄金行情 #XAU
GLDX0.95%
PAXG0.75%
XAU0.72%
View Original
post-image
post-image
  • Reward
  • Comment
  • Repost
  • Share
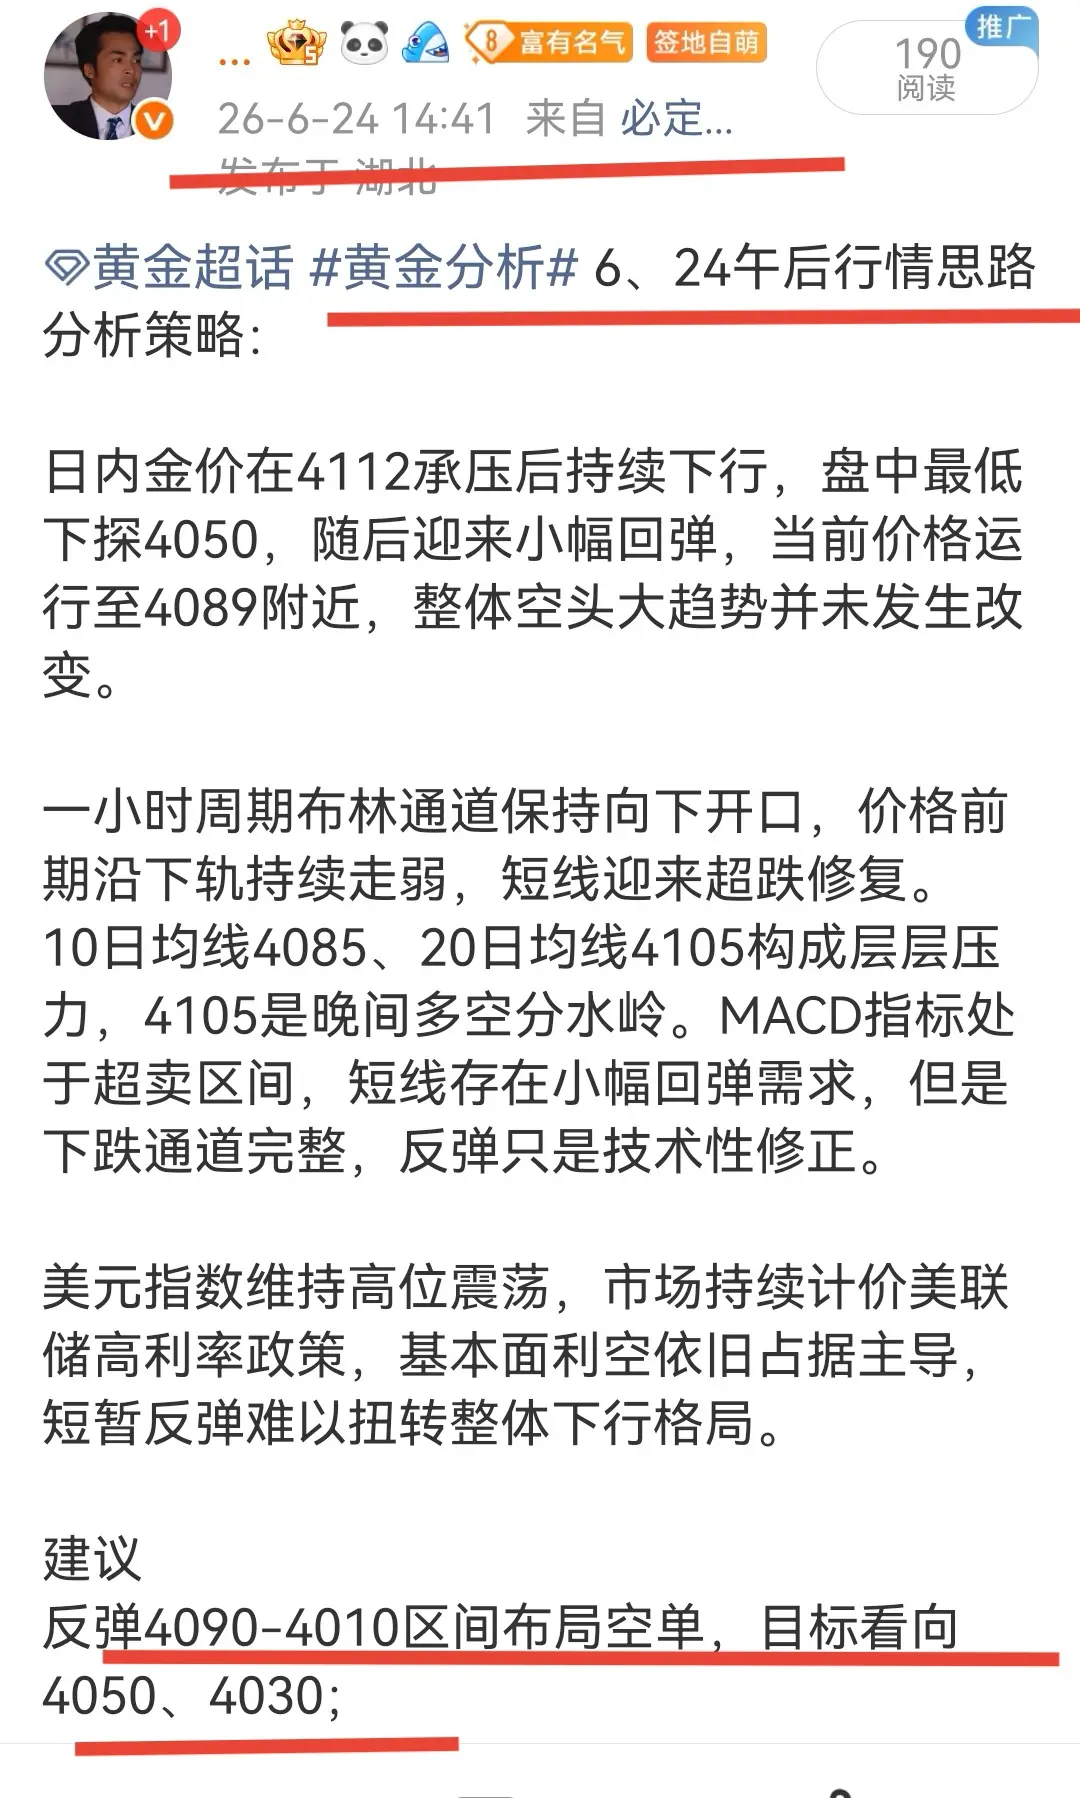
6, April 24 Afternoon Market Trend Analysis Strategy:
Domestic gold prices continued to decline after being pressured at 4112, with the lowest point reaching 4050 during the session, followed by a slight rebound. The current price is around 4089, and the overall bearish trend has not changed.
The one-hour Bollinger Bands remain downward sloping, with prices previously weakening along the lower band, indicating a short-term oversold correction. The 10-day moving average at 4085 and the 20-day moving average at 4105 form multiple resistance levels, with 4105 being the evening key level for bulls
USIDX-0.20%
XAU0.72%
View Original
post-image
  • Reward
  • Comment
  • Repost
  • Share
  • Pinned