Technical Outlook: SOL Gains Momentum, but Macro Trend Still Needs Confirmation
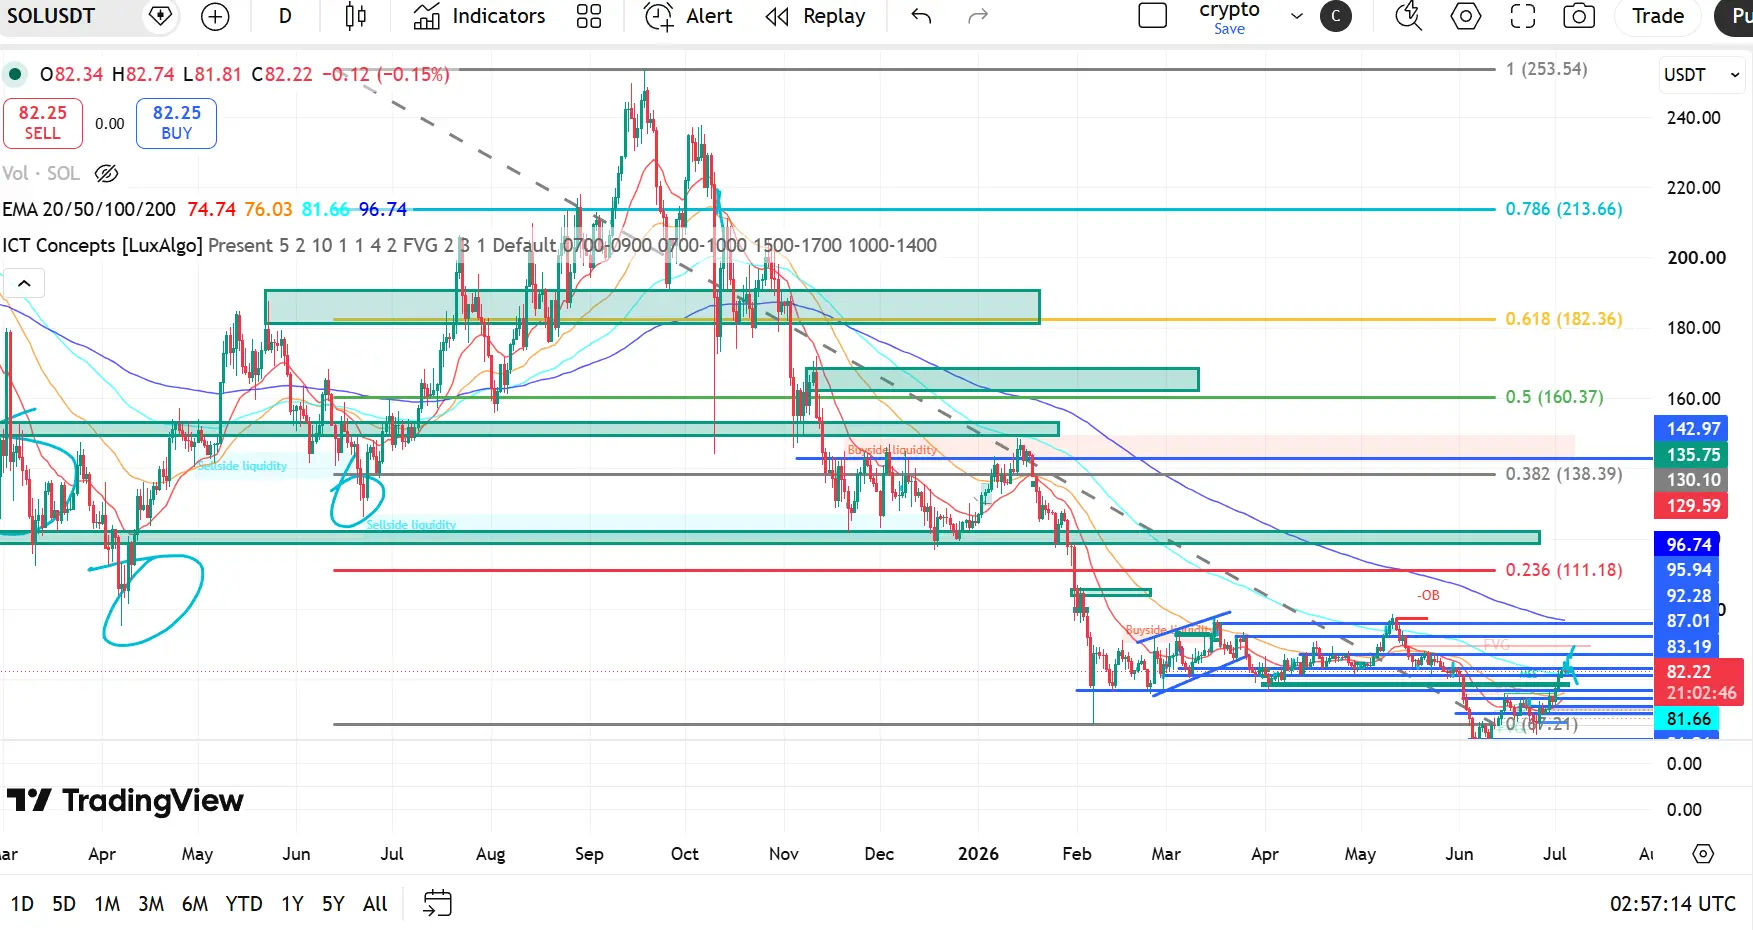
Solana is showing signs of recovery after defending the $81.66 support zone. Price has broken above the short-term consolidation range and is pushing toward nearby resistance, while RSI has climbed firmly above the neutral level. Despite the recent strength, SOL remains below the major higher-timeframe moving averages, meaning the broader trend is still cautious until key resistance levels are reclaimed.
📈 EMA Structure (Improving, but Still Bearish)
20 EMA: $74.74
50 EMA: $76.03
100 EMA: $81.66
200 EMA: $96.74
SOL is now trading above the 20 EMA, 50 EMA, and around the 100 EMA, reflecting improving short-term momentum.
The 200 EMA ($96.74) remains the major dynamic resistance and is the key level needed to shift the higher-timeframe trend.
Holding above the reclaimed EMAs would strengthen the ongoing recovery.
👉 Short-term momentum has turned bullish, but the macro trend remains neutral to bearish until SOL reclaims the 200 EMA.
📐 Fibonacci & Market Structure
SOL remains below the 0.236 Fibonacci level at $111.18, indicating the broader correction is still in place.
Buyers have successfully defended the $81.66 demand zone and pushed price above the recent consolidation.
A continuation above the current resistance cluster would confirm stronger bullish momentum.
Bullish targets:
$83.19
$87.01
$92.28
$96.74 (200 EMA)
Bearish scenario:
Losing $81.66 would invalidate the recent breakout and could send SOL back toward the recent swing lows.
🧠 ICT / Smart Money View
Price appears to have swept sell-side liquidity before staging a strong recovery.
Buyers have reclaimed short-term liquidity and are attempting to push into the next overhead supply zone.
A sustained hold above $83.19 would increase the probability of a move toward the $87–97 resistance cluster.
📉 RSI Momentum
RSI (14): 65.31
RSI has moved above the neutral 50 level and is approaching bullish territory.
Momentum currently favors buyers, although a move toward 70 may bring short-term profit-taking before continuation.
📊 Key Levels
🔴 Resistance
$83.19
$87.01
$92.28
$96.74 (200 EMA)
🟢 Support
$81.66 (100 EMA)
$76.03 (50 EMA)
$74.74 (20 EMA)
📌 Final Outlook
SOL is showing one of its strongest recovery attempts in recent weeks after breaking out of consolidation and reclaiming key short-term moving averages. RSI confirms improving momentum, but the broader trend remains unconfirmed until the 200 EMA is reclaimed.
✅ Holding above $81.66 keeps the bullish recovery scenario intact.
✅ A breakout above $87.01–96.74 would strengthen bullish momentum toward higher resistance.
❌ Losing $81.66 would weaken the recovery and could lead to another retest of recent lows.
Overall Bias: Neutral to Bullish (Short Term). SOL has regained bullish momentum, but a confirmed higher-timeframe trend reversal requires a decisive break above the 200 EMA ($96.74) and the nearby resistance cluster.
$SOL
Solana is showing signs of recovery after defending the $81.66 support zone. Price has broken above the short-term consolidation range and is pushing toward nearby resistance, while RSI has climbed firmly above the neutral level. Despite the recent strength, SOL remains below the major higher-timeframe moving averages, meaning the broader trend is still cautious until key resistance levels are reclaimed.
📈 EMA Structure (Improving, but Still Bearish)
20 EMA: $74.74
50 EMA: $76.03
100 EMA: $81.66
200 EMA: $96.74
SOL is now trading above the 20 EMA, 50 EMA, and around the 100 EMA, reflecting improving short-term momentum.
The 200 EMA ($96.74) remains the major dynamic resistance and is the key level needed to shift the higher-timeframe trend.
Holding above the reclaimed EMAs would strengthen the ongoing recovery.
👉 Short-term momentum has turned bullish, but the macro trend remains neutral to bearish until SOL reclaims the 200 EMA.
📐 Fibonacci & Market Structure
SOL remains below the 0.236 Fibonacci level at $111.18, indicating the broader correction is still in place.
Buyers have successfully defended the $81.66 demand zone and pushed price above the recent consolidation.
A continuation above the current resistance cluster would confirm stronger bullish momentum.
Bullish targets:
$83.19
$87.01
$92.28
$96.74 (200 EMA)
Bearish scenario:
Losing $81.66 would invalidate the recent breakout and could send SOL back toward the recent swing lows.
🧠 ICT / Smart Money View
Price appears to have swept sell-side liquidity before staging a strong recovery.
Buyers have reclaimed short-term liquidity and are attempting to push into the next overhead supply zone.
A sustained hold above $83.19 would increase the probability of a move toward the $87–97 resistance cluster.
📉 RSI Momentum
RSI (14): 65.31
RSI has moved above the neutral 50 level and is approaching bullish territory.
Momentum currently favors buyers, although a move toward 70 may bring short-term profit-taking before continuation.
📊 Key Levels
🔴 Resistance
$83.19
$87.01
$92.28
$96.74 (200 EMA)
🟢 Support
$81.66 (100 EMA)
$76.03 (50 EMA)
$74.74 (20 EMA)
📌 Final Outlook
SOL is showing one of its strongest recovery attempts in recent weeks after breaking out of consolidation and reclaiming key short-term moving averages. RSI confirms improving momentum, but the broader trend remains unconfirmed until the 200 EMA is reclaimed.
✅ Holding above $81.66 keeps the bullish recovery scenario intact.
✅ A breakout above $87.01–96.74 would strengthen bullish momentum toward higher resistance.
❌ Losing $81.66 would weaken the recovery and could lead to another retest of recent lows.
Overall Bias: Neutral to Bullish (Short Term). SOL has regained bullish momentum, but a confirmed higher-timeframe trend reversal requires a decisive break above the 200 EMA ($96.74) and the nearby resistance cluster.
$SOL