Summary
-
The crypto market maintained a volatile repair, with BTC and ETH posting slight gains. ETF flows turned from net outflows to net inflows, institutional sentiment improved at the margin, but capital remained concentrated in leading products and market leverage expansion was limited.
-
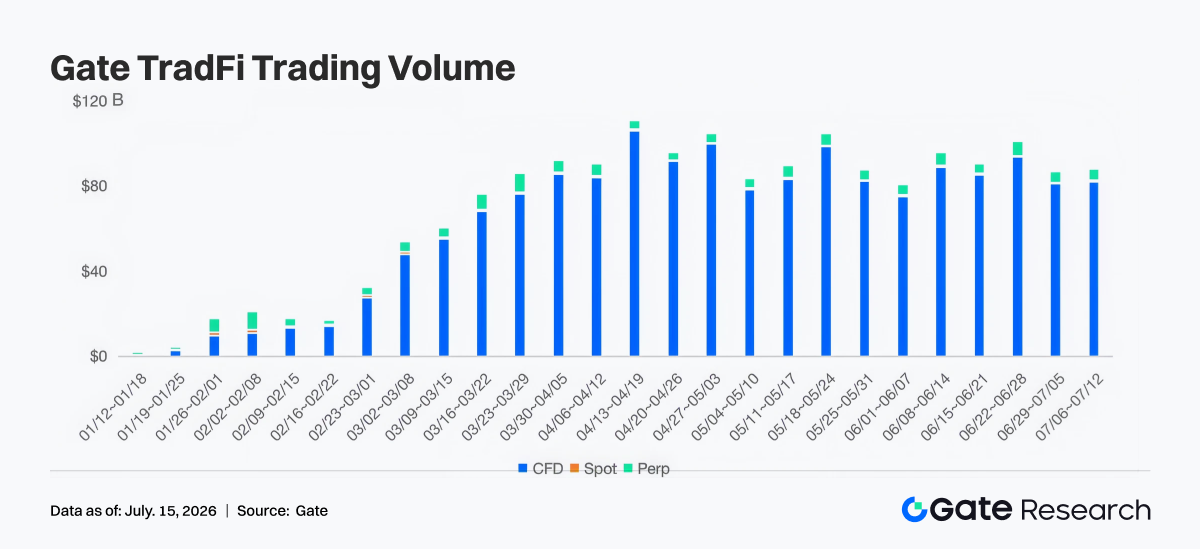
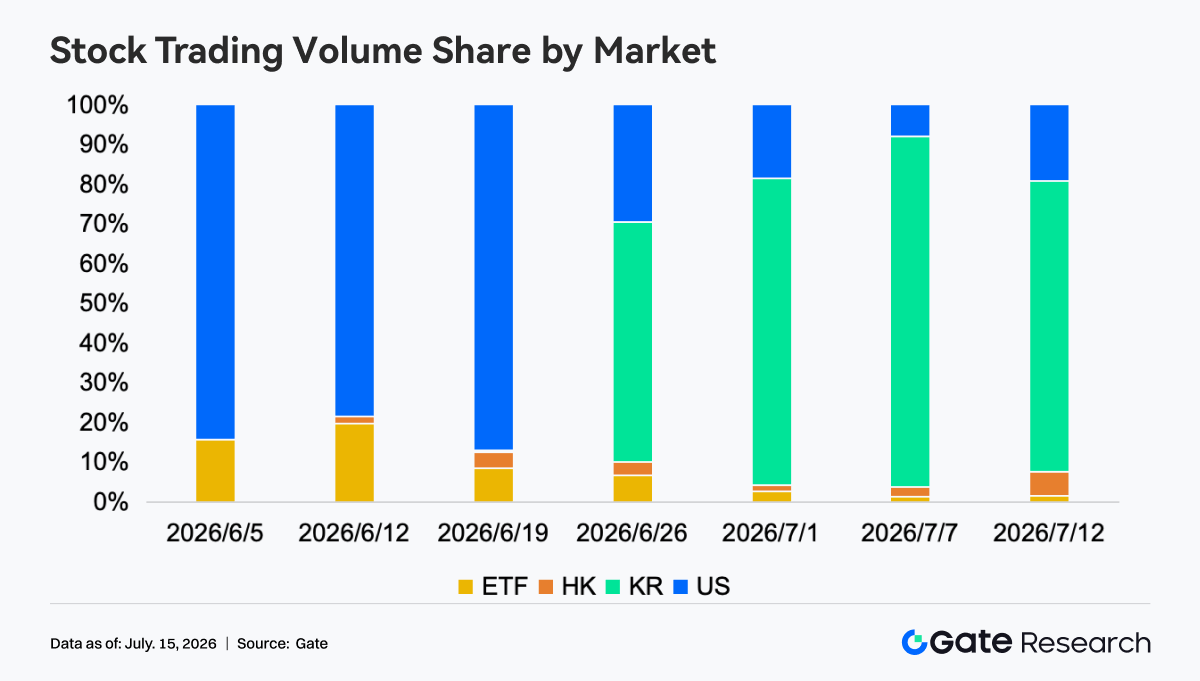
Gate TradFi weekly trading volume remained stable at a high level of about USD 85 billion, with CFDs accounting for about 95%. The trading structure of Gate Stocks continued to diversify, and Korean equities quickly became the main source of trading volume.
-
The Robinhood Chain Meme narrative significantly amplified Uniswap trading volume, with capital rotating from the Solana Launchpad ecosystem toward RWA, tokenized stocks, and Meme assets.
-
Driven by regulatory progress, USDC further strengthened its institutional compliance positioning. Ethereum ecosystem protocols such as Lido and Aave continued to benefit from inflows into RWA, stablecoins, and institutional capital, while demand for LSTs in the SOL ecosystem and lending on emerging chains cooled somewhat.
-
In terms of protocol revenue, Tether and Circle continued to dominate industry revenue, while revenues of protocols such as Hyperliquid, Pump, and Jupiter generally declined, showing that trading activity has not yet fully translated into growth in protocol profitability.
-
BTC OI fluctuated within a range and funding rates remained positive, showing that leveraged capital re-entered the rebound, but long crowding increased somewhat. 25D Skew repaired from the earlier period, and market defensiveness eased somewhat, but cautious medium-term expectations have not yet disappeared.
-
Options market volume continued to cool, monthly contracts still dominated, and demand for short-cycle event trading fell back significantly. DVOL continued to move down to low levels, reflecting that the market has shifted from protective pricing to a low-volatility repair phase.
1. Market Focus Analysis
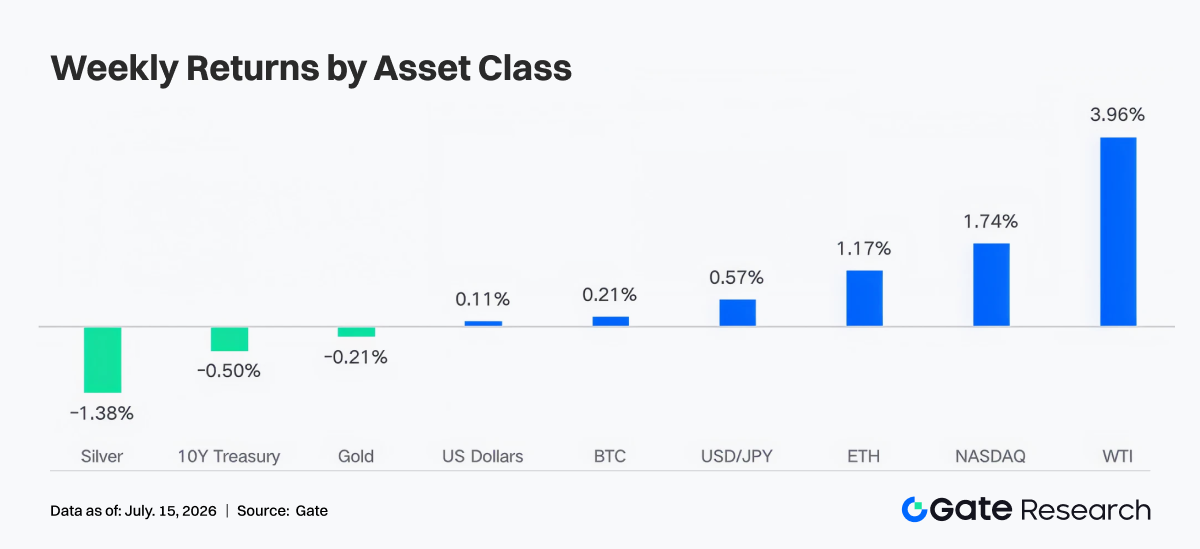
Last week (July 6 to July 12, 2026), the main global market themes remained Fed policy divergence, repair in AI trading, and the repricing of oil prices and geopolitical risks. The minutes of the Fed's June meeting showed that the policy rate remained at 3.6%, but about half of the 18 officials who submitted forecasts supported a rate hike within the year, while the other half supported holding steady or cutting rates, so the market continued to suppress expectations for rapid easing. On inflation, May CPI rose to 4.2% year on year, the New York Fed's 1-year inflation expectation rose to 3.7%, and the 3-year expectation rose to 3.3%, keeping U.S. Treasury yields fluctuating at high levels, with the 10-year U.S. Treasury yield at one point trading around 4.46% to 4.55% during the week. In equities, AI and the chip chain repaired risk appetite, with the S&P 500 up 1.2% for the week, the Nasdaq up 1.7%, the Dow down 0.5%, and the Russell 2000 down 0.6%, showing a structure of 'large-cap tech strength and small-cap weakness.' In commodities, OPEC announced an increase in output of about 188,000 barrels/day next month, which pressured oil prices at the start of the week, with WTI once near USD 68.70/barrel; however, tensions between the United States and Iran around the Strait of Hormuz heated up in the latter part of the week, leaving upside tail risk for subsequent oil prices and inflation expectations. Gold was pulled between safe-haven demand and real-rate constraints, with relatively large intraday volatility during the week. The crypto market moved up mildly on the back of improving risk appetite, a rebound in tech stocks, and news related to BTC corporate holdings, but elevated U.S. Treasury yields and hawkish divergence within the Fed limited leverage expansion, so both BTC and ETH showed a volatile rise rather than a one-way breakout.
2. Liquidity Analysis
2.1 ETFs still showed clear net outflows, with weekly net outflows of about USD 1.787 billion from BTC ETFs
From the perspective of ETF flows, last week BTC spot ETFs turned from net outflows of USD 526 million in the previous week to net inflows of USD 197 million, a week-on-week improvement of about USD 724 million; ETH spot ETFs also turned from net outflows of USD 14 million in the previous week to net inflows of USD 84 million, a week-on-week improvement of about USD 98 million. On the BTC side, the strongest product was IBIT, with weekly net inflows of about USD 292 million; the weakest was GBTC, with net outflows of about USD 108 million, followed by FBTC with net outflows of about USD 93 million. On the ETH side, ETHA led with weekly net inflows of about USD 54 million; ETHW still maintained a positive contribution after a large inflow on July 8, while FETH, CETH, and QETH saw slight net outflows.
In terms of AUM, the total net assets of BTC spot ETF products were about USD 76.818 billion. Together with the slight rebound in BTC prices and positive inflows, this should have increased week on week; the ETH ETF page did not stably render precise AUM publicly, so only a qualitative judgment can be made: under the joint effect of rising ETH prices and flows turning positive, ETH ETF AUM most likely improved week on week. Overall institutional sentiment shifted from defensive redemption in the previous week to selective replenishment, but capital was concentrated in leading low-fee products, indicating that the repair in risk appetite remained uneven.
2.2 TradFi Liquidity
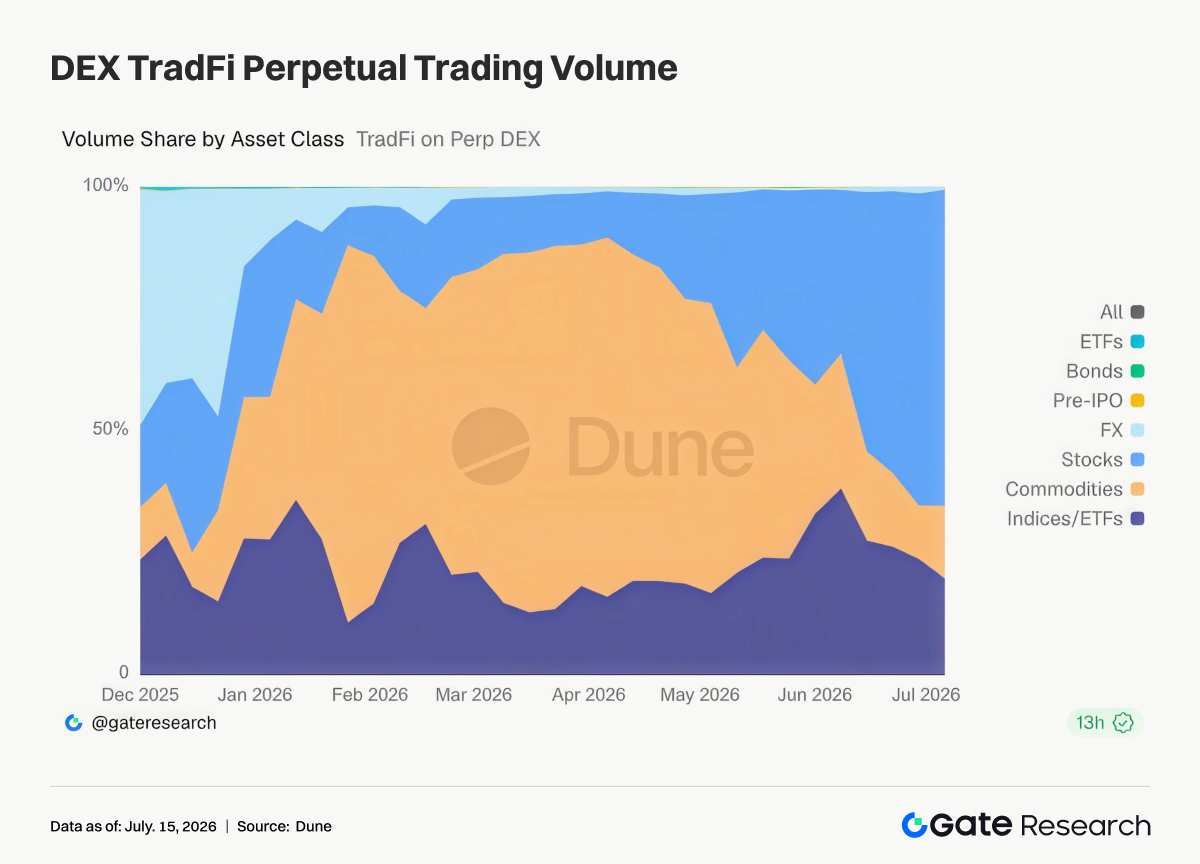
- TradFi Perp DEX: Looking at the trading structure of the overall TradFi Perp DEX market, commodities and equities have always been the two most core trading categories. At the same time, index/ETF products have long maintained a stable share of about 20%–30%, providing investors with indexed allocation tools. This change reflects that the TradFi Perp market is gradually shifting from previous trading centered on safe-haven assets to one dominated by equity risk assets, while maintaining the market characteristics of multi-asset and 24/7 round-the-clock trading. Commodity perpetual contracts remain the fastest-growing segment since 2026, while equity trading has become the main direction of recent capital inflows.
- Gate TradFi Trading Volume: Over the past week, Gate TradFi total trading volume remained around USD 85 billion, basically flat from the previous week and still at a high level over the past several months, showing that user trading activity remained stable. In terms of trading structure, CFDs still occupied an absolute dominant position, accounting for about 95% of total turnover; spot accounted for a low share, while Perp trading maintained a stable contribution of about 4%–6%. Although total trading volume retreated from the stage high of about USD 98 billion at the end of June, the overall fluctuation was limited, reflecting that during the process of recovering market sentiment, user demand for trading TradFi products such as equities, indices, foreign exchange, and commodities remained strong, and the platform's trading scale stayed at a high level for several consecutive weeks.
- Gate U.S. Equity Asset Trading Volume: From the market structure, the trading focus of Gate Stocks has changed significantly over the past more than one month. At the beginning of June, trading volume was almost entirely concentrated in U.S. equities, with the share remaining above about 80% for a long time. As Hong Kong and Korean equities were launched one after another, the trading structure diversified rapidly, among which Korean equities showed the most significant growth, with the share quickly rising to about 60%–90% from the end of June and becoming the market with the largest trading volume on the platform in early July. By contrast, the share of U.S. equities fell back to about 10%–30%, Hong Kong equities maintained a stable share of about 2%–6%, and the share of ETF trading continued to decline from about 20% to less than 5%, showing that capital is accelerating its concentration toward newly launched markets such as Korean equities.
- TradFi Order Book Depth: We selected XAUT, which had the highest TradFi trading volume, to analyze its order book depth (Delta). Over the past week, the price of XAUT fluctuated lower overall, falling back from about USD 4,090 to around USD 4,000 and breaking key support several times during the period. Order book liquidity Delta showed relatively frequent switching between buying and selling forces in the market. Around July 13, there were consecutive large positive Delta readings, with hourly net buying at one point exceeding USD 1.8 million, but the price failed to stabilize effectively, indicating that active buying was mainly used to absorb selling pressure rather than push a trend reversal. Overall, liquidity still leaned to the buy side, but price performance was weak, reflecting some cooling in safe-haven demand, and gold still faced pressure in the short term from profit-taking and recovering risk appetite.
3. On-Chain Data Insights
3.1 Robinhood Chain Meme narrative drives expansion in Uniswap trading volume
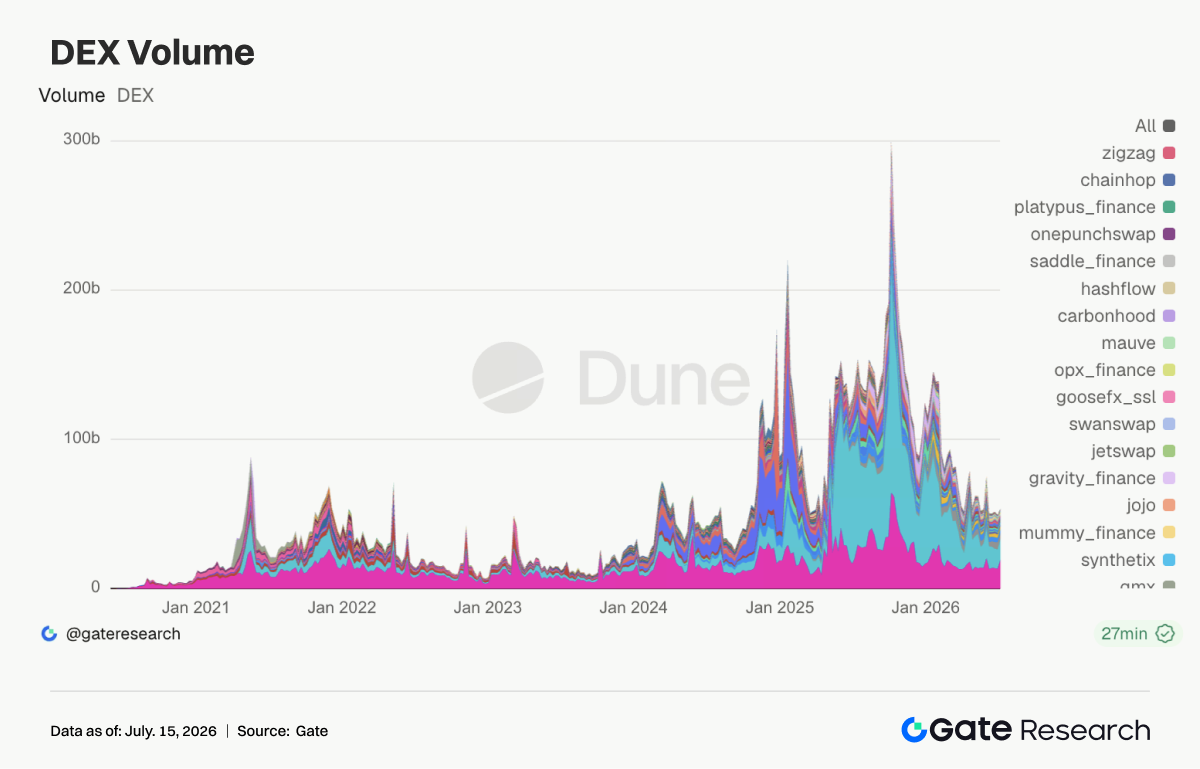
This week, Uniswap turnover rose to about USD 19.24 billion, expanding significantly from the previous week. The core drivers were Robinhood's promotion of tokenized stocks and the heating up of the Robinhood Chain Meme narrative. As the main trading gateway for multi-chain assets such as Ethereum and Robinhood Chain, Uniswap absorbed turnover demand for RWA, related concept assets, and Meme assets. At the same time, PumpSwap, Meteora, Raydium, and Whirlpool all retreated from the previous week, showing that the popularity of Solana launchpad-style memes cooled and some attention shifted toward the Robinhood Chain side.
3.2 Stablecoin supply diverges mildly, while Circle regulatory progress strengthens the institutional narrative of USDC
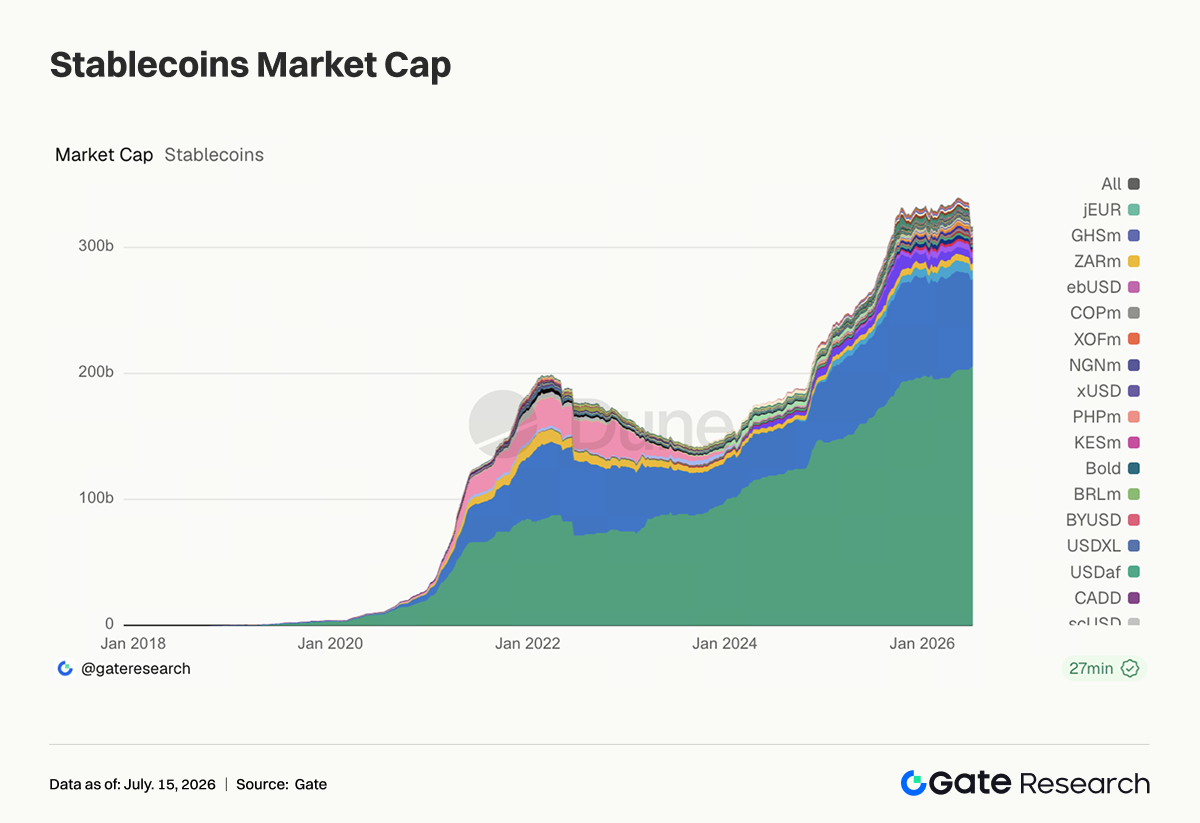
This week, the overall stablecoin market was relatively steady. USDT maintained the largest scale and rebounded slightly. USDC increased slightly to about USD 69.2 billion, DAI rose to about USD 5.32 billion, PYUSD was basically flat, and GHO was stable around USD 600 million. It is worth noting that after Circle made regulatory progress related to a U.S. trust bank, the institutional compliance narrative of USDC continued to strengthen, and the market viewed stablecoins as infrastructure for payments, broker settlement, and RWA trading. By contrast, USDe fell from about USD 5.06 billion to about USD 4.56 billion, while USDS and USD1 also retreated, and the expansion pace of yield-bearing and politically/brand-driven stablecoins slowed. The main stablecoin theme this week was that compliant U.S. dollar assets were more favored by institutions, while yield-bearing assets entered a cooling phase.
3.3 The LST sector turns toward divergence, with ETH staking assets supported by RWA and mainnet liquidity
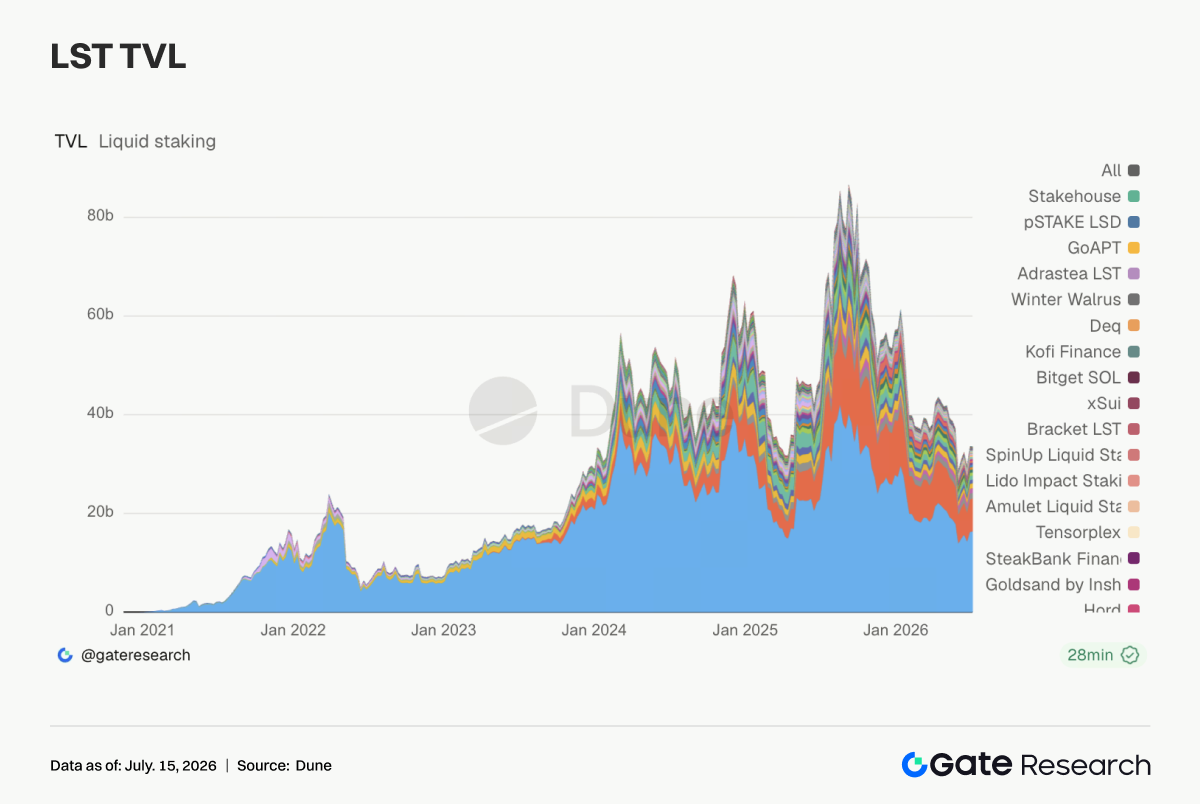
This week, the LST sector showed divergent performance. Lido TVL rose to about USD 16.41 billion, while Rocket Pool, StakeWise, and mETH Protocol all recorded slight growth, and ETH-side staking assets continued a mild repair. Behind this, on the one hand, was the ETH price factor, and on the other hand, it was also related to Ethereum further becoming the main venue for the narratives of RWA, tokenized stocks, and institutional on-chain settlement. By contrast, SOL-side LSTs were clearly under pressure, with Sanctum, Jito, Jupiter Staked SOL, and DoubleZero Staked SOL all retreating from the previous week, reflecting that after the cooling of Solana meme and launchpad trading, the elasticity of staking assets also weakened simultaneously. Kinetiq kHYPE also fell back from high levels, indicating that the capital chase for high-beta LSTs began to cool.
3.4 Aave lending is underpinned by Ethereum and Plasma, while RWA and stablecoin financing demand supports core markets
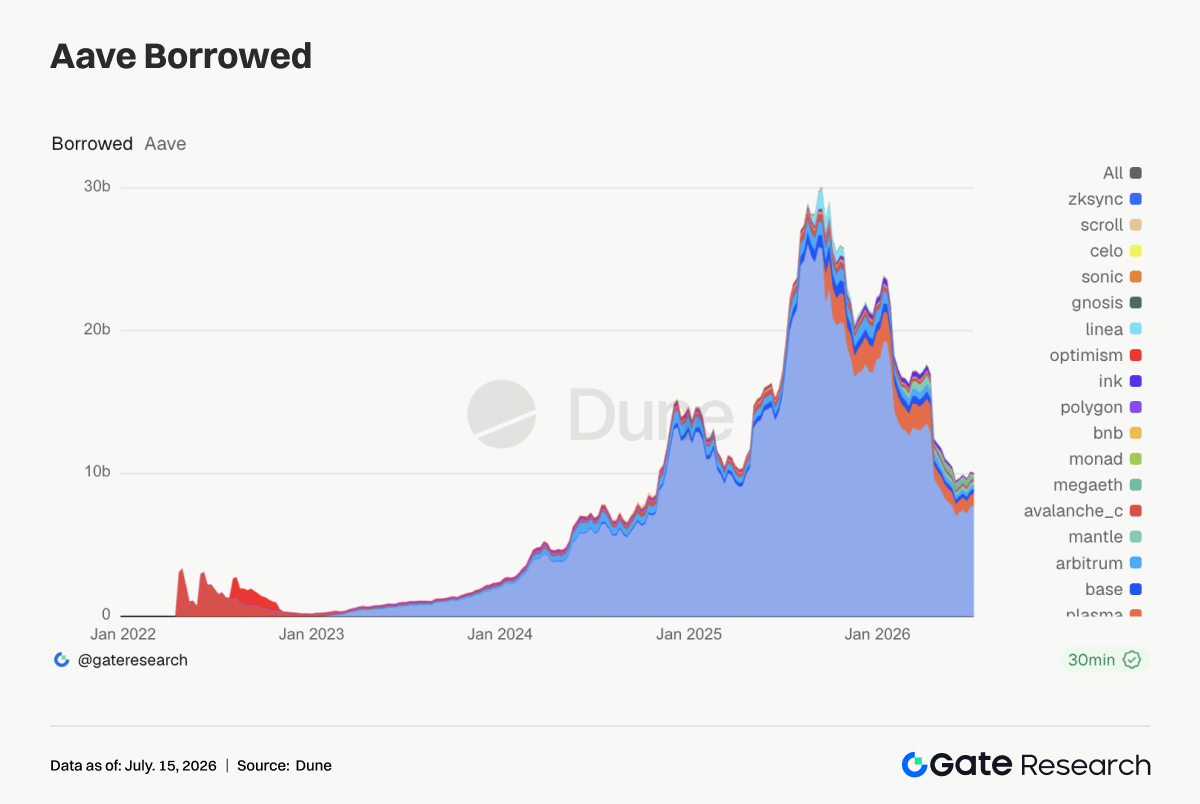
Aave lending scale continued to repair this week, with borrowing balances in the Ethereum market rising to about USD 7.78 billion, the most core liquidity pool of the protocol. Plasma borrowing scale rose to about USD 890 million, while Base and Arbitrum improved slightly, showing that there was still demand for stablecoin financing and collateral recycling on mature chains. At the same time, MegaETH borrowing balances fell sharply from about USD 386 million to about USD 118 million, while Mantle, Avalanche, and Ink also declined, indicating that incentive-driven lending demand on emerging chains began to ebb. Aave's capital is moving back from high-volatility new chains to markets with more reliable collateral depth and liquidation liquidity.
3.5 Aave rates show that U.S. dollar financing remains restrained, while tail-end volatility in USDT reflects short-term trading demand
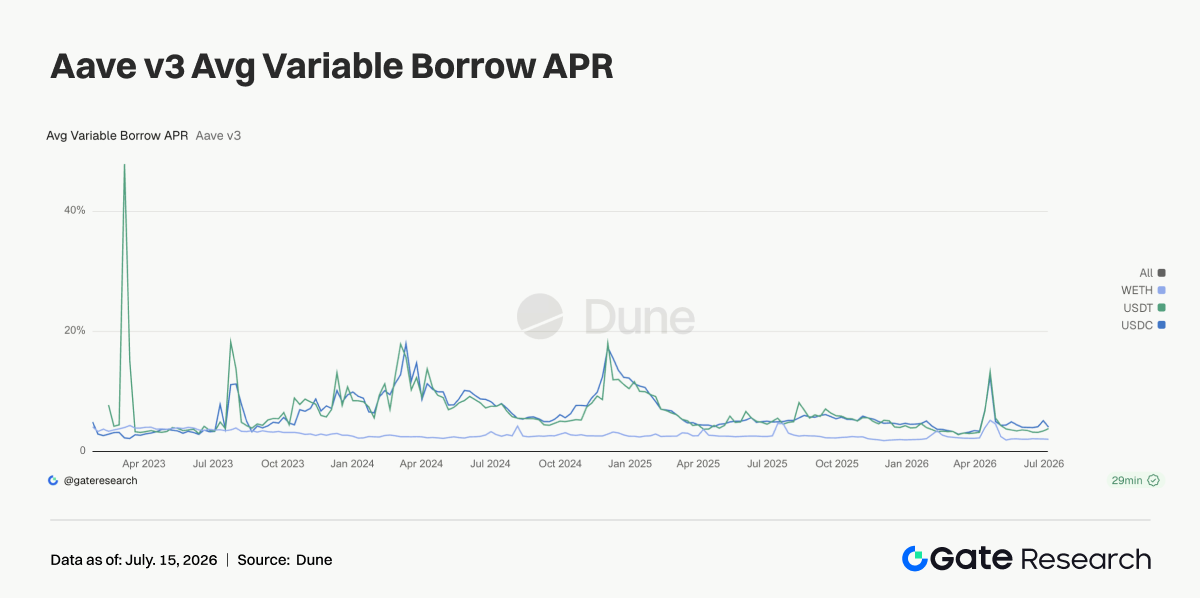
This week, borrowing rates in Aave's Ethereum main market generally remained at low levels. The average borrowing rate of USDC fell from about 5.15% to about 4.1%, indicating that although demand for compliant U.S. dollar assets was strong, systemic funding tightness had not yet formed. The average rate of WETH fell slightly to about 2.07%, and ETH leverage remained relatively restrained, with no one-way chase-style borrowing. The average rate of USDT rose to about 3.87%, with the highest rate during the week reaching about 9.37%, as demand for short-term trading and arbitrage expanded in certain periods. Combined with the expansion in Uniswap volume and the activity of TradFi perpetuals, capital this week tended to turn over quickly around hot narratives. The signal from the rates side was calmer than trading volume: risk appetite recovered, but capital was still controlling duration and leverage exposure.
3.6 Protocol revenue cools, and hot trading has not fully translated into expanded protocol profitability
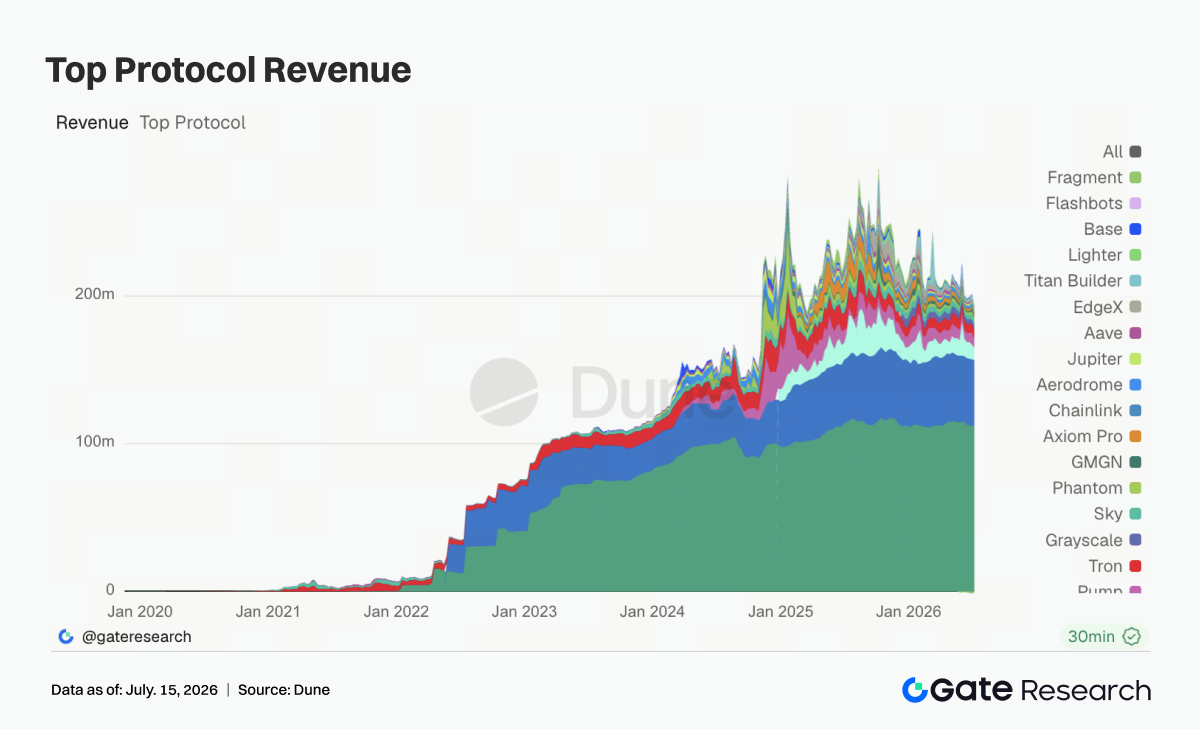
This week, protocol revenue cooled overall. Tether and Circle still ranked in the top two with revenues of about USD 112 million and USD 44.84 million, respectively, and the stablecoin issuance side continued to maintain the industry's revenue base. Hyperliquid revenue fell to about USD 8.44 million; although on-chain TradFi perpetual turnover expanded, the profitability elasticity of crypto-native perpetuals weakened somewhat. Pump revenue fell to about USD 6.29 million, mutually confirming the pullback in PumpSwap and Solana meme trading. Titan Builder declined significantly from the previous week's high, indicating that order flow and MEV pulses did not continue. Axiom Pro, Jupiter, Aave, and Aerodrome revenue were also similarly weak.
Derivatives Tracking
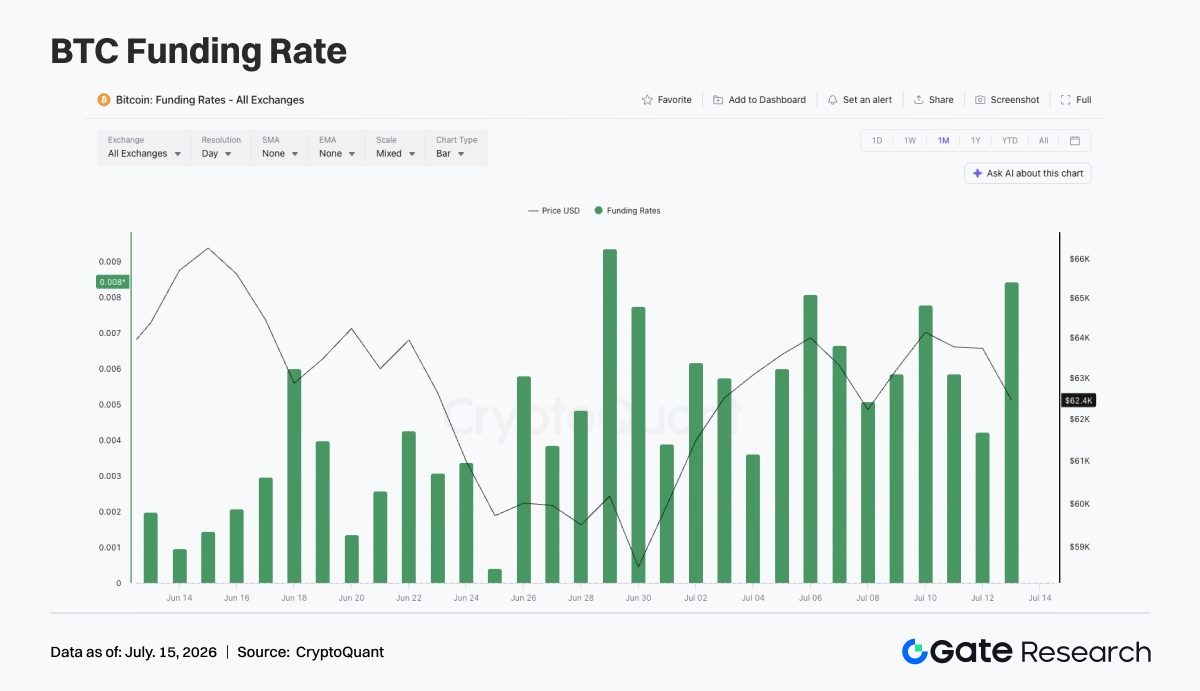
4.1 BTC funding rates remain positive, prices repair in volatility, but long crowding increases somewhat
Last week, the price of BTC overall showed a volatile repair trend. At the beginning of the week, the price traded around USD 62,000, then briefly fell below USD 62,000 around July 8, but quickly repaired again and remained in the USD 63,000 to USD 64,000 range from July 10 to July 12. Overall, the price was still in a low-level repair stage, but the strength of the upward breakout was limited. In terms of OI, fluctuations were relatively obvious this week. Around July 6, OI was about USD 21.4 billion, then once fell back to around USD 20.9 billion, and around July 10 quickly rebounded to about USD 21.9 billion. The rebound in price together with the rebound in OI shows that leveraged capital was still trying to re-participate in rebound trading, but positions did not form a sustained one-way expansion.
Funding rates remained positive throughout the week and saw phased highs around July 6 and July 10, showing that long sentiment still dominated. Compared with price performance, the positive level of funding rates was relatively high, indicating that the market had already re-accumulated a certain amount of long exposure before prices had effectively broken out.
Taken together, the BTC derivatives market this week showed a structure of 'volatile price repair + range-bound OI fluctuation + continuously positive funding rates.' If the price can stand firmly above USD 64,000, the current leverage structure may support a further rebound; but if the price falls back again toward USD 62,000, long positions under the continuously positive funding-rate environment may face retracement pressure.
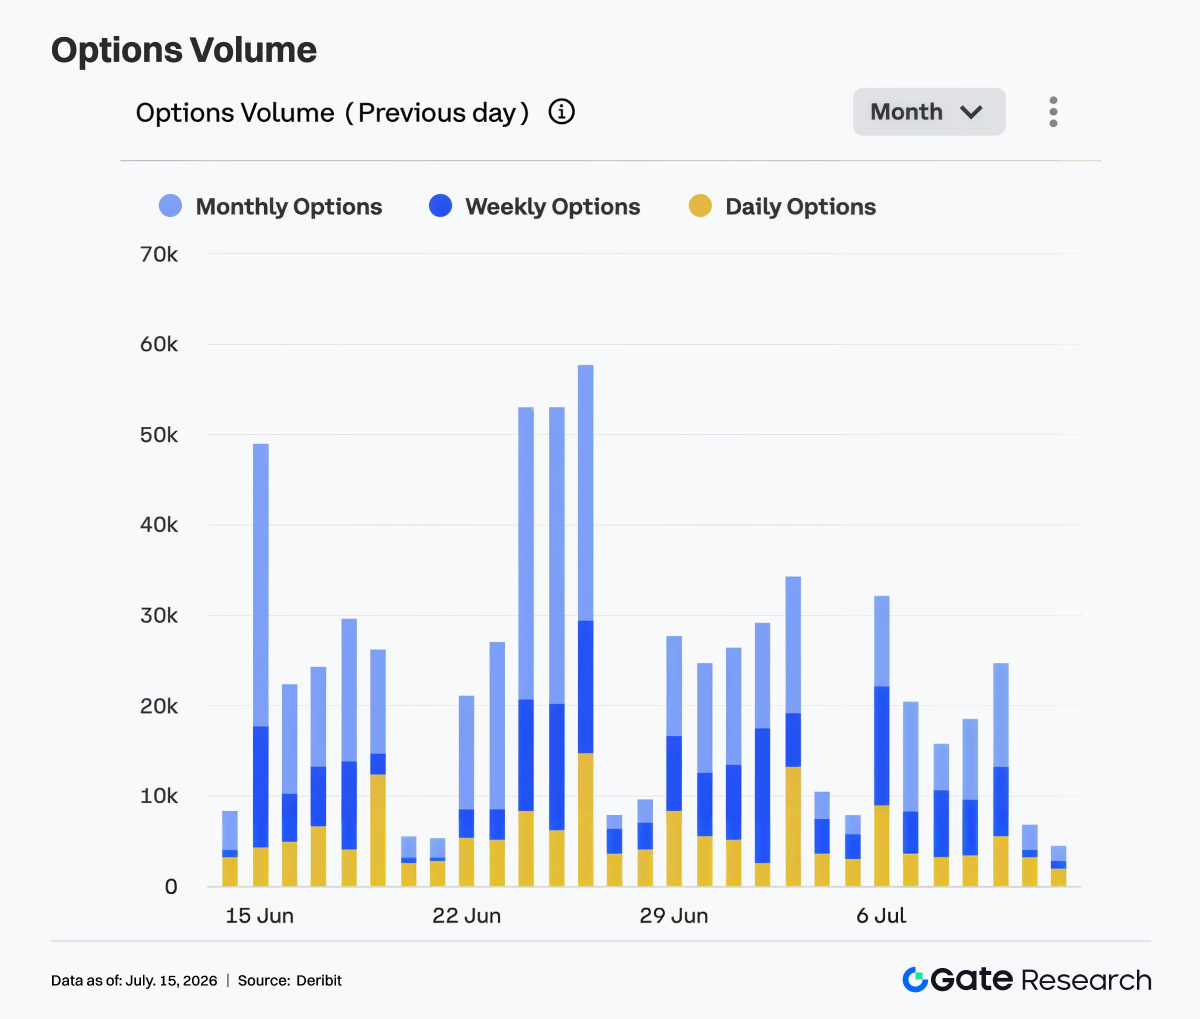
4.2 Options trading volume cools overall, and short-term trading demand declines somewhat
The options side cooled significantly last week. On July 6, trading volume was about 32,000 contracts, a relative high for the week, and then volume gradually fell back. From July 7 to July 10, volume mostly stayed in the 16,000 to 25,000 range, and over the weekend it further dropped to around 5,000 to 7,000. Structurally, monthly options remained the main source of turnover, showing that market participants continued to carry out position management and directional positioning through medium- and long-dated contracts. Weekly options maintained some activity on certain trading days, but did not show obvious volume expansion. Daily options accounted for a limited overall share of turnover, indicating that demand for short-dated event trading fell back significantly compared with the previous few weeks.
The decline in trading volume mutually confirms the volatile repair in price. After the market experienced the earlier decline and end-of-month rollovers, both protective demand and short-term volatility trading cooled, and the options market entered a relatively stable stage. Overall, the options market this week showed a structure of 'cooling turnover + monthly contracts dominating + declining short-cycle demand.' If BTC subsequently breaks above USD 64,000, options trading volume may rebound together with directional trading; if the price continues to move sideways, turnover may remain low.
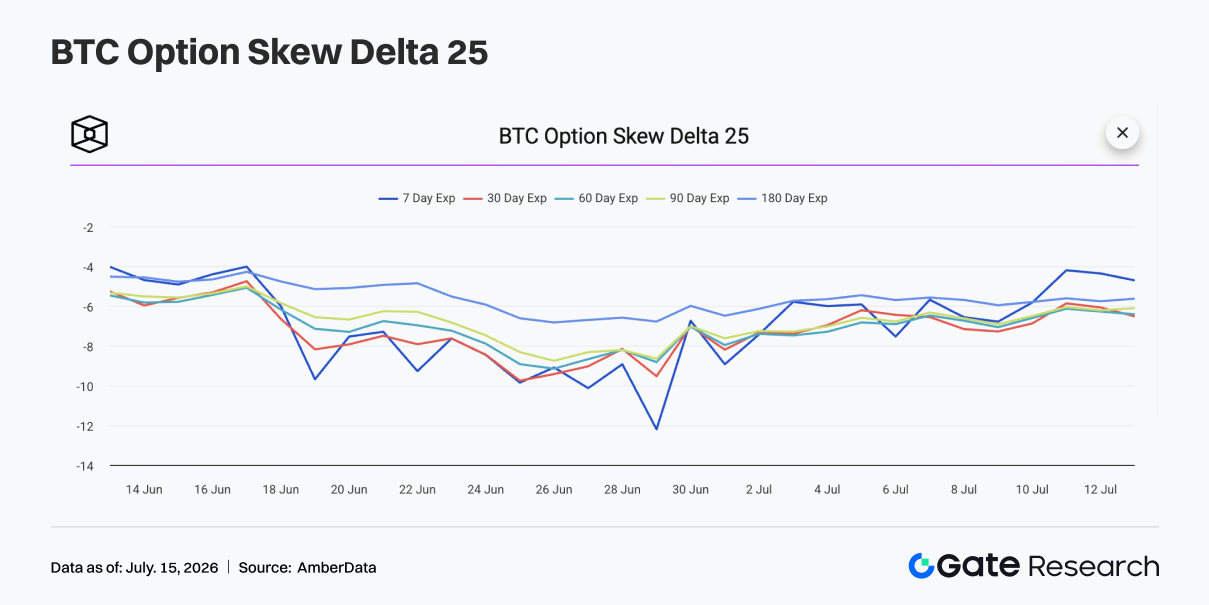
4.3 25D Skew repairs mildly, and short-dated defensive sentiment eases clearly
From the perspective of 25D Skew, BTC Skew across maturities remained negative last week, but overall repaired compared with the earlier period. At the beginning of the week, 7D Skew was still near -7, indicating that the market still maintained some defense against short-term downside risk, but compared with the deeply negative range at the end of June, demand for protection had already declined significantly. As BTC prices gradually stabilized, the repair in short-dated Skew was more obvious. From July 10 to July 12, 7D Skew once rebounded to around -4 to -5, showing that the premium for short-term downside protection fell back somewhat, and market concern about sharp short-term declines weakened.
Skew repaired more slowly in the medium and long maturities, with 30D, 60D, 90D, and 180D Skew mostly still in the -5 to -7 range. This shows that although the market was no longer extremely defensive, it still maintained some pricing for medium-term downside risk, and the options side had not fully turned optimistic. Overall, the Skew structure this week showed that defensive sentiment had eased but not disappeared. If BTC stands firmly above USD 64,000, short-dated Skew is expected to continue repairing toward the neutral range; if the price falls back below USD 62,000, protective demand may heat up again.
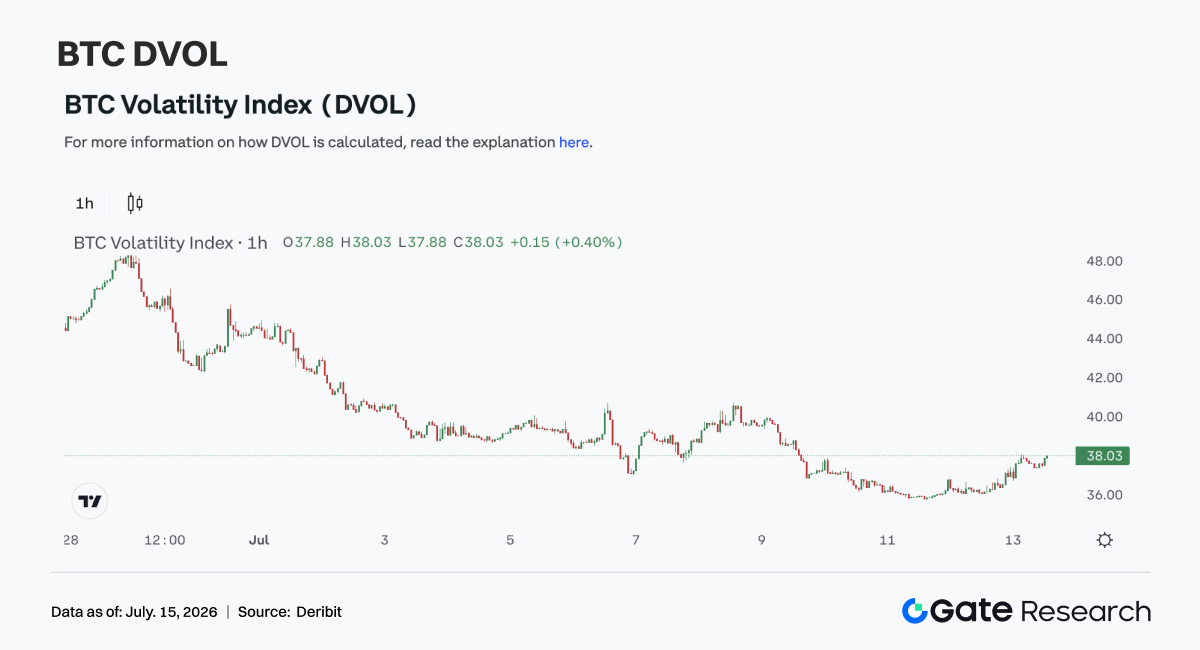
4.4 DVOL continues to fall back, and volatility expectations continue to compress
In terms of volatility, the BTC volatility index DVOL continued to decline last week. At the beginning of the week, DVOL was still around 39 to 40, then gradually fell back as price fluctuations converged and options turnover cooled, and dropped to the 36 to 38 range from July 10 to July 12. The decline in DVOL shows that market expectations for future violent fluctuations continued to decrease. Although prices did not show an obvious breakout, they also did not break key support again. Together with the repair in Skew and the decline in options trading volume, the volatility risk premium was further released.
Compared with the previous few weeks, the derivatives side this week has shifted from 'protective pricing' to 'low-volatility repair.' The market is no longer buying short-term protection on a large scale, and options pricing of downside risk has tended to stabilize. Overall, BTC is currently in a combined state of 'volatile price repair + volatility compression + mildly negative Skew.' If the price continues to stay in the USD 62,000 to USD 64,000 range, DVOL may remain low; only if a directional breakout appears later may volatility expand again.
4. Outlook
Data Sources:
- Investing, https://investing.com/currencies/xau-usd-historical-data
- Gate, https://www.gate.com/trade/BTC_USDT
- CMC, https://coinmarketcap.com/real-world-assets/?type=all-tokens
- Coinglass, https://www.coinglass.com/pro/depth-delta
- Dune, https://dune.com/gateresearch/gate-tradfi#weekly-volume
- Dune, https://dune.com/gateresearch/gate-institutional-weekly-report
- Bybit, https://www.bybit.com/future-activity/en/tradfi
- Bitget, https://www.bitgettradfi.com/tradfi/XAUUSD
- CryptoQuant, https://cryptoquant.com/asset/btc/chart/derivatives
- Amberdata, https://pro.amberdata.io/options/deribit/btc/current/
Gate Research is a comprehensive blockchain and cryptocurrency research platform that provides deep content for readers, including technical analysis, market insights, industry research, trend forecasting, and macroeconomic policy analysis.
Disclaimer
Investing in cryptocurrency markets involves high risk. Users are advised to conduct their own research and fully understand the nature of the assets and products before making any investment decisions. Gate is not responsible for any losses or damages arising from such decisions.