Summary
- In April, both BTC and ETH strengthened simultaneously, with market risk appetite recovering significantly compared with March. Major pricing anchors were the first to complete a technical path of “bottoming out → reclaiming higher levels,” providing the foundation of risk appetite for altcoin and thematic sector rotations.
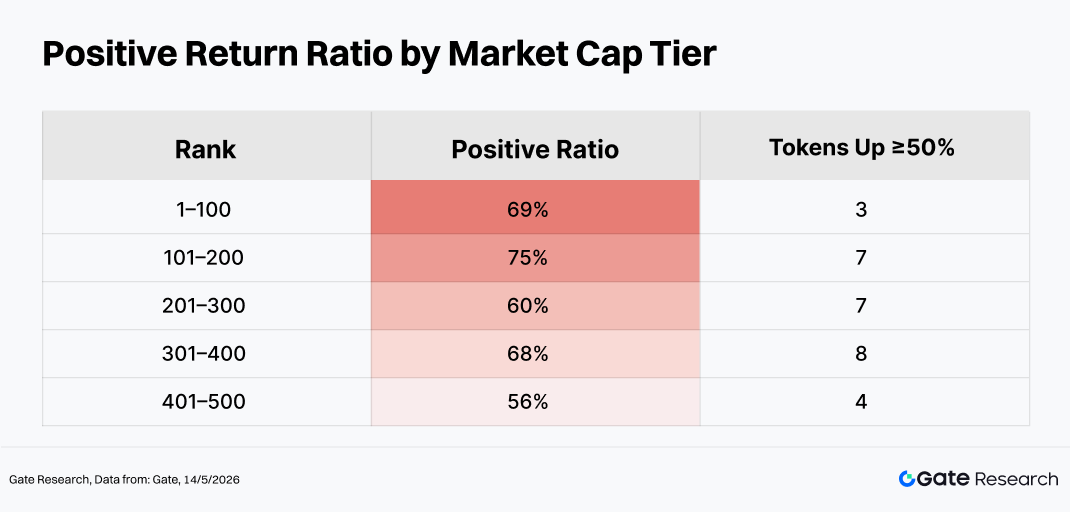
- The equal-weighted average gain of the top 500 tokens by market capitalization was approximately +12.0%; the 101–200 ranking segment posted gains of around +20.4%, making it the strongest-performing tier of the month; the top 1–100 ranking segment rose approximately +11.6%.
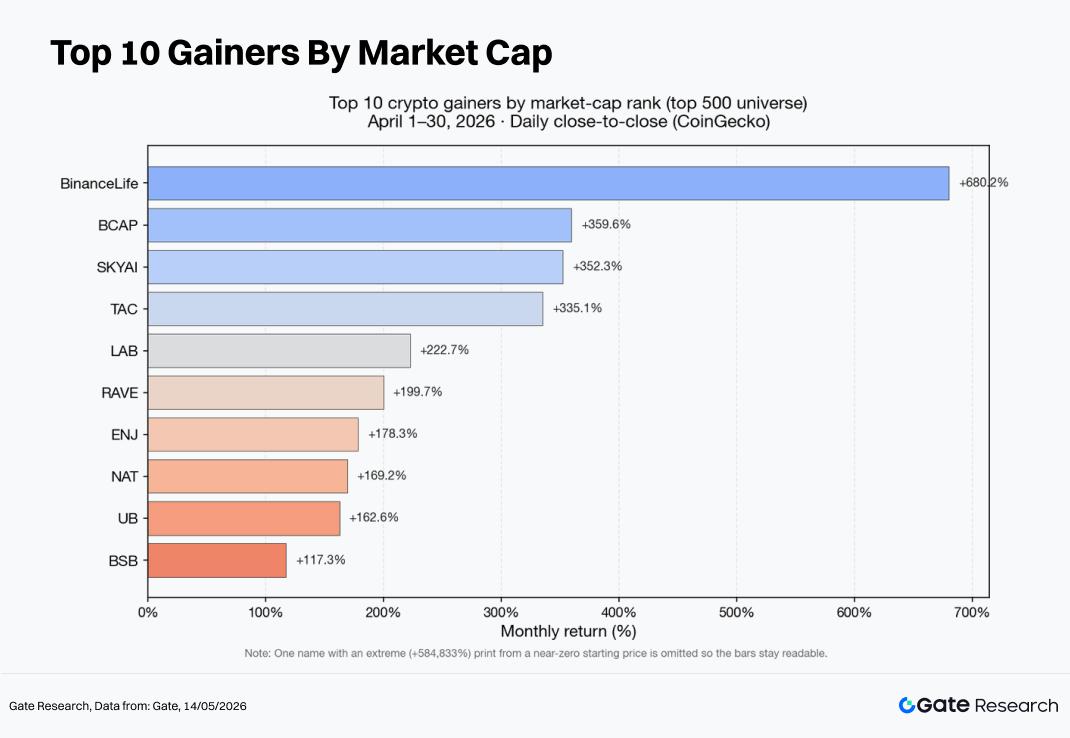
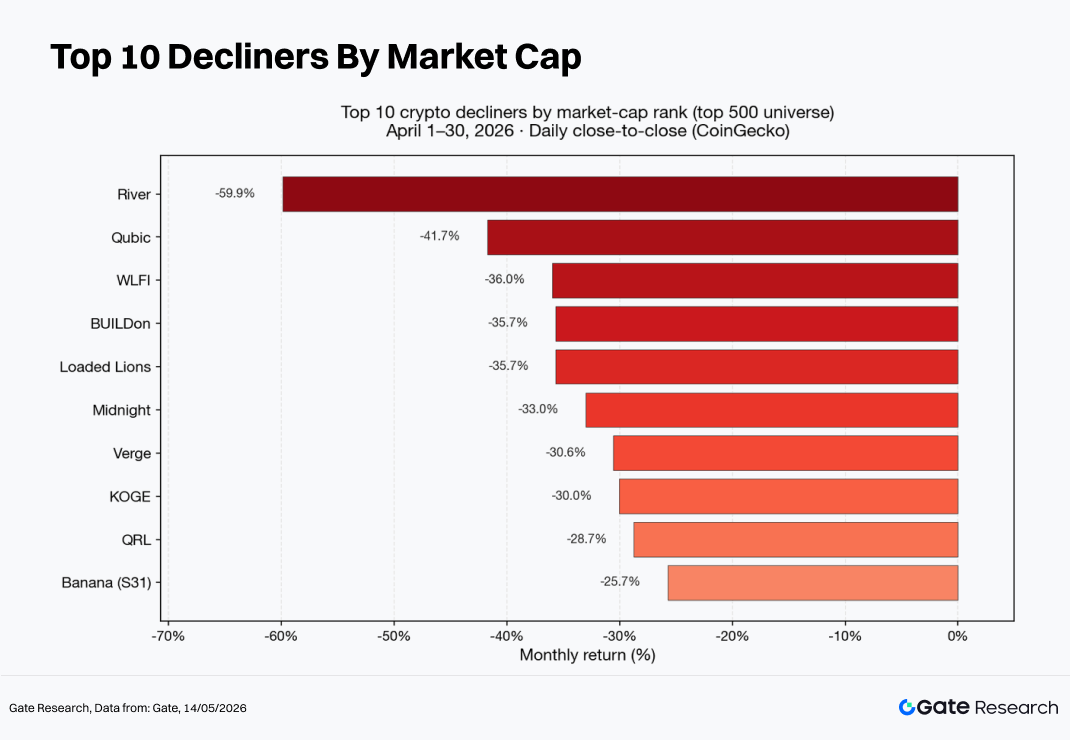
- At the individual token level, high-beta assets, Meme narratives, and sector-driven themes coexisted. Leading gainers included Binance Life, BCAP, SKYAI, and TAC, while major decliners included RIVER, QUBIC, and WLFI.
- Within the top 100 market-cap tokens, LUNC, PENGU, JST, and ARB recorded strong positive returns, while WLFI, TRUMP, and TAO faced downside pressure. Compared with March’s more concentrated “AI-led rally,” April more closely resembled a market environment characterized by “multiple parallel narratives + unwinding of crowded trades.”
- In terms of trading volume, ENJ and SKYAI demonstrated classic breakout rallies accompanied by volume expansion; ONT weakened despite rising volume, reflecting intensifying market divergence; NIGHT posted sharp declines with trading volume falling below 20% of March levels, showing clear signs of low-volume correction. BTC and ETH both rose in price while trading volume contracted, indicating that broad-based incremental momentum has not yet formed across the entire market.
1. Crypto Market Overview
In April, the global macro environment and market risk appetite improved significantly compared with March. Economic data and policy expectations across major economies gradually underwent repricing amid volatility, while marginal safe-haven sentiment eased. As a result, equity markets and interest-rate-sensitive assets rebounded simultaneously, and the crypto market, as a high-beta risk asset class, also experienced a phase of recovery.
BTC first bottomed out during the month before strengthening again, reaching a local low around April 3 and then establishing a new short-term high toward the end of the month, reflecting a “risk-appetite-driven recovery rally.” BTC gained approximately 11.9% during April, while ETH rose around 7.3%.
Meanwhile, BTC ETF inflows reached as high as $2.44 billion in April, marking the largest monthly inflow since October 2025. Total BTC ETF assets under management surpassed $100 billion for the first time, signaling a structural shift in how institutional capital gains exposure to Bitcoin.
On the on-chain side, stablecoin circulating market capitalization continued its moderate expansion. According to DeFiLlama’s stablecoin metrics, total stablecoin supply increased from approximately $315.2 billion on March 31 to around $319.4 billion on April 30, representing a net monthly increase of more than $4 billion and providing liquidity support for trading activity and cross-chain capital flows.
Meanwhile, Total Value Locked (TVL) in DeFi displayed a “surge followed by retracement” pattern. According to DeFiLlama’s cross-chain TVL data, TVL stood at approximately $92 billion at the end of March, rose to around $94.3 billion on April 1, briefly approached approximately $97.7 billion in mid-April, and then fell back to roughly $83.5 billion by the end of April — a decline of around $8.5 billion compared with the end of March.
The decline in TVL should not be interpreted solely as capital outflows. Price corrections in tokens directly reduce the USD-denominated value of locked assets. In addition, protocol migrations, methodology adjustments, deleveraging, and profit-taking can all contribute to temporary pullbacks. Therefore, despite most major tokens still closing April with positive monthly returns, a more reasonable interpretation of the TVL decline is that it reflects post-expansion valuation retracement and structural rebalancing, which should be cross-validated together with trading volume, stablecoin supply, and derivatives open interest.
This report analyzes tokens ranked within CoinGecko’s top 500 by market capitalization, calculating price performance between April 1 and April 30, 2026, based on daily closing prices. Using an equal-weighted methodology for start-to-end closing prices, the study excludes extremely low-priced tokens that could introduce price-noise distortions. The effective sample size is approximately 479 tokens.
Based on the equal-weighted cross-sectional price index derived from daily closing prices, the market recorded an overall average monthly gain of approximately +12.0%, significantly outperforming March’s weak environment, during which the full sample posted an average decline of approximately −7.7%. From the beginning to the end of April, the index rose around 8.32%. The local low occurred near April 5, while the local high was concentrated around April 27, forming a trajectory characterized by “early-month consolidation followed by rising risk appetite in the mid-to-late month,” with volatility expansion becoming increasingly visible later in the month.
From a market capitalization segmentation perspective:
- The 101–200 ranking segment remained the strongest in terms of price elasticity, continuing the “mid-tier relative outperformance” observed in March;
- The rising average performance of the 301–400 segment suggests that medium-to-small-cap tokens are more likely to benefit from rotational flows during periods of improving risk appetite — consistent with the classic pattern of “BTC stabilization → capital flowing outward into higher-beta assets”;
- The 401–500 segment still retained thematic trading opportunities, although its contribution to broad market averages was weaker than that of the mid-tier segments.
It is worth noting that within the same market-cap segment, the “average” return was often significantly higher than the “median” return, indicating that a small number of high-elasticity assets sharply boosted the average — a typical long-tail distribution pattern. Overall, the market simultaneously displayed broad-based recovery led by mid-to-large caps and excess elasticity concentrated in upper-mid-ranked tokens, with capital rotating between beta recovery trades and high-beta speculative rotations.
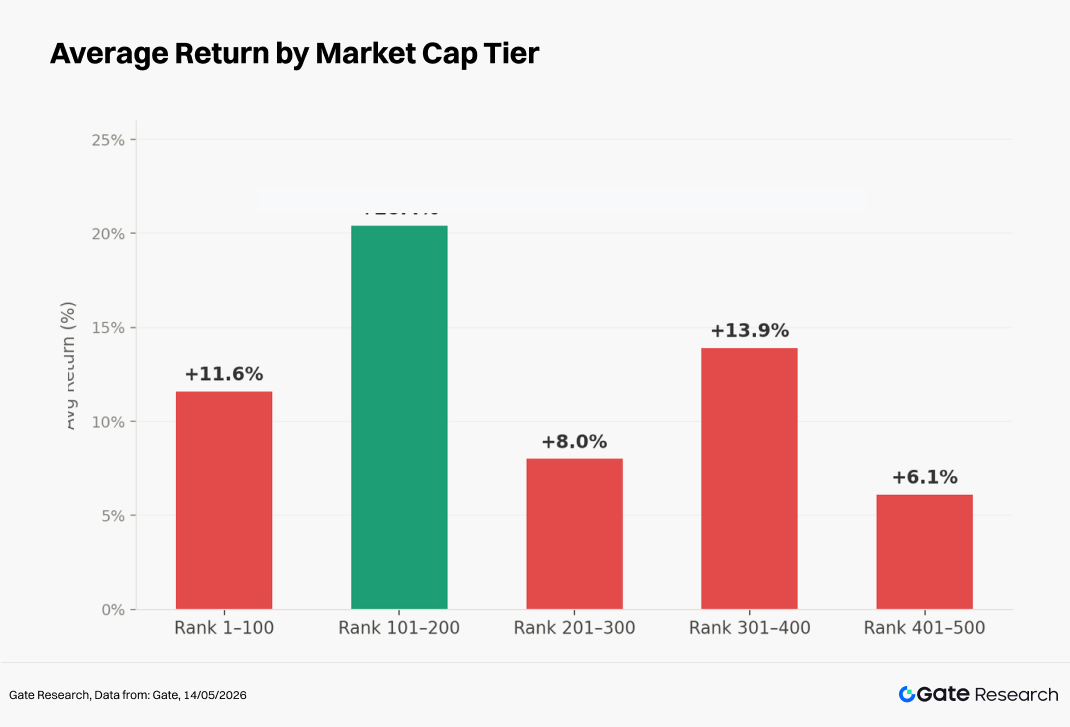
> Note: Market capitalization segmentation is based on CoinGecko data. Tokens ranked within the top 500 by market capitalization were grouped in batches of 100 (e.g., ranks 1–100, 101–200, etc.). Price performance between April 1 and April 30, 2026 was calculated for each group, and the average return of each group was used as the representative performance metric for that market-cap segment. Throughout this report, return calculations are based primarily on daily closing prices; therefore, deviations may exist compared with hourly averages or intraday extreme values. Extremely low-priced tokens were excluded from average calculations because price noise could otherwise generate distorted returns of several thousand percent.
2.1 Top Gainers and Losers
At the individual token level, performance patterns aligned closely with market-cap segmentation trends. The top gainers continued to be dominated by mid-to-small-cap, high-volatility, and community/theme-driven assets (such as Binance Life, BCAP, SKYAI, and TAC), while the worst performers were largely assets experiencing post-crowded-trade unwinding or deteriorating liquidity conditions (such as RIVER, QUBIC, and WLFI).
Even within the top 100 market-cap tokens, performance divergence remained significant. LUNC, PENGU, ARB, ZEC, and MORPHO recorded strong positive returns, while WLFI, TRUMP, TAO, MNT, and WLD either underperformed or experienced deep pullbacks.
2.1.1 Top Gainers: Mid-to-Small-Cap High-Beta Assets Continue Dominating Structural Rally
The strongest gainers in April included Binance Life (approximately +680%), BCAP (approximately +360%), SKYAI (approximately +352%), TAC (approximately +335%), and LAB (approximately +223%), with returns significantly exceeding overall market averages.
These tokens shared several common characteristics: marginal buying pressure exerted outsized impact due to relatively manageable circulating market caps; community-driven attention created substantial narrative premiums; and the assets aligned well with high-beta preferences during phases of recovering risk appetite. However, it should also be emphasized that liquidity profiles for such assets are often highly uneven, with rapid rallies frequently accompanied by thin order books and amplified slippage, creating higher barriers for trading strategies.
Key Drivers
- Narratives and communities: Meme projects, fan-economy concepts, and Chinese community-driven themes tend to attract amplified short-term speculative capital during periods of rising risk appetite;
- Circulating supply and volatility: Many of these assets maintain relatively controllable circulating market caps, meaning the same amount of marginal capital can generate much larger price elasticity;
- Rotation dynamics: Once BTC and ETH stabilize, trading-oriented capital tends to rotate outward into higher-beta tail assets.
2.1.2 Top Losers: High-Volatility Themes Retrace as Speculative Sentiment Cools Rapidly
The biggest decliners in April included RIVER (approximately −60%), QUBIC (approximately −42%), WLFI (approximately −36%), NIGHT (approximately −33%), and XVG (approximately −31%).
The main sources of downside pressure generally fell into three categories:
- Mean reversion and profit-taking after excessive prior gains;
- Valuation compression caused by crowded sector positioning;
- Project-level uncertainties — including token unlocks, governance issues, compliance concerns, or liquidity exhaustion — becoming amplified when marginal risk appetite weakens.
Key Pressure Factors
- Mean reversion and profit-taking following excessive prior rallies; as marginal liquidity tightens, Meme and newly emerging narrative assets become more vulnerable to valuation compression;
- Valuation compression caused by crowded sector positioning, especially as attention and financing tend to rotate away from tail assets during recoveries led by larger-cap tokens;
- Project-specific uncertainties such as unlock schedules, governance risks, compliance concerns, or liquidity exhaustion, which become magnified during rapid market declines when downside liquidity support is insufficient.
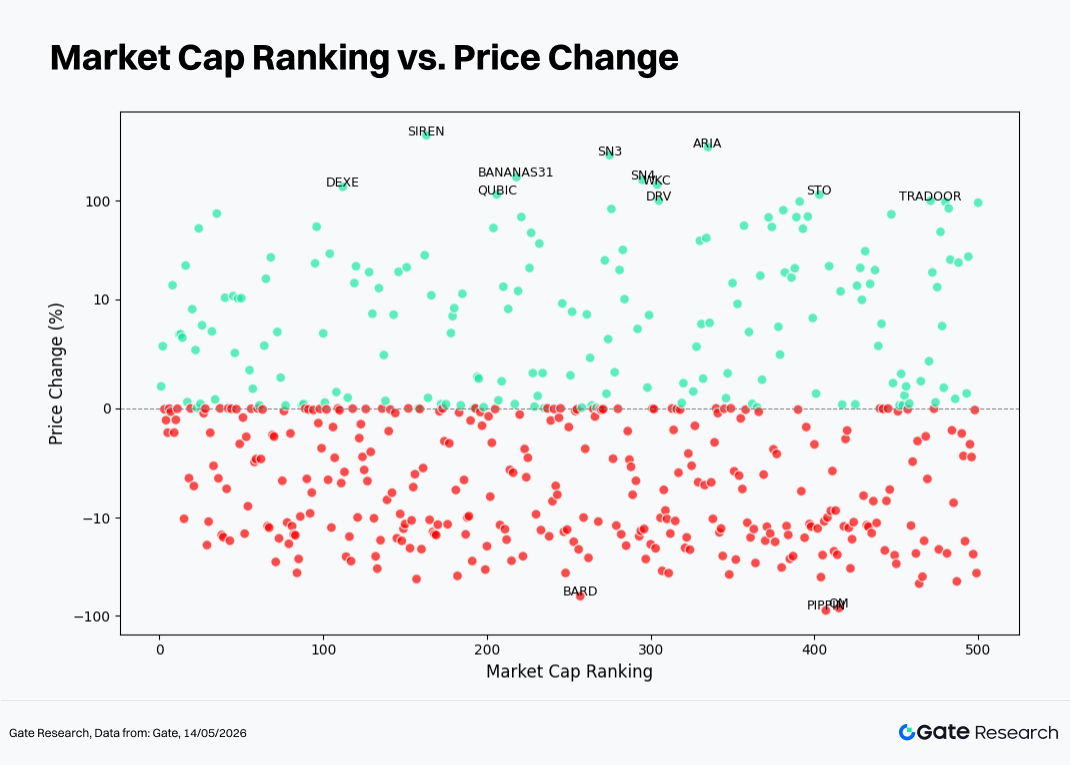
When plotting market-cap ranking on the horizontal axis and monthly returns on the vertical axis, the most visually obvious difference between April and March is the significant increase in samples located above the zero-return line, reflecting broad-based market recovery.
However, extreme returns remained concentrated primarily in mid-to-lower market-cap segments, suggesting that alpha generation continued to rely more on structural selection rather than broad beta expansion. This also explains the divergence between relatively moderate gains in ETFs or market-cap-weighted indices and the market perception that “profit opportunities were concentrated in only a handful of themes.”
- Near the Zero Line: Approximately 158 assets (around 31.5% of the effective sample) traded within a narrow ±2% range; approximately 236 assets (around 47.4%) remained within ±5%. A substantial portion of these consisted of stablecoins and cash-equivalent assets, although a meaningful number were also low-volatility tokens. As a result, the chart displayed the characteristic pattern of “overall returns shifting upward while the zero-return area remained heavily crowded.”
- Green Dots (Positive Returns)
- Excluding extreme outliers such as Asteroid, the equal-weighted average return of the remaining approximately 497 tokens was around +12.2%, with a standard deviation of approximately 48.5%, indicating generally strong market conditions in April.
- The median market-cap ranking among profitable tokens was approximately No. 235. However, the 101–200 segment recorded both the highest average return and the largest proportion of tokens achieving gains above 50%, making it a classic “upper-mid-cap elasticity zone.”
- The cross-sectional volatility of positive-return tokens within the 101–200 segment (positive-return subset standard deviation approximately 84%) was significantly higher than that of the 401–500 segment (approximately 29%), matching the observed pattern in which moderate gainers coexisted alongside several-fold narrative-driven rallies within the same ranking band.
- Extreme gainers with returns ≥200% primarily included Binance Life (approximately +680%, market-cap rank around 129), BCAP (approximately +360%, rank around 75), SKYAI (approximately +352%, rank around 81), TAC (approximately +335%, rank around 326), and LAB (approximately +223%, rank around 170), indicating that concentrated excess returns remained focused in mid-to-lower-ranked, high-beta thematic assets.
- Within the top 100, more tokens clustered within moderate appreciation ranges, with roughly two-thirds remaining within approximately ±8%, reflecting a structure in which “market leaders participated in the rebound, but explosive alpha opportunities more often emerged outside the very top-tier assets.”
-
Red Dots (Negative Returns)
-
The median market-cap ranking among negative-return tokens was approximately No. 274, placing them slightly lower overall than positive-return assets.
-
Approximately 43 tokens recorded declines between roughly −10% and −40%, with the 201–300 and 401–500 segments containing slightly higher concentrations of decliners.
-
Approximately eight tokens posted declines greater than −30%, including RIVER (approximately −60%, rank around 268), QUBIC (approximately −42%), WLFI (approximately −36%, rank around 44 and one of the few deeply declining top-100 assets), BUILDon, LION, NIGHT, XVG, and KOGE.
2.3 Top 100 Market-Cap Leaderboard
On the gaining side, BCAP and SKYAI were heavily traded under RWA/equity-mapping and AI Agent narratives. LUNC, PENGU, and M benefited from strong community and Meme characteristics, making them highly beta-sensitive and prone to short squeezes and momentum continuation during periods of rising risk appetite.
On the declining side, WLFI and TRUMP remained deeply tied to political celebrity IP narratives and experienced sharper post-crowded-trade unwinding. TAO and WLD reflected capital rotation and regulatory uncertainty within AI and biometric sectors. Ecosystem-driven tokens such as MNT tended to face pressure relative to BTC and ETH due to lacking independent incremental growth narratives.
Overall, this suggests that in April, capital became more willing to “rotate between baskets” rather than remain concentrated in a single sector. Even within AI-related tokens, divergence and turnover increased, while the correction of crowded trades continued unfolding.

3. Analysis of Volume Expansion During This Market Cycle
3.1 Trading Volume Growth Analysis
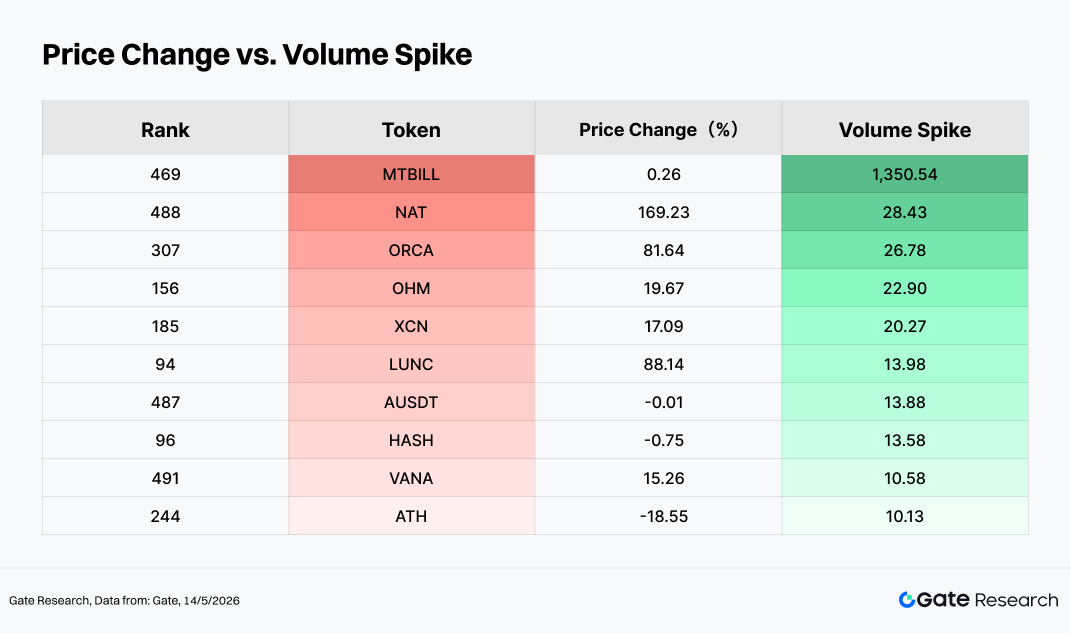
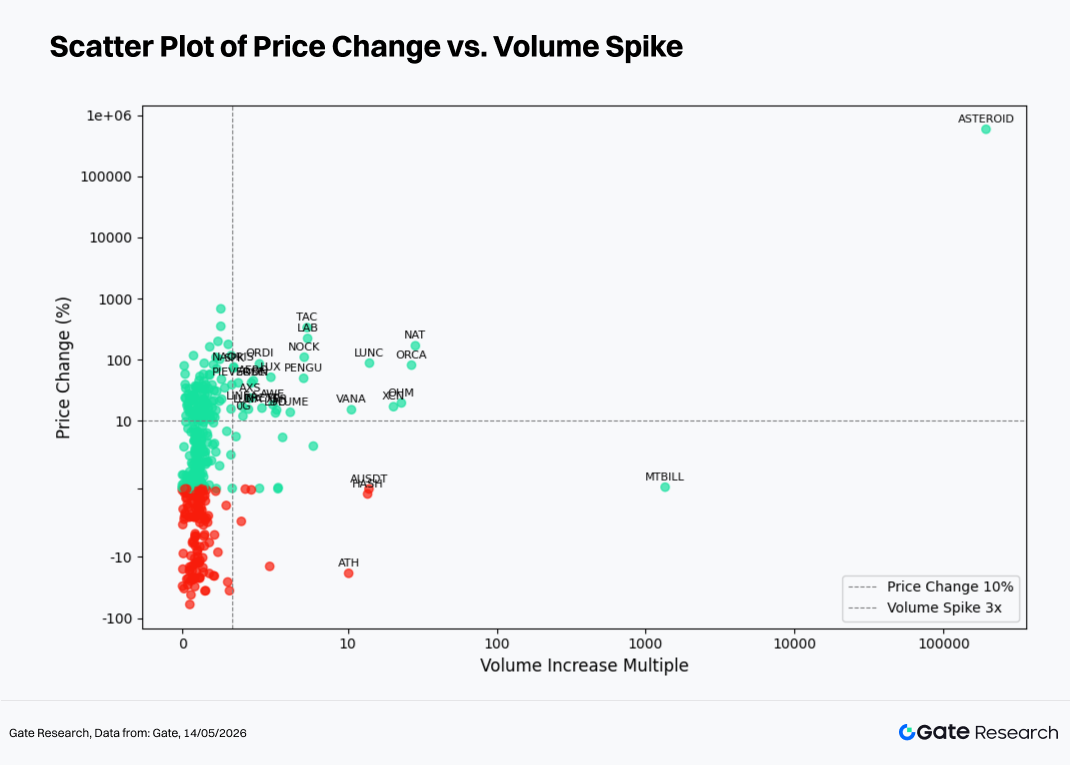
Using April’s average daily trading volume as the baseline and comparing it with single-day trading volume near month-end, it is possible to calculate the Volume Spike multiple. The higher this metric, the more significantly an asset experienced explosive volume expansion relative to the “quiet period” at the beginning of the month, reflecting a rapid increase in capital activity and market attention.
Within this analytical framework, when strong price performance coincides with a high trading-volume growth multiple (such as NAT, ORCA, LUNC, LAB, TAC, NOCK, and PENGU), it is generally considered a classic “price-and-volume rising together” structure. In other words, turnover rates increase significantly toward month-end while the asset still maintains positive returns for the full month. This type of market behavior is often associated with recovering risk appetite and active capital inflows driven by thematic catalysts or event-based narratives.
By contrast, when high trading-volume growth multiples correspond with negative price performance (such as ATH and similar cases), the pattern more closely resembles a “high-volume correction.” In these situations, trading activity increases substantially, but asset prices still trend downward over the monthly timeframe. Such conditions typically emerge during phases of profit-taking after crowded trades, negative-news realization, or cascading stop-loss liquidations, reflecting intensified market disagreement and repricing of positions under high-turnover conditions.
Overall, the expansion in market trading volume during April was not driven unilaterally in one direction, but rather represented a simultaneous amplification of both bullish and bearish divergence. Some assets achieved volume-driven rallies under the support of incremental capital inflows, while others underwent risk release and price revaluation amid elevated turnover activity.
Building upon observations of abnormal trading-volume activity, this section further combines price performance data to construct a scatter plot comparing trading-volume growth multiples and price returns.
The horizontal axis represents the increase in trading volume over the past two weeks relative to the baseline period, while the vertical axis represents percentage price changes over the same timeframe. A symmetric logarithmic scale is applied to more clearly visualize the structural relationship between “volume expansion” and “price movement.”
In April, most data points remained concentrated within low-to-medium trading-volume growth ranges, while the vertical axis clustered mainly around the 0% return area. This indicates that across the full sample, “moderate turnover combined with relatively limited monthly price movement” remained the dominant market condition.
As trading-volume growth multiples expanded toward the right side of the chart, certain data points began diverging significantly. Most of these fell within positive-return territory, reflecting resonance between breakout rallies and thematic catalysts. Others entered negative-return territory, corresponding to high-volume corrections or the release of distribution pressure during profit-taking phases.
Key Cases
- ENJ: Trading volume expanded by approximately 6.8x compared with March, while price rose around 178%, making it a textbook example of a “price-and-volume breakout.” Its rally was closely linked to catalysts within gaming and NFT-related ecosystems. However, after the rapid concentration of short-term speculative capital, it is also necessary to monitor the growing risk of pullbacks caused by increasingly crowded positioning.
- SKYAI: Trading volume expanded by approximately 4.3x, while price surged roughly 352%, demonstrating a highly narrative-driven volume resonance pattern strongly influenced by market sentiment.
- LUNC: Trading volume increased approximately 1.9x while price gained around 88%. This represents a classic example of an older narrative recovering under moderate volume expansion, reflecting periodic capital rotation back into legacy market themes.
- ONT: Trading volume increased by around 1.5x, yet price declined approximately 16%. The combination of rising turnover and weakening price action suggests intensifying disagreement between bulls and bears, where increased trading activity failed to translate into price support.
- NIGHT: Trading volume contracted significantly while price also declined, reflecting a low-volume correction pattern more consistent with falling participation and fading narrative momentum.
- BTC / ETH: Total monthly trading volume for BTC and ETH amounted to approximately 0.91x and 0.81x of the previous month, respectively. This “price-up, volume-down” pattern suggests that the rebound was driven more by recovering risk appetite among existing capital and sector rotation rather than by broad-based incremental inflows. A fully market-wide trend expansion supported by new capital has not yet emerged.
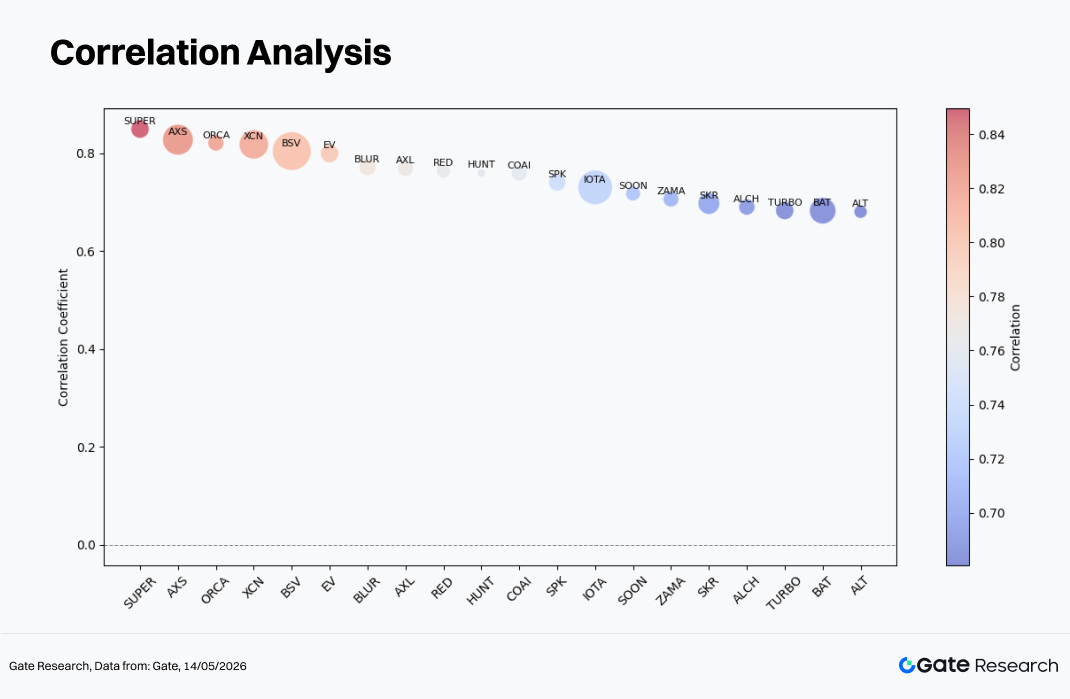
3.3 Correlation Analysis
After examining the relationship between trading volume and price performance, this section further analyzes the systematic statistical correlation between the two variables.
To measure the impact of capital activity on price volatility, the study uses “trading-volume growth rate / market capitalization” as a relative activity metric and calculates its correlation coefficient with price performance. This helps identify which types of tokens are currently most sensitive to capital-driven movements.
Among approximately 452 analyzable samples, the median correlation coefficient was around 0.20, while the 75th percentile was approximately 0.38. Only around 22 tokens recorded values above 0.65, indicating that for most assets, the day-to-day relationship between trading volume and price remained only mildly positively correlated or close to statistical noise.
Tokens such as SUPER (approximately 0.85), AXS (approximately 0.83), ORCA (approximately 0.82), XCN (approximately 0.82), and BSV (approximately 0.80) ranked near the 0.80 level, reflecting highly synchronized relationships between turnover intensity and price direction under event-driven or trend-driven market conditions.
Mid-tier assets including IOTA, SOON, and ZAMA (approximately 0.71–0.73), along with SKR, ALCH, TURBO, and BAT (approximately 0.68–0.70), fell within the 0.67–0.74 range, indicating meaningful price-volume resonance, although weaker than that observed among the highest-ranking assets.
4. Conclusion
After the weak and volatile conditions experienced in March, major pricing anchors completed a technical path of “bottoming out → reclaiming higher levels” during April, establishing the foundation of risk appetite necessary for altcoin and thematic sector rotation.
At the same time, the ETH/BTC ratio did not strengthen excessively, suggesting that capital remained divided between “beta recovery” trades and “structural thematic opportunities,” rather than aggressively concentrating into a single dominant narrative.
From a market-cap segmentation perspective, the 101–200 ranking range delivered the strongest performance and became the core elasticity zone during this phase of recovering risk appetite. Meanwhile, high-beta mid-to-lower-cap assets such as TAC (+335%), LAB (+223%), and LUNC (+88%) reflected the continued spread of capital into thematic and high-volatility sectors after BTC stabilized.
Among the top gainers, Binance Life (approximately +680%), BCAP (approximately +360%), and SKYAI (approximately +352%) delivered especially strong performances, largely driven by AI, Meme, community narratives, and high-turnover speculative flows. On the other hand, RIVER (approximately −60%), QUBIC (approximately −42%), and WLFI (approximately −36%) experienced significant pullbacks, reflecting post-crowded-trade profit-taking and valuation compression.
From the perspective of trading volume, ENJ (approximately 6.8x volume expansion), SKYAI (approximately 4.3x), ORCA, and PENGU displayed classic “price-and-volume rising together” characteristics, while ATH and ONT experienced high-volume declines, demonstrating that internal market divergence between bullish and bearish forces continues widening.
Overall, April’s market was not characterized by indiscriminate broad-based gains. Instead, it represented a combination of “broad benchmark recovery + structural rotation,” with market capital gradually transitioning from defensive positioning toward a more aggressive, higher-risk appetite environment.
Reference:
- CoinGecko, https://www.coingecko.com/
- Gate, https://www.gate.com/trade/BTC_USDT
Gate Research is a comprehensive blockchain and cryptocurrency research platform that provides deep content for readers, including technical analysis, market insights, industry research, trend forecasting, and macroeconomic policy analysis.
Disclaimer
Investing in cryptocurrency markets involves high risk. Users are advised to conduct their own research and fully understand the nature of the assets and products before making any investment decisions. Gate is not responsible for any losses or damages arising from such decisions.