This comprehensive analysis examines RWAX (APP) token pricing from 2026-2031, providing professional forecasts for Injective-focused launchpad users. APP currently trades at $0.0001324 with a market cap of $262,939, experiencing extreme market fear with potential for contrarian opportunities. The article combines historical price evolution, market sentiment analysis, and supply-demand dynamics to project conservative, neutral, and optimistic scenarios, with predicted growth ranging from 8% to 79% through 2031. Key sections cover macroeconomic factors affecting cryptocurrency markets, institutional dynamics, and APP's position in DeFi trading infrastructure. Risk management strategies include asset allocation guidelines (1-10% portfolio allocation), storage solutions via Gate Web3 Wallet, and detailed position-sizing recommendations for conservative through professional investors. The analysis acknowledges significant risks including 96.05% yearly decline, limited liquidity ($15,424 daily volume), and regulato
Introduction: APP's Market Position and Investment Value
RWAX (APP), as a specialized Injective-focused launchpad superapp integrating advanced on-chain trading tools, has been developing since its launch in January 2024. As of February 2026, RWAX maintains a market capitalization of approximately $262,939, with a circulating supply of around 1.99 billion tokens, and the price stabilizing near $0.0001324. This asset, positioned as a comprehensive on-chain trading solution offering features like limit orders, presale sniping, liquidity sniping, and sandwich bot capabilities, is playing an increasingly specialized role in the decentralized trading ecosystem.
This article will comprehensively analyze RWAX's price trends from 2026 to 2031, combining historical patterns, market supply and demand dynamics, ecosystem development, and macroeconomic environments to provide investors with professional price forecasts and practical investment strategies.
I. APP Price History Review and Market Status
APP Historical Price Evolution Trajectory
- 2024: APP launched on Gate.com in January with an initial price of $0.0067, reaching a peak of $0.051 on January 16, marking a significant milestone in its early trading phase
- 2024-2025: The token experienced substantial volatility throughout the period, with price fluctuations influenced by broader market cycles and platform developments
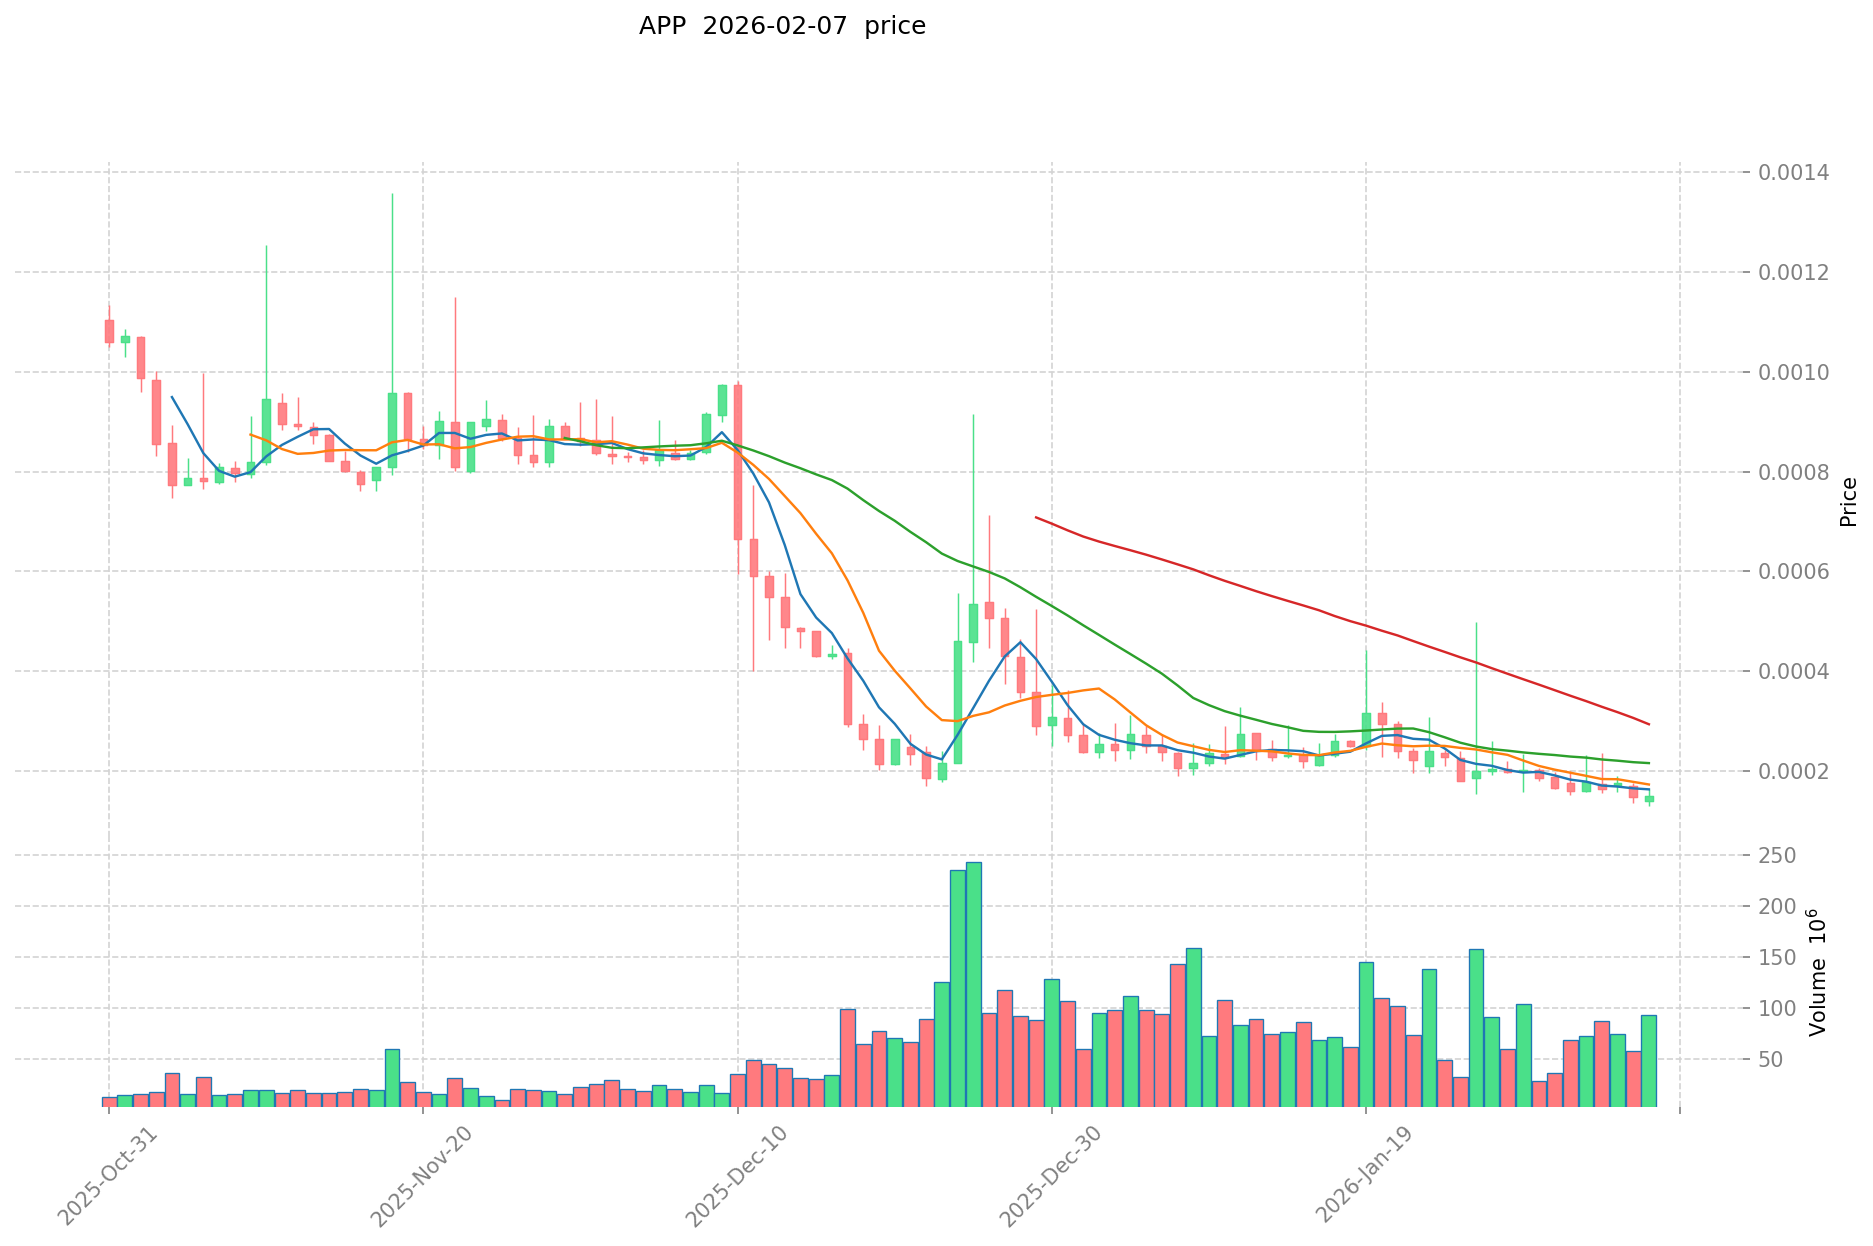
- 2026: Continuing downward pressure led to a new low of $0.0001228 recorded on February 7, reflecting challenging market conditions
APP Current Market Situation
As of February 7, 2026, APP is trading at $0.0001324, representing a 1.27% increase over the past 24 hours. The token has demonstrated mixed short-term performance, with a decline of 5.85% in the past hour, while maintaining modest positive momentum in the daily timeframe.
The 24-hour trading range shows APP fluctuating between $0.0001228 and $0.000163, with a total trading volume of approximately $15,424. The market capitalization stands at around $262,939, with a circulating supply of approximately 1.99 billion tokens out of a maximum supply of 3 billion tokens, resulting in a circulation ratio of 66.2%.
Looking at broader timeframes, APP has experienced significant declines, with a 26.76% decrease over the past 7 days, a 34.75% drop over 30 days, and a substantial 96.05% decline over the past year. The token currently holds approximately 1,860 holders and maintains a market dominance of 0.000016%.
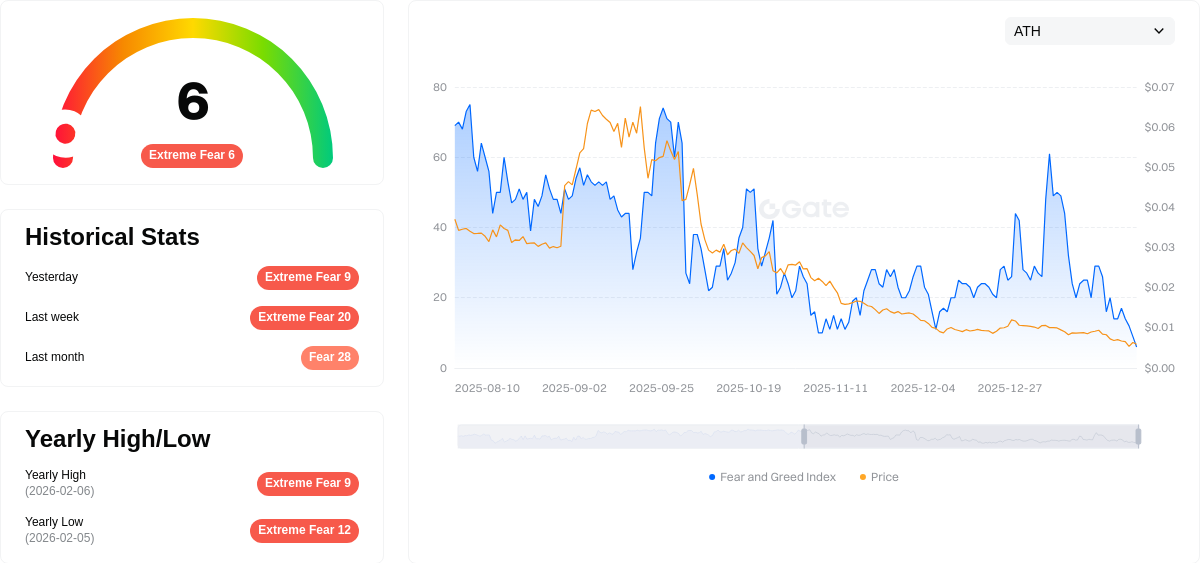
The Gate.com Fear & Greed Index for February 7, 2026, registers at 6, indicating "Extreme Fear" sentiment in the cryptocurrency market, which may be influencing APP's current price action and overall market performance.
Click to view current APP market price
APP Market Sentiment Indicator
2026-02-07 Fear and Greed Index: 6 (Extreme Fear)
Click to view the current Fear & Greed Index
The cryptocurrency market is currently experiencing extreme fear, with the Fear and Greed Index dropping to 6. This indicates investors are highly pessimistic about market conditions, with widespread selling pressure and risk aversion dominating sentiment. Such extreme fear levels historically present contrarian buying opportunities for long-term investors, as markets tend to recover from oversold conditions. However, caution is warranted as downward momentum may persist. Monitor key support levels and consider dollar-cost averaging strategies during this period of capitulation.
APP Holdings Distribution
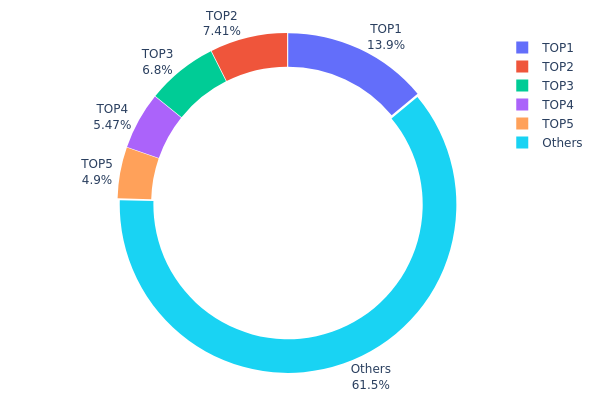
The holdings distribution chart illustrates the allocation of APP tokens across different wallet addresses, providing insight into the degree of centralization within the token's ownership structure. Based on the current data, the top five addresses collectively hold approximately 38.5% of the total supply, with the largest single address controlling 13.94% (418.46M tokens), followed by the second-largest at 7.41% (222.31M tokens). The remaining 61.5% is distributed among other holders, indicating a moderate level of concentration in the token's ownership landscape.
This distribution pattern suggests a semi-centralized structure where a handful of large holders possess significant influence over market dynamics. While the top address's 13.94% holding is substantial, it falls below the critical 20% threshold often associated with excessive centralization risk. However, the cumulative 38.5% held by the top five addresses represents a considerable concentration that could impact price stability during periods of market volatility. Large holders have the capacity to influence liquidity and potentially create downward pressure through coordinated selling activities, though the 61.5% distribution among smaller holders provides some degree of decentralization buffer.
The current holdings structure reflects a market still in its developing phase, where early investors or project-related entities maintain meaningful positions alongside a growing base of retail participants. This balance suggests moderate on-chain structural stability, though investors should remain cognizant of concentration risks. The distribution demonstrates neither extreme centralization that would indicate high manipulation risk, nor the widespread diffusion characteristic of mature, highly decentralized networks.
Click to view current APP Holdings Distribution
| Top |
Address |
Holding Qty |
Holding (%) |
| 1 |
0x4a12...00a795 |
418461.96K |
13.94% |
| 2 |
0x0529...c553b7 |
222312.97K |
7.41% |
| 3 |
0x0d07...b492fe |
203989.36K |
6.79% |
| 4 |
0x74de...a2f9a1 |
164168.05K |
5.47% |
| 5 |
0x58ed...a36a51 |
146900.76K |
4.89% |
| - |
Others |
1844166.90K |
61.5% |
II. Core Factors Influencing APP's Future Price
Supply Mechanism
Based on available materials, specific supply mechanism details for APP are not provided in the reference sources. The materials primarily discuss broader market factors affecting cryptocurrency and commodity prices, including gold and silver markets, rather than APP-specific tokenomics.
Institutional and Major Holder Dynamics
The reference materials do not contain specific information about institutional holdings, corporate adoption, or national policies directly related to APP. The available data focuses on traditional financial markets, precious metals, and general cryptocurrency market trends rather than APP-specific institutional dynamics.
Macroeconomic Environment
-
Monetary Policy Impact: According to CME's FedWatch Tool data, traders currently estimate approximately 90% probability of Federal Reserve rate cuts in October and about 65% probability of further cuts in December. Market sentiment remains optimistic regarding potential continued Fed rate cuts throughout the year, which typically supports risk assets including cryptocurrencies.
-
Inflation Hedge Attributes: Recent U.S. Commerce Department data shows the Fed's preferred inflation indicator, core PCE, rose 0.2% month-over-month and remained stable at 2.9% year-over-year, meeting expectations. This moderate inflation environment may influence investor appetite for alternative assets.
-
Geopolitical Factors: Current geopolitical tensions include potential U.S. government shutdowns, heightened Iran-Israel tensions with potential military action expected within months, and ongoing Russia-Ukraine territorial disputes. These uncertainties may drive investors toward safe-haven assets and increase market volatility across all asset classes.
Technology Development and Ecosystem Building
The reference materials do not provide specific information about APP's technical upgrades, network improvements, or ecosystem applications. Available data focuses on broader technology trends in AI applications, semiconductor development, and general blockchain industry events rather than APP-specific technological developments or DApp ecosystems.
III. 2026-2031 APP Price Prediction
2026 Outlook
- Conservative prediction: $0.00009 - $0.00014
- Neutral prediction: $0.00014 average trading level
- Optimistic prediction: $0.00019 (requires favorable market sentiment and increased trading volume)
2027-2029 Outlook
- Market stage expectation: Gradual accumulation phase with potential for moderate upward momentum
- Price range predictions:
- 2027: $0.00012 - $0.00018, with 26% potential growth
- 2028: $0.00010 - $0.00021, showing 30% potential increase
- 2029: $0.00011 - $0.00024, indicating 46% possible appreciation
- Key catalysts: Market adoption trends, ecosystem development, and broader cryptocurrency market conditions
2030-2031 Long-term Outlook
- Baseline scenario: $0.00015 - $0.00026 (assuming stable market conditions and sustained project development)
- Optimistic scenario: $0.00022 - $0.00027 (with enhanced utility and wider adoption)
- Transformative scenario: Potential to reach upper ranges if significant partnerships or technological breakthroughs materialize
- 2026-02-07: APP currently positioned in early growth phase with projected 8% initial movement potential
| Year |
Predicted High Price |
Predicted Average Price |
Predicted Low Price |
Price Change |
| 2026 |
0.00019 |
0.00014 |
0.00009 |
8 |
| 2027 |
0.00018 |
0.00017 |
0.00012 |
26 |
| 2028 |
0.00021 |
0.00017 |
0.0001 |
30 |
| 2029 |
0.00024 |
0.00019 |
0.00011 |
46 |
| 2030 |
0.00026 |
0.00022 |
0.00015 |
64 |
| 2031 |
0.00027 |
0.00024 |
0.00013 |
79 |
IV. APP Professional Investment Strategies and Risk Management
APP Investment Methodology
(I) Long-term Holding Strategy
- Suitable for: Investors focused on DeFi infrastructure and trading bot innovation
- Operational Recommendations:
- Consider accumulation during market downturns when price approaches support levels
- Monitor Moon App platform development progress and user adoption metrics
- Recommended storage: Gate Web3 Wallet for secure multi-chain asset management
(II) Active Trading Strategy
- Technical Analysis Tools:
- Volume Analysis: Track 24-hour trading volume fluctuations to identify potential breakout patterns
- Support/Resistance Levels: Current price around $0.0001324 with 24H high at $0.000163 and low at $0.0001228
- Swing Trading Considerations:
- Monitor short-term volatility given -5.85% 1H and +1.27% 24H price movements
- Set appropriate stop-loss orders to manage downside risk in volatile conditions
APP Risk Management Framework
(I) Asset Allocation Principles
- Conservative Investors: 1-3% portfolio allocation
- Aggressive Investors: 5-8% portfolio allocation
- Professional Investors: Up to 10% with active management
(II) Risk Hedging Solutions
- Portfolio Diversification: Combine APP holdings with established cryptocurrencies to balance risk
- Position Sizing: Limit exposure based on market capitalization and liquidity constraints
(III) Secure Storage Solutions
- Web3 Wallet Recommendation: Gate Web3 Wallet supporting ETH and BSC networks
- Multi-signature Option: Consider enhanced security for larger holdings
- Security Precautions: Never share private keys, enable two-factor authentication, and verify contract addresses (ETH: 0xC5d27F27F08D1FD1E3EbBAa50b3442e6c0D50439)
V. APP Potential Risks and Challenges
APP Market Risks
- High Volatility: Price experienced -96.05% decline over one year, indicating substantial market risk
- Limited Liquidity: Daily trading volume of approximately $15,424 may result in execution challenges
- Market Cap Concerns: Current market capitalization around $262,939 reflects micro-cap status with elevated risk
APP Regulatory Risks
- Trading Bot Regulations: Automated trading tools face evolving regulatory scrutiny across jurisdictions
- Compliance Requirements: DeFi platforms may encounter increased regulatory oversight affecting operations
- Cross-border Restrictions: International regulatory differences could impact platform accessibility
APP Technical Risks
- Smart Contract Vulnerabilities: On-chain trading bots require thorough security audits to prevent exploits
- Integration Dependencies: Platform functionality relies on Injective network performance and stability
- Competition Pressure: Emerging trading bot platforms may impact Moon App's market position
VI. Conclusion and Action Recommendations
APP Investment Value Assessment
APP represents a specialized investment in DeFi trading infrastructure focused on Injective ecosystem. While the platform offers innovative on-chain trading bot functionality, investors should carefully weigh the significant price volatility demonstrated by the -96.05% yearly decline and current micro-cap market position. The token's utility within the Moon App ecosystem provides fundamental value proposition, though market adoption remains a critical factor. Short-term risks include limited liquidity and ongoing price pressure, while long-term potential depends on platform development execution and user base growth.
APP Investment Recommendations
✅ Beginners: Avoid or allocate minimal portfolio percentage until demonstrating stronger market stability and liquidity
✅ Experienced Investors: Consider small speculative position with strict risk management and stop-loss parameters
✅ Institutional Investors: Conduct thorough due diligence on platform technology and team before considering allocation
APP Trading Participation Methods
- Spot Trading: Available on Gate.com with trading pairs for immediate buy/sell execution
- Technical Analysis Approach: Utilize charting tools to identify potential entry points during consolidation phases
- Dollar-Cost Averaging: Spread purchases over time to mitigate entry timing risk in volatile conditions
Cryptocurrency investment carries extremely high risk. This article does not constitute investment advice. Investors should make prudent decisions based on their own risk tolerance and are advised to consult professional financial advisors. Never invest more than you can afford to lose.
FAQ
What is APP price prediction? How does it work?
APP price prediction leverages advanced AI algorithms to forecast cryptocurrency price movements by analyzing market trends, trading volume, historical data, and on-chain metrics. The system identifies patterns and calculates probability-weighted predictions to help users anticipate price directions.
Which machine learning algorithms can be used for APP price prediction?
Common machine learning algorithms include linear regression, time series analysis, random forests, and neural networks for APP price prediction. These leverage historical price data and market indicators to forecast future price trends.
How is the accuracy of APP price predictions evaluated?
APP price prediction accuracy is evaluated through key metrics including overall accuracy rate, precision, recall, and F1 score on test datasets. A high-performing model typically achieves accuracy scores around 0.87, ensuring reliable prediction quality and model dependability.
You can use platforms like App Annie and Sensor Tower for APP price prediction. These tools analyze market trends, pricing data, trading volume, and competitive analysis to help forecast price movements and market dynamics.
What is the accuracy rate of APP price prediction in practical applications?
APP price prediction accuracy typically ranges from 70% to 90%, depending on model quality and data sources. Actual accuracy varies based on market conditions and prediction timeframes. Performance metrics like precision and recall also influence overall prediction effectiveness.
How to collect and process data for APP price prediction?
Gather historical price data, trading volume, and market indicators. Preprocess by normalizing values and handling missing data. Use machine learning models like LSTM to analyze patterns and train prediction algorithms for accurate forecasting.
What is the difference between APP price prediction and price prediction for other commodities?
APP price predictions focus on user adoption, network effects, and technological innovation, while traditional commodity prices depend on supply, demand, and production costs. Crypto APP tokens are driven by community sentiment and market liquidity rather than physical asset scarcity.
APP developers can use price prediction to quantify customer value and set pricing at approximately 20% of that value. This approach maintains competitiveness while attracting users and ensuring sustainable monetization based on predicted market demand.
What are the main factors affecting APP price?
APP price is primarily influenced by market demand, trading volume, adoption rate, ecosystem development, regulatory changes, and competitive landscape. Token utility, project fundamentals, and macroeconomic conditions also play significant roles in price movement.
What is the future development trend of APP price prediction?
APP price prediction market is expected to grow significantly, with estimated annual growth of approximately 10.25%. By 2028, APP pricing is projected to rise substantially, driven by increasing market adoption and investor demand in the Web3 ecosystem.
* The information is not intended to be and does not constitute financial advice or any other recommendation of any sort offered or endorsed by Gate.