This comprehensive analysis examines CREDI's price dynamics and investment potential through 2031, providing professional forecasts for this real-world asset-backed lending token. Trading at $0.00132 with a $988,117 market cap, CREDI bridges crypto lenders and EU SME borrowers through innovative RWA collateral mechanisms. The article evaluates historical performance, market sentiment, and tokenomics to project potential price ranges: $0.00123-$0.00181 in 2026, advancing to $0.00245-$0.00284 by 2030-2031 under favorable conditions. Key sections detail supply mechanics, institutional dynamics, macroeconomic influences, and ecosystem development as primary price drivers. Investors discover tailored strategies—from long-term holding to active trading—alongside robust risk management frameworks addressing volatility, liquidity constraints, and regulatory challenges. Whether you're a beginner exploring RWA opportunities or an experienced trader on Gate, this guide offers data-driven insights for informed CREDI inve
Introduction: CREDI's Market Position and Investment Value
Credefi (CREDI), positioned as an alternative lending FinTech solution bridging crypto lenders and SME borrowers from the real economy, has been developing its unique value proposition since its launch in 2021. As of 2026, CREDI maintains a market capitalization of approximately $988,117, with a circulating supply of around 748.57 million tokens, and the price hovering around $0.00132. This asset, characterized as a "real-world asset-backed lending platform," is playing an increasingly important role in connecting Traditional Finance (TradFi) and Decentralized Finance (DeFi).
This article will comprehensively analyze CREDI's price trends from 2026 to 2031, combining historical patterns, market supply and demand dynamics, ecosystem development, and macroeconomic environment factors to provide investors with professional price forecasts and practical investment strategies.
I. CREDI Price History Review and Market Status
CREDI Historical Price Evolution Trajectory
- 2021: Token launched in December with an initial offering price of $0.014, establishing its market presence in the alternative lending sector
- 2024: Market reached a notable price level of $0.03456 in May, reflecting increased interest in RWA-backed lending solutions
- 2026: Price experienced a downward adjustment to $0.001255 in early February, representing a market correction phase
CREDI Current Market Situation
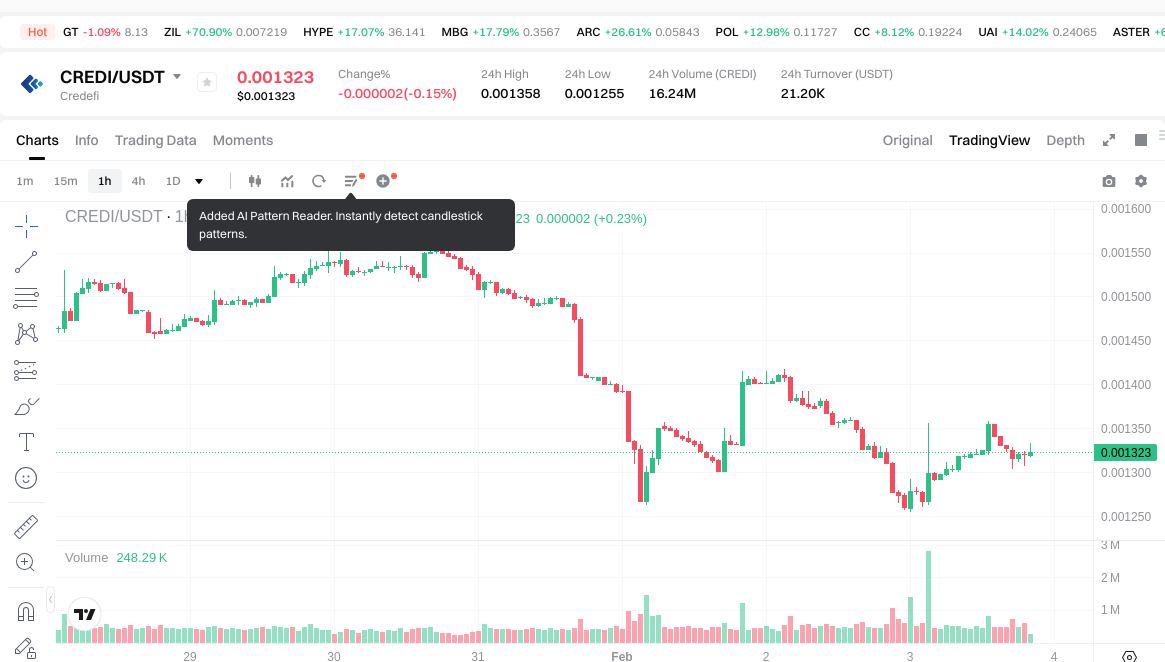
As of February 3, 2026, CREDI is trading at $0.00132, with a 24-hour trading volume of $21,193.61. The token has shown a modest hourly gain of 0.3%, while experiencing a slight 24-hour decline of 0.22%. Over the past week, the price has decreased by 9.82%, and the 30-day performance shows a 28.83% reduction.
The current market capitalization stands at approximately $988,117.52, with a circulating supply of 748,573,880 CREDI tokens, representing 74.86% of the total supply of 939,978,336 tokens. The fully diluted market cap is calculated at $1,240,771.40, with a maximum supply cap set at 1 billion tokens.
The token holder base consists of 3,647 addresses, indicating a relatively distributed ownership structure. CREDI maintains trading availability on 3 exchanges, with Gate.com being one of the primary platforms. The 24-hour price range has fluctuated between $0.001255 and $0.001358.
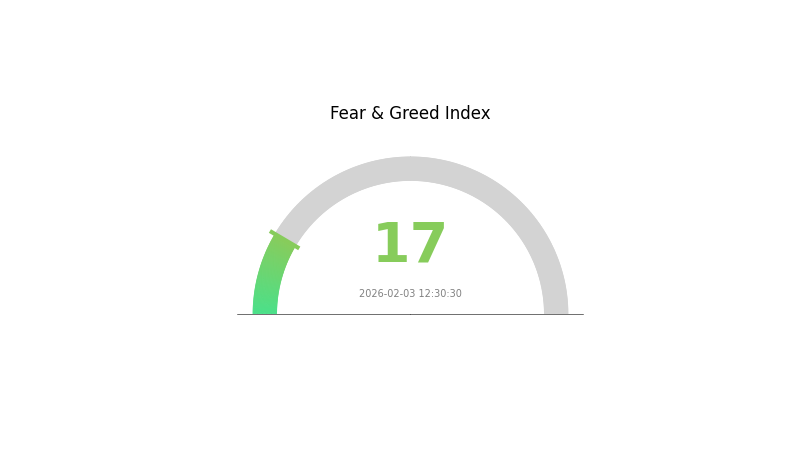
The current market sentiment index registers at 17, indicating an extreme fear sentiment in the broader cryptocurrency market, which may be influencing CREDI's short-term price movements.
Click to view current CREDI market price
CREDI Market Sentiment Indicator
02-03-2026 Fear & Greed Index: 17 (Extreme Fear)
Click to view the current Fear & Greed Index
The cryptocurrency market is experiencing extreme fear, with the Fear & Greed Index at 17. This indicates severe market pessimism and heightened investor anxiety. Such extreme fear conditions often present contrarian opportunities, as panic selling may create favorable entry points for long-term investors. However, caution is advised, as markets may continue declining before stabilizing. Monitor key support levels and consider dollar-cost averaging strategies to mitigate volatility risks during this period of market distress.
CREDI Holdings Distribution
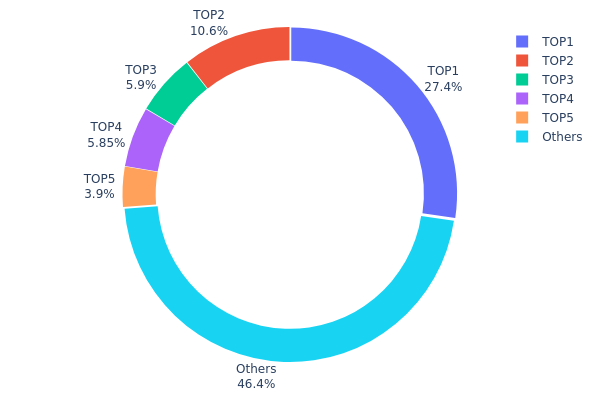
The holdings distribution chart reveals the proportion of total supply controlled by different wallet addresses, serving as a critical indicator of token decentralization. According to the latest on-chain data, CREDI exhibits a moderately concentrated distribution pattern. The top-ranked address holds 257,322.50K tokens, representing 27.37% of the total supply, while the second and third addresses account for 10.55% and 5.90% respectively. The top five addresses collectively control 53.56% of the circulating supply, with the remaining 46.44% distributed among other holders.
This distribution structure demonstrates typical characteristics of emerging crypto assets. While the leading address's 27.37% holding indicates certain concentration risk, it remains within reasonable bounds compared to projects with extreme centralization where single entities control over 50% of supply. The gradual decline in holdings from first to fifth position (27.37% → 10.55% → 5.90% → 5.85% → 3.89%) suggests a relatively balanced power structure among major stakeholders. However, with over half the supply concentrated in five addresses, CREDI remains vulnerable to coordinated selling pressure or potential market manipulation by large holders.
From a market structure perspective, this distribution pattern implies moderate price volatility sensitivity. The 46.44% held by smaller addresses provides necessary market liquidity and retail participation, contributing to organic price discovery. Nevertheless, any significant movement from top holders could trigger substantial price fluctuations. The current distribution reflects an evolving on-chain ecosystem where CREDI is transitioning from initial distribution phase toward broader community ownership, though achieving optimal decentralization requires continued effort in token dispersion across a wider holder base.
Click to view current CREDI Holdings Distribution
| Top |
Address |
Holding Qty |
Holding (%) |
| 1 |
0x2677...ccb975 |
257322.50K |
27.37% |
| 2 |
0xadb0...859326 |
99209.01K |
10.55% |
| 3 |
0x7b8f...16ea19 |
55497.83K |
5.90% |
| 4 |
0x4396...5fdb78 |
55000.00K |
5.85% |
| 5 |
0x58ed...a36a51 |
36616.04K |
3.89% |
| - |
Others |
436332.96K |
46.44% |
II. Core Factors Influencing CREDI's Future Price
Supply Mechanism
- Tokenomics Structure: CREDI operates within a defined supply framework that influences its market dynamics. The token serves as collateral within DeFi protocols, requiring holders to maintain specific collateral ratios to avoid liquidation.
- Historical Patterns: Supply adjustments in DeFi infrastructure tokens have historically correlated with liquidity conditions in the broader cryptocurrency market.
- Current Impact: As a DeFi infrastructure token, CREDI's supply mechanism continues to respond to changes in staking demand and protocol utilization rates.
Institutional and Major Holder Dynamics
- Institutional Positioning: Market participants monitor positioning changes among major holders as these movements can signal confidence levels in the protocol's long-term viability.
- Protocol Competition: CREDI faces competition from established DeFi protocols, which creates a dynamic environment where relative positioning affects valuation.
Macroeconomic Environment
- Monetary Policy Influence: As a DeFi infrastructure token, CREDI demonstrates sensitivity to Federal Reserve liquidity policy shifts. The cryptocurrency market broadly responds to monetary policy changes, with spillover effects from traditional financial markets.
- Inflation Hedge Characteristics: Digital assets within the DeFi ecosystem exhibit varying degrees of correlation with inflation dynamics, influenced by investor risk appetite and broader market conditions.
- Geopolitical Factors: The evolving geopolitical landscape contributes to market volatility, with capital flows responding to regional policy developments and regulatory frameworks.
Technology Development and Ecosystem Building
- DeFi Protocol Integration: The expansion of DeFi infrastructure creates opportunities for increased token utility across multiple protocols and applications.
- Ecosystem Applications: The development of decentralized applications and related ecosystem projects influences demand dynamics for infrastructure tokens like CREDI.
- Market Demand and Technical Innovation: Ongoing technical development within the DeFi sector affects competitive positioning and adoption rates across different protocols.
III. 2026-2031 CREDI Price Forecast
2026 Outlook
- Conservative forecast: $0.00123 - $0.00132
- Neutral forecast: around $0.00132
- Optimistic forecast: up to $0.00181 (subject to favorable market conditions and increased adoption)
2027-2029 Outlook
- Market stage expectation: The token may enter a gradual growth phase, with potential price appreciation driven by ecosystem development and broader crypto market trends.
- Price range forecast:
- 2027: $0.00096 - $0.0021 (projected increase of approximately 18%)
- 2028: $0.00125 - $0.00198 (projected increase of approximately 39%)
- 2029: $0.00174 - $0.00223 (projected increase of approximately 44%)
- Key catalysts: Market sentiment improvements, potential technical upgrades, and expanding user base could serve as primary drivers for price momentum.
2030-2031 Long-term Outlook
- Baseline scenario: $0.0017 - $0.00207 in 2030 (assuming steady market development and maintained project fundamentals)
- Optimistic scenario: $0.00245 - $0.00284 in 2030-2031 (conditional on significant ecosystem growth and favorable regulatory environment)
- Transformative scenario: up to $0.00287 by 2031 (requires exceptional market conditions, widespread adoption, and sustained bullish crypto market cycle with projected cumulative increase of 85%)
- February 3, 2026: CREDI trading within the range of $0.00123 - $0.00181 (initial forecast period baseline)
| Year |
Predicted High Price |
Predicted Average Price |
Predicted Low Price |
Price Change |
| 2026 |
0.00181 |
0.00132 |
0.00123 |
0 |
| 2027 |
0.0021 |
0.00157 |
0.00096 |
18 |
| 2028 |
0.00198 |
0.00184 |
0.00125 |
39 |
| 2029 |
0.00223 |
0.00191 |
0.00174 |
44 |
| 2030 |
0.00284 |
0.00207 |
0.0017 |
56 |
| 2031 |
0.00287 |
0.00245 |
0.00177 |
85 |
IV. CREDI Professional Investment Strategies and Risk Management
CREDI Investment Methodology
(1) Long-Term Holding Strategy
- Target Investors: Investors seeking exposure to real-world asset (RWA) backed lending solutions with tolerance for volatility in emerging DeFi-TradFi bridge protocols
- Operational Recommendations:
- Consider accumulation during periods of reduced volatility, given the 24-hour change of -0.22% suggests relative price stability
- Monitor the circulating supply ratio of 74.86% and total supply metrics (748.57M circulating vs. 939.98M total supply) for potential dilution effects
- Storage Solution: Utilize Gate Web3 Wallet for secure ERC20 token storage, ensuring private key management and enabling interaction with Ethereum-based DeFi protocols
(2) Active Trading Strategy
- Technical Analysis Tools:
- Price Movement Tracking: Monitor short-term trends (1H: +0.3%, 24H: -0.22%) against weekly (-9.82%) and monthly (-28.83%) declines to identify potential reversal patterns
- Volume Analysis: Current 24-hour trading volume of $21,193.61 should be evaluated relative to market cap ($988,117.52) for liquidity assessment
- Swing Trading Considerations:
- Identify support levels near the recent low of $0.001255 (02 February 2026) and resistance approaching the 24-hour high of $0.001358
- Monitor the significant gap between current price ($0.00132) and all-time high ($0.03456 on 22 May 2024) for recovery potential evaluation
CREDI Risk Management Framework
(1) Asset Allocation Principles
- Conservative Investors: 1-3% portfolio allocation given the -84.28% annual decline and high volatility characteristics
- Aggressive Investors: 5-8% allocation for those with higher risk tolerance and conviction in the RWA lending thesis
- Professional Investors: Up to 10-15% allocation with active hedging strategies and deep understanding of SME lending markets
(2) Risk Hedging Approaches
- Position Sizing: Limit initial exposure given the substantial distance from historical high and ongoing downtrend
- Diversification Strategy: Balance CREDI exposure with other RWA-focused protocols and traditional DeFi lending platforms to mitigate sector-specific risks
(3) Secure Storage Solutions
- Web3 Wallet Recommendation: Gate Web3 Wallet provides ERC20 token support with enhanced security features for Ethereum-based assets
- Cold Storage Option: For long-term holdings, consider hardware wallet solutions with Ethereum compatibility
- Security Precautions: Verify contract address (0xae6e307c3fe9e922e5674dbd7f830ed49c014c6b) on Etherscan before transactions, never share private keys, and enable multi-factor authentication on exchange accounts
V. CREDI Potential Risks and Challenges
CREDI Market Risks
- Price Volatility: The token has experienced an 84.28% decline over the past year, with monthly declines of 28.83%, indicating sustained bearish momentum and high volatility
- Liquidity Constraints: With only 3 exchange listings and a 24-hour trading volume of approximately $21,193, the market may face liquidity challenges during periods of high selling pressure
- Market Capitalization: At $988,117 market cap with 0.000045% market dominance, CREDI operates in a highly competitive environment with limited market presence
CREDI Regulatory Risks
- RWA Compliance Framework: As a platform connecting crypto lenders with real economy SME borrowers using real-world asset collateral (real estate, receivables), the project operates at the intersection of traditional finance and DeFi, potentially subject to evolving regulatory frameworks in multiple jurisdictions
- Cross-Border Lending Regulations: Facilitating loans to EU SMEs while utilizing crypto liquidity may encounter varying regulatory approaches across member states regarding digital asset lending and securities classification
- Collateral Enforcement: The mechanism for enforcing claims on real-world assets (real estate, future receivables) across different legal jurisdictions may face regulatory and practical challenges
CREDI Technical Risks
- Smart Contract Security: As an ERC20 token operating on Ethereum, the platform depends on smart contract integrity for loan origination, collateral management, and repayment processing
- Oracle Dependencies: Bridging TradFi and DeFi requires reliable price feeds and real-world data oracles to accurately value collateral and trigger liquidation events when necessary
- Platform Concentration: With 3,647 holders and limited exchange availability, the token distribution and ecosystem participation may face concentration risks affecting decentralization and resilience
VI. Conclusion and Action Recommendations
CREDI Investment Value Assessment
CREDI presents an alternative lending solution targeting the financing gap for EU SMEs by connecting crypto liquidity with real economy borrowers through RWA-backed loans. The long-term value proposition centers on addressing the funding needs of approximately one-third of EU SMEs while offering crypto lenders stable returns uncorrelated with crypto market volatility. However, short-term risks include significant price decline (-84.28% annually), limited liquidity (3 exchanges, $21,193 24-hour volume), and challenges inherent in bridging traditional finance with decentralized systems. The substantial gap between current price ($0.00132) and historical high ($0.03456) reflects ongoing market skepticism or broader sector headwinds.
CREDI Investment Recommendations
✅ Beginners: Consider minimal exposure (under 2% of crypto portfolio) only after thorough research into RWA lending mechanics and understanding of the risks associated with cross-border SME financing. Start with small positions to gain familiarity with the platform's operations.
✅ Experienced Investors: May allocate 3-5% for strategic positioning if bullish on the RWA narrative and TradFi-DeFi convergence, while implementing strict stop-loss levels and monitoring the project's loan origination metrics and default rates.
✅ Institutional Investors: Conduct comprehensive due diligence on the platform's legal structure, collateral enforcement mechanisms, and SME borrower quality before considering allocation. Evaluate the competitive landscape of alternative lending protocols and traditional SME financing options.
CREDI Trading Participation Methods
- Spot Trading: Available on Gate.com and 2 other exchanges with limited liquidity; use limit orders to minimize slippage
- Token Acquisition: Purchase CREDI directly with USDT or other trading pairs on supporting exchanges, verifying the correct ERC20 contract address
- Platform Participation: Explore lending opportunities directly through the Credefi platform (credefi.finance) to earn yields from SME loans backed by real-world assets
Cryptocurrency investment carries extremely high risks, and this article does not constitute investment advice. Investors should make prudent decisions based on their own risk tolerance and are advised to consult professional financial advisors. Never invest more than you can afford to lose.
FAQ
What is CREDI token and what are its uses?
CREDI is a token designed for peer-to-peer payments and financial applications. It features low transaction fees, high transaction volume capacity, and supports supply chain finance and other financial use cases.
What are the main factors affecting CREDI price?
CREDI price is primarily influenced by market demand, trading volume, token supply dynamics, project development progress, and broader cryptocurrency market sentiment. Regulatory changes and institutional adoption also significantly impact price movements.
How to predict the future price of CREDI?
Predict CREDI's future price by analyzing trading volume trends, market sentiment, and historical patterns. Expert forecasts suggest significant growth potential by 2030, with prices projected between $0.002222 to $0.002409 based on fundamental analysis.
What are the risks and limitations of CREDI price prediction?
CREDI price predictions assume fixed capital structures and interest rates, which may change in reality. Market volatility, regulatory shifts, and unforeseen events can impact accuracy. Predictions are analytical estimates, not guarantees of future performance.
What are CREDI's advantages compared to other cryptocurrencies?
CREDI connects crypto lenders with SME borrowers through blockchain technology, offering secure and transparent lending services. It leverages real-world asset collateral to reduce risk, distinguishing itself as a specialized DeFi solution rather than a general-purpose cryptocurrency.
What security precautions should I take when investing in CREDI?
When investing in CREDI, use only official websites and avoid suspicious links. Enable two-factor authentication on your wallet. Use strong, unique passwords and store private keys securely offline. Never share seed phrases or personal information. Verify smart contract addresses before transactions.
* The information is not intended to be and does not constitute financial advice or any other recommendation of any sort offered or endorsed by Gate.