This comprehensive guide analyzes Datagram Network (DGRAM), a decentralized data infrastructure protocol supporting DePIN networks, currently trading at $0.0001394 with a market cap of $394,176. The article examines DGRAM's price history from launch through February 2026, revealing extreme volatility with an 98.67% decline from peak levels. It provides expert price predictions through 2031, ranging from conservative to optimistic scenarios, while highlighting critical market factors including supply concentration risks, ecosystem development potential, and macroeconomic influences. The guide offers practical investment strategies tailored for beginners, experienced traders, and institutional investors on Gate.com, emphasizing risk management protocols and secure storage solutions. Comprehensive risk assessments address volatility, liquidity constraints, regulatory uncertainties, and technical challenges. Ideal for investors seeking detailed DGRAM market intelligence and strategic positioning guidance in emerg
Introduction: DGRAM's Market Position and Investment Value
Datagram Network (DGRAM), positioned as a decentralized data infrastructure protocol supporting next-generation DePIN networks, has been operational since 2025. As of February 2026, DGRAM maintains a market capitalization of approximately $394,176, with a circulating supply of around 2.83 billion tokens, and the price remains near $0.0001394. This asset, described as a "unified substrate for tracking uptime and verifying real-world activity on-chain," is playing an increasingly important role in decentralized infrastructure and data verification applications.
This article will comprehensively analyze DGRAM's price trends from 2026 to 2031, incorporating historical patterns, market supply and demand dynamics, ecosystem development, and macroeconomic conditions to provide investors with professional price forecasts and practical investment strategies.
I. DGRAM Price History Review and Market Status
DGRAM Historical Price Evolution Trajectory
- November 2025: Token launched on Gate.com and reached a historical reference point of $0.02 during early trading period, representing the initial market discovery phase
- December 2025 - January 2026: Price experienced significant downward pressure, declining from elevated levels as market dynamics adjusted
- February 2026: Price reached $0.0001077 on February 6th, marking a notable low point in the token's trading history
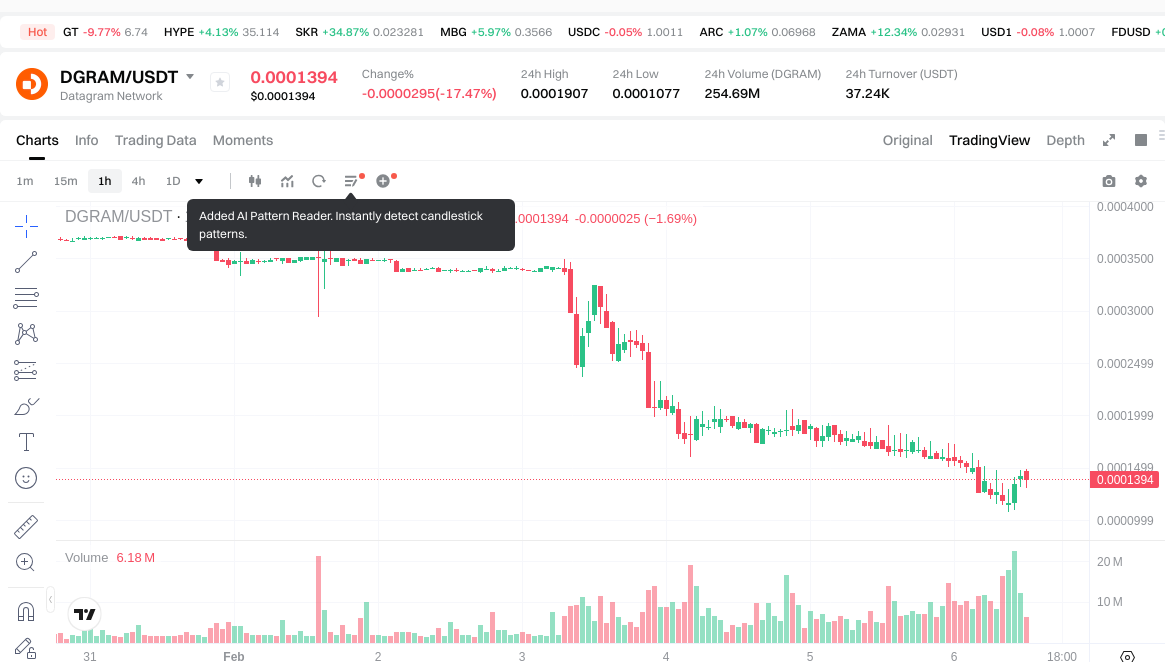
DGRAM Current Market Situation
As of February 6, 2026, DGRAM is trading at $0.0001394, showing a 4.84% increase over the past hour while experiencing an 18.59% decline over the 24-hour period. The token demonstrates substantial volatility with recent price movements ranging between $0.0001077 and $0.0001907 within the day.
The market capitalization stands at approximately $394,175.66, with a circulating supply of 2.83 billion tokens representing 4% of the maximum supply of 10 billion tokens. The fully diluted market cap is estimated at $1.39 million. Trading volume over the past 24 hours reached $36,853.71, indicating active market participation despite the relatively modest market cap.
The broader timeframe analysis reveals significant price corrections, with declines of 60.97% over the past week and 80.73% over the past month. The market sentiment indicator currently registers at level 2, reflecting cautious investor positioning.
DGRAM maintains a presence across 11 exchanges and has approximately 3,819 token holders. The token operates on the BSC network under the BEP-20 standard, with contract address 0x49c6c91ec839a581de2b882e868494215250ee59.
Click to view current DGRAM market price
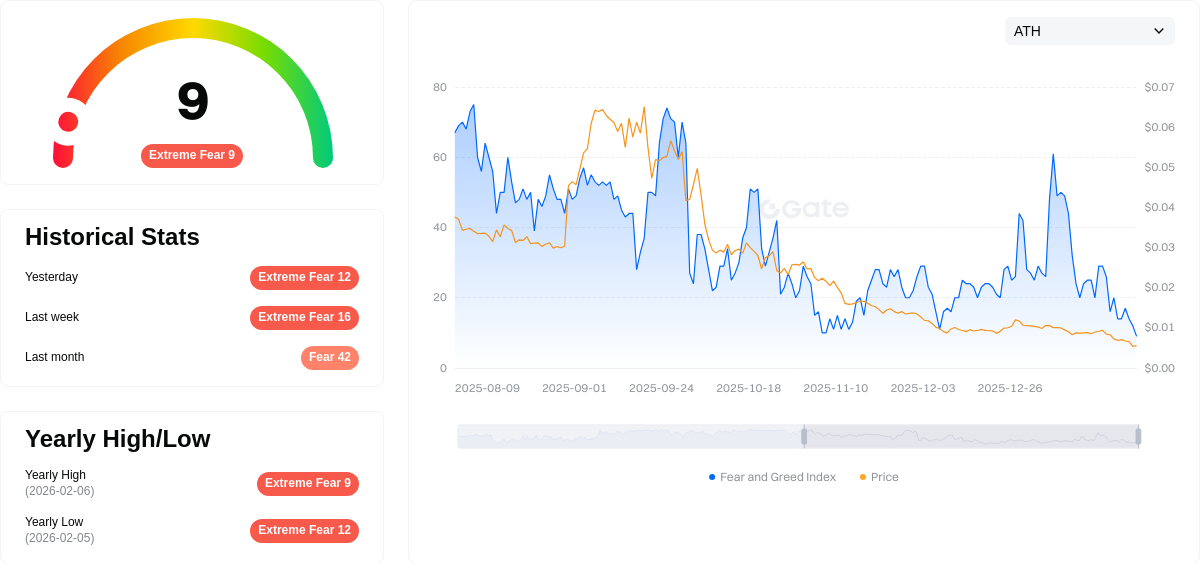
DGRAM Market Sentiment Indicator
2026-02-06 Fear and Greed Index: 9 (Extreme Fear)
Click to view current Fear & Greed Index
The cryptocurrency market is currently experiencing extreme fear, with the Fear and Greed Index hitting a critical low of 9. This level indicates significant market pessimism and heightened selling pressure across digital assets. When the index reaches such extreme lows, it often signals capitulation among investors, creating potential reversal opportunities for contrarian traders. Investors should exercise caution and conduct thorough research before making trading decisions during such volatile periods. Understanding market sentiment through indicators like this can help inform your investment strategy on Gate.com.
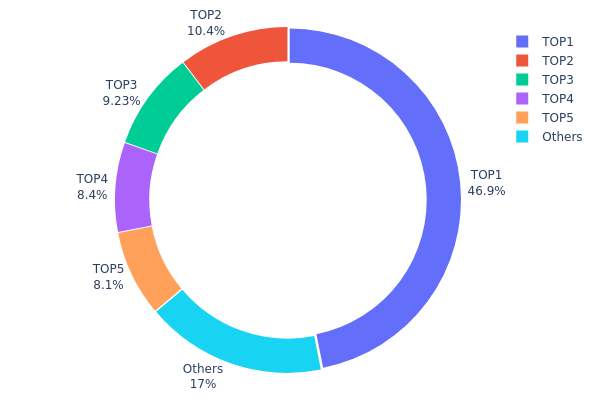
DGRAM Holdings Distribution
The holdings distribution chart illustrates the concentration of token ownership across different wallet addresses, serving as a critical indicator of market structure and decentralization level. This metric helps identify whether the token supply is widely dispersed among numerous holders or concentrated in the hands of a few large addresses, which can significantly impact market dynamics and price stability.
Based on the current data, DGRAM exhibits a notably high concentration pattern. The top address alone controls 1,115,699.70K tokens, representing 46.87% of the total supply—nearly half of all circulating tokens. The top five addresses collectively hold 1,975,016.42K tokens, accounting for 82.95% of the supply. This leaves only 17.05% distributed among all other addresses, indicating a highly centralized ownership structure.
Such extreme concentration poses several implications for market behavior. The dominance of a single address holding nearly 47% creates substantial centralization risk, as large-scale movements from this wallet could trigger significant price volatility. The top five addresses' combined 83% control means that coordinated actions—whether intentional or coincidental—could dramatically influence market sentiment and liquidity. This structure also elevates the potential for price manipulation, as major holders possess sufficient market power to impact trading dynamics. From an on-chain perspective, this distribution pattern suggests DGRAM remains in an early developmental phase with limited retail participation, indicating lower decentralization compared to more mature digital assets.
Click to view current DGRAM Holdings Distribution
| Top |
Address |
Holding Qty |
Holding (%) |
| 1 |
0x1efd...79f920 |
1115699.70K |
46.87% |
| 2 |
0x73d8...4946db |
246946.93K |
10.37% |
| 3 |
0x1ab4...8f8f23 |
219637.78K |
9.22% |
| 4 |
0x02c7...268cdb |
200000.00K |
8.40% |
| 5 |
0x238a...d5e6c4 |
192732.01K |
8.09% |
| - |
Others |
405200.39K |
17.05% |
II. Core Factors Influencing DGRAM's Future Price
Supply Mechanism
- High Initial Circulation and Holder Concentration: DGRAM features a substantial unlocked allocation at launch combined with a concentrated holder base, which amplifies short-term volatility risks. Large holders (whales) possess the potential to significantly influence price movements through their trading activities.
- Historical Patterns: High initial circulating supply with concentrated ownership typically increases price volatility, as single large transactions can disproportionately impact market dynamics.
- Current Impact: The token distribution structure presents near-term price fluctuation risks. Airdrop conclusion and early participant profit-taking activities may exert downward pressure on short-term price trends.
Institutional and Major Holder Dynamics
- Whale Activity: The concentrated holder base means individual large transactions can substantially affect DGRAM's price trajectory. Monitoring whale movements becomes essential for understanding potential price volatility.
- Early Participant Behavior: Early-stage participants who received tokens through airdrops or initial allocations may engage in profit-taking, potentially creating selling pressure during the initial trading phases.
Macroeconomic Environment
- Market Sentiment: Investor confidence and sentiment directly influence DGRAM's price movements. Positive news regarding widespread adoption or significant technological breakthroughs can drive demand and price appreciation.
- Cryptocurrency Market Cycles: DGRAM's price remains susceptible to broader cryptocurrency market trends, regulatory developments, and global economic conditions that affect overall digital asset valuations.
Technological Development and Ecosystem Building
- DePIN and AI Integration: The convergence of Decentralized Physical Infrastructure Networks (DePIN) and artificial intelligence technologies represents a key growth driver. This integration may stimulate increased demand for DGRAM tokens as the network expands.
- Real-World Application and Enterprise Integration: Long-term token value depends heavily on practical use cases and successful integration with enterprise systems. The network's ability to deliver real-time connectivity and cross-network interoperability across its global node infrastructure will be critical.
- Network Expansion: With support from hundreds of thousands of nodes distributed across more than 150 countries, the network's continued growth and operational efficiency will influence token utility and demand.
III. 2026-2031 DGRAM Price Prediction
2026 Outlook
- Conservative Prediction: $0.00009 - $0.00014
- Neutral Prediction: $0.00014 (average trading level)
- Optimistic Prediction: $0.00018 (requires sustained market momentum and increased trading volume)
2027-2029 Mid-term Outlook
- Market Stage Expectation: gradual development phase with moderate volatility
- Price Range Forecast:
- 2027: $0.00014 - $0.00018
- 2028: $0.00011 - $0.00024
- 2029: $0.00018 - $0.0003
- Key Catalysts: potential ecosystem expansion, enhanced adoption rates, and favorable market sentiment driving progressive growth
2030-2031 Long-term Outlook
- Baseline Scenario: $0.00015 - $0.00027 (assuming steady market conditions and continued project development)
- Optimistic Scenario: $0.00022 - $0.00036 (assuming accelerated adoption and positive regulatory environment)
- Transformative Scenario: potential to reach upper bounds if extraordinary market conditions align with significant technological breakthroughs
- 2026-02-06: DGRAM maintaining current price levels with projected average around $0.00014 (early-stage consolidation phase)
| Year |
Predicted High Price |
Predicted Average Price |
Predicted Low Price |
Price Change |
| 2026 |
0.00018 |
0.00014 |
0.00009 |
0 |
| 2027 |
0.00018 |
0.00016 |
0.00014 |
14 |
| 2028 |
0.00024 |
0.00017 |
0.00011 |
20 |
| 2029 |
0.0003 |
0.0002 |
0.00018 |
45 |
| 2030 |
0.00027 |
0.00025 |
0.00015 |
81 |
| 2031 |
0.00036 |
0.00026 |
0.00022 |
87 |
IV. DGRAM Professional Investment Strategy and Risk Management
DGRAM Investment Methodology
(1) Long-term Holding Strategy
- Target Investors: DePIN infrastructure enthusiasts and technology believers who recognize the potential of decentralized data networks
- Operational Recommendations:
- Adopt a phased accumulation approach during market downturns, avoiding concentrated purchases
- Maintain position for at least 12-24 months to capture potential ecosystem development benefits
- Storage Solution: Use Gate Web3 Wallet for secure asset custody with multi-signature protection enabled
(2) Active Trading Strategy
- Technical Analysis Tools:
- Volume-Price Analysis: Monitor the relationship between DGRAM's trading volume ($36,853.71 in 24h) and price movements to identify potential reversal points
- Support/Resistance Levels: Track recent low ($0.0001077) as key support and 24h high ($0.0001907) as near-term resistance
- Swing Trading Considerations:
- Exercise caution given high volatility (24h change: -18.59%, 7d: -60.97%)
- Set strict stop-loss orders at 5-10% below entry points due to elevated market risk
DGRAM Risk Management Framework
(1) Asset Allocation Principles
- Conservative Investors: 0.5-1% of crypto portfolio
- Aggressive Investors: 2-3% of crypto portfolio
- Professional Investors: Up to 5% with active hedging strategies
(2) Risk Hedging Solutions
- Portfolio Diversification: Balance DGRAM holdings with established cryptocurrencies and stablecoins
- Position Sizing: Never allocate more than 5% of total investment capital to single emerging projects
(3) Secure Storage Solutions
- Hot Wallet Option: Gate Web3 Wallet for convenient trading access with reasonable security features
- Cold Storage Method: Hardware wallets for long-term holdings exceeding $1,000 in value
- Security Precautions: Enable two-factor authentication, regularly update security settings, and never share private keys or seed phrases
V. DGRAM Potential Risks and Challenges
DGRAM Market Risks
- Extreme Volatility: Price has declined 98.67% from peak levels, demonstrating significant volatility that may result in substantial losses
- Low Liquidity: With 24-hour trading volume of approximately $36,854 and market cap around $394,176, liquidity constraints may impact large order execution
- Limited Exchange Presence: Trading availability on 11 exchanges may restrict market access and price discovery efficiency
DGRAM Regulatory Risks
- DePIN Regulatory Uncertainty: Evolving global regulations around decentralized physical infrastructure networks may impact project operations
- Data Privacy Compliance: Cross-border data routing and verification activities may face varying regulatory requirements across jurisdictions
- Token Classification: Potential regulatory scrutiny regarding token utility and security classification in different markets
DGRAM Technical Risks
- Early-Stage Development: As an emerging protocol supporting next-generation DePIN networks, technical implementation risks remain elevated
- Smart Contract Vulnerabilities: BEP-20 token standard carries inherent smart contract risks including potential exploits or coding errors
- Scalability Challenges: Ambitious goal of scaling to hundreds of millions of devices presents significant technical and operational hurdles
VI. Conclusion and Action Recommendations
DGRAM Investment Value Assessment
Datagram Network presents an innovative approach to decentralized data infrastructure with partnerships across AI, energy, and decentralized systems sectors. However, the token faces considerable challenges including dramatic price decline (98.67% from peak), limited liquidity, and low market capitalization ($394,176). While the long-term vision of supporting global DePIN networks holds theoretical potential, current market performance and early-stage development suggest elevated risk levels. The 4% circulating supply ratio indicates significant future token unlock risks that may create additional selling pressure.
DGRAM Investment Recommendations
✅ Beginners: Avoid investing in DGRAM at this stage due to extreme volatility, limited track record, and high risk profile unsuitable for novice investors
✅ Experienced Investors: Consider minimal speculative allocation (under 1% of portfolio) only if risk tolerance allows for potential total loss, focusing on project milestone achievements
✅ Institutional Investors: Conduct comprehensive due diligence on technical infrastructure, partnership validation, and team credentials before considering strategic positioning
DGRAM Trading Participation Methods
- Spot Trading on Gate.com: Access DGRAM spot markets with competitive fee structures and reliable order execution
- Limit Order Strategy: Place strategic limit orders near support levels ($0.0001077) to optimize entry prices given high volatility
- Gradual Position Building: Implement dollar-cost averaging over extended periods rather than large lump-sum purchases
Cryptocurrency investment carries extremely high risks, and this article does not constitute investment advice. Investors should make prudent decisions based on their own risk tolerance and are advised to consult professional financial advisors. Never invest more than you can afford to lose.
FAQ
What is DGRAM? What are its main uses and technical characteristics?
DGRAM is a decentralized data communication protocol designed for Web3 applications, enabling low-latency, peer-to-peer data transmission. Its primary uses include decentralized messaging, real-time data synchronization, and blockchain data verification. Technical features include UDP-based efficiency, reduced transaction fees, and enhanced privacy through encryption.
What is the historical price trend of DGRAM? What were the highest and lowest prices in the past?
DGRAM reached an all-time high of US$0.01855 and an all-time low of US$0.0003303. The current price remains significantly below its historical peak, trading approximately 98.16% lower than the highest point.
How to predict DGRAM's future price? What analysis methods can be referenced?
Use technical indicators like MACD and RSI to analyze DGRAM price trends. MACD crossovers signal momentum shifts, while RSI identifies overbought/oversold levels. Monitor trading volume, market sentiment, and on-chain metrics for comprehensive price prediction.
What are the main factors affecting DGRAM price?
DGRAM price is primarily influenced by market demand, regulatory policies, technological developments, and overall economic trends. Trading volume, investor sentiment, and network adoption also play significant roles in determining price movements.
What are the investment risks of DGRAM? How should they be evaluated?
DGRAM investment risks include market volatility and technological uncertainty. Evaluate by analyzing project innovation, market demand, trading volume, and community adoption. Conduct thorough research before investing to assess your risk tolerance.
What are the advantages and disadvantages of DGRAM compared to other similar digital assets?
DGRAM offers high transaction speed and low fees, providing efficient blockchain operations. However, it faces higher volatility and market liquidity challenges compared to established assets, making it suitable for experienced investors seeking growth opportunities.
* The information is not intended to be and does not constitute financial advice or any other recommendation of any sort offered or endorsed by Gate.