This comprehensive article delivers professional LEVER price analysis and market forecasts covering 2026-2031. LEVER, the native token of LeverFi, operates as a DeFi infrastructure asset on EVM-compatible chains including Ethereum and Avalanche, currently trading at $0.00001143 with extreme market fear conditions. The analysis combines historical price evolution from 2022 launch, current market dynamics, and institutional participation patterns to project price movements. Core forecasts indicate stable positioning through 2026 with gradual appreciation toward $0.00002 by 2031, representing approximately 46% growth. The article examines supply mechanisms, macroeconomic factors, and competitive dynamics while providing tiered investment strategies for conservative, experienced, and institutional investors. Risk management frameworks address volatility concerns, liquidity constraints, regulatory uncertainties, and smart contract vulnerabilities. Readers gain actionable insights for trading on Gate.com, storage s
Introduction: LEVER's Market Position and Investment Value
LEVER, the native token of LeverFi, serves as a DeFi infrastructure asset facilitating seamless integration with fundamental decentralized finance protocols. Since its launch in 2022, the project has evolved from its predecessor RAMP DeFi through a strategic rebranding and token migration at a 1:35 conversion ratio. As of February 6, 2026, LEVER maintains a market capitalization of approximately $400,041, with a circulating supply of around 34.99 billion tokens, trading at $0.00001143. This asset, positioned as a utility token within the asset management and DeFi leveraging ecosystem, operates primarily on EVM-compatible chains including Ethereum, Avalanche, and Arbitrum.
This article provides a comprehensive analysis of LEVER's price trajectory from 2026 through 2031, combining historical patterns, market supply-demand dynamics, ecosystem development milestones, and macroeconomic factors to deliver professional price forecasts and practical investment strategies for market participants.
I. LEVER Price History Review and Market Status
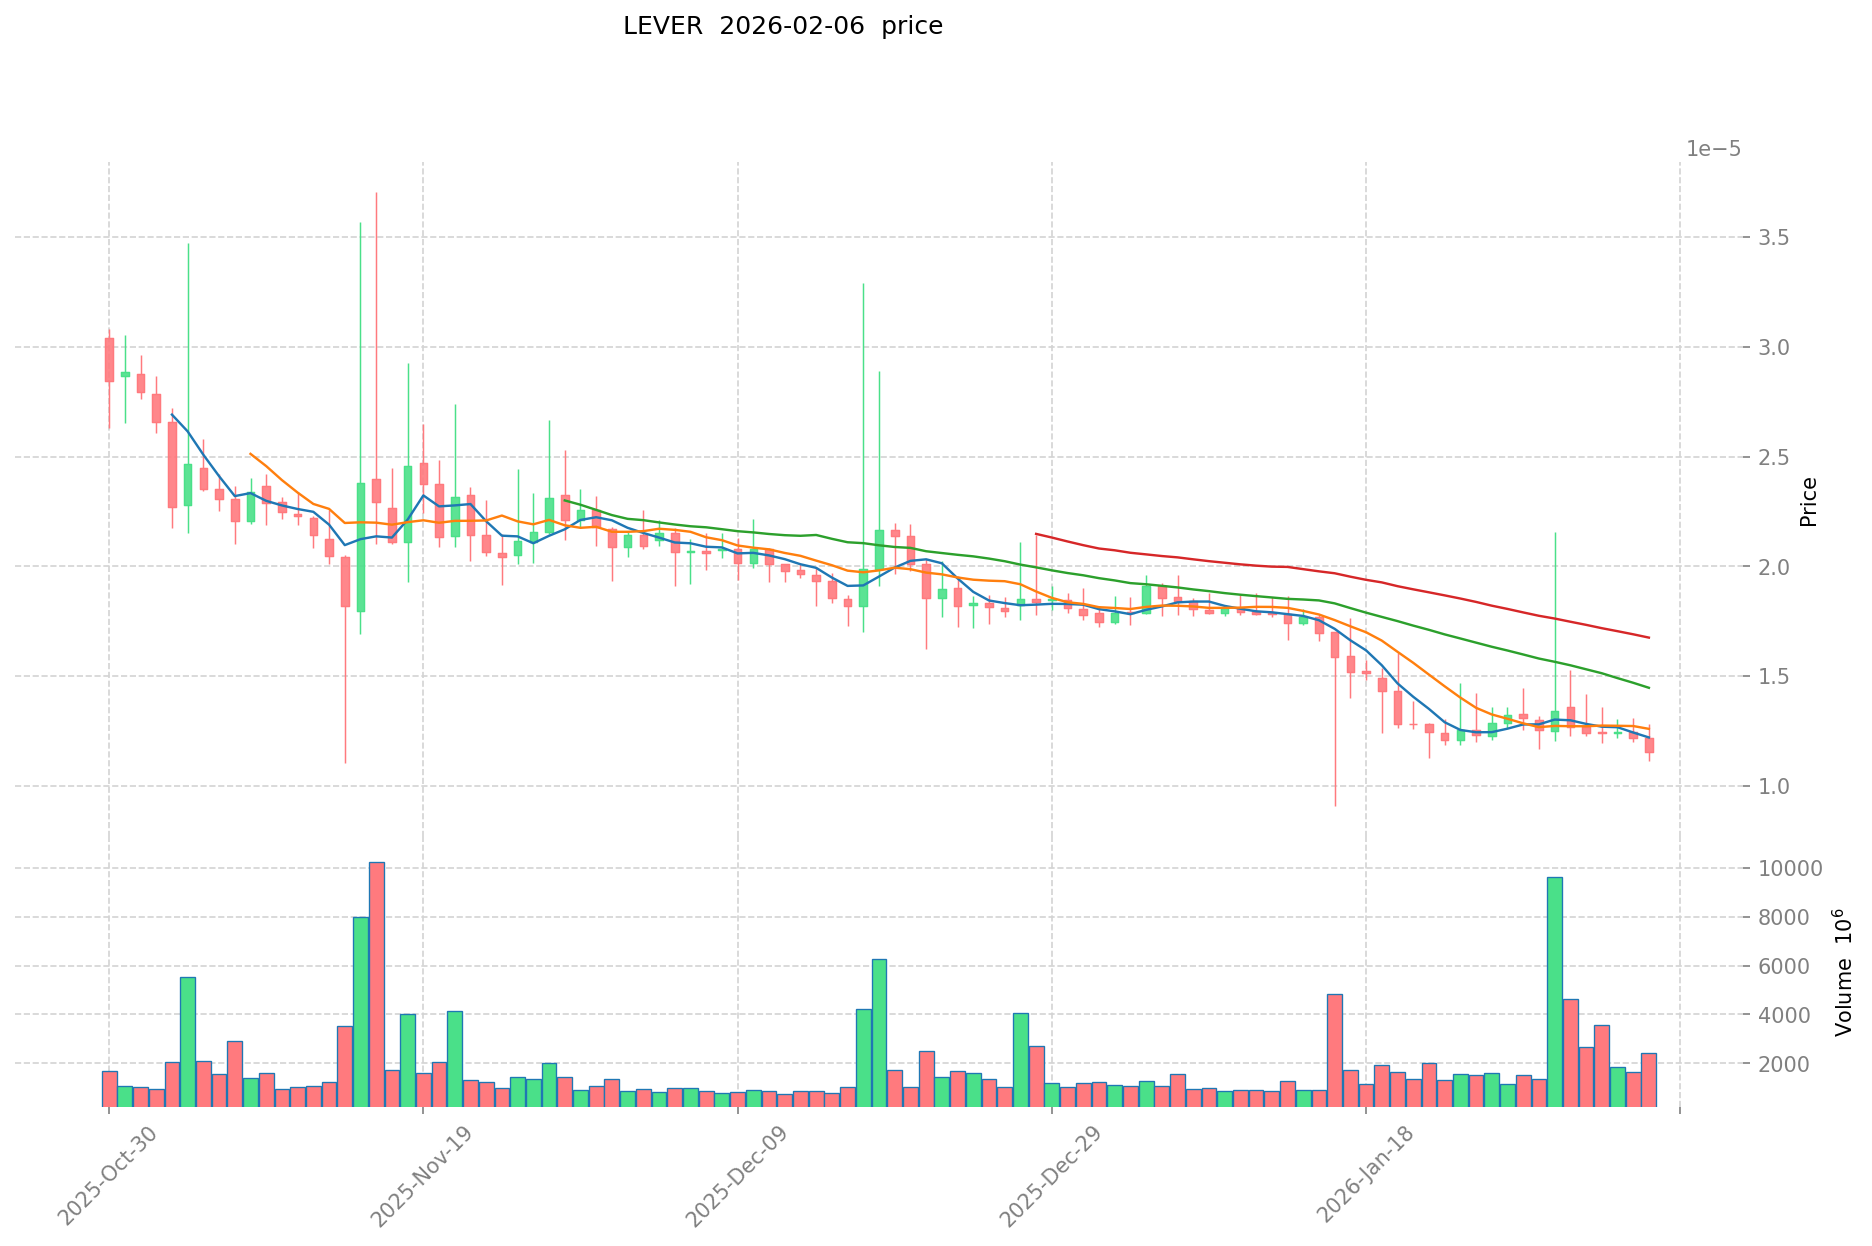
LEVER Historical Price Evolution
- 2022: Token launched in July with an initial price of $0.001444, reaching an all-time high of $0.00521513 on July 16, 2022, representing a notable price increase during the early trading period
- 2022-2025: The token experienced a prolonged downward trend, with prices declining substantially from the peak levels established in mid-2022
- 2026: On February 6, 2026, LEVER recorded its all-time low of $0.00001124, reflecting a significant price contraction from historical highs
LEVER Current Market Situation
As of February 6, 2026, LEVER is trading at $0.00001143, showing a 24-hour decline of 5.44%. The token has experienced negative price momentum across multiple timeframes, with a 5.050% decrease over the past 7 days and a 37.36% decline over the past 30 days. The one-year performance indicates a substantial decrease of 99.039%.
The current market capitalization stands at approximately $400,041, with a 24-hour trading volume of $29,295. The circulating supply represents 62.74% of the total supply, with 34.99 billion LEVER tokens in circulation out of a total supply of 42 billion tokens. The token holder count is recorded at 8,647 addresses.
The 24-hour price range has fluctuated between $0.00001115 and $0.00001284. Market sentiment indicators suggest an extreme fear level with a volatility index of 9, reflecting cautious investor sentiment in the current trading environment. LEVER maintains a market dominance of 0.000020% and is listed on 4 exchanges, with trading available on Gate.com.
Click to view current LEVER market price
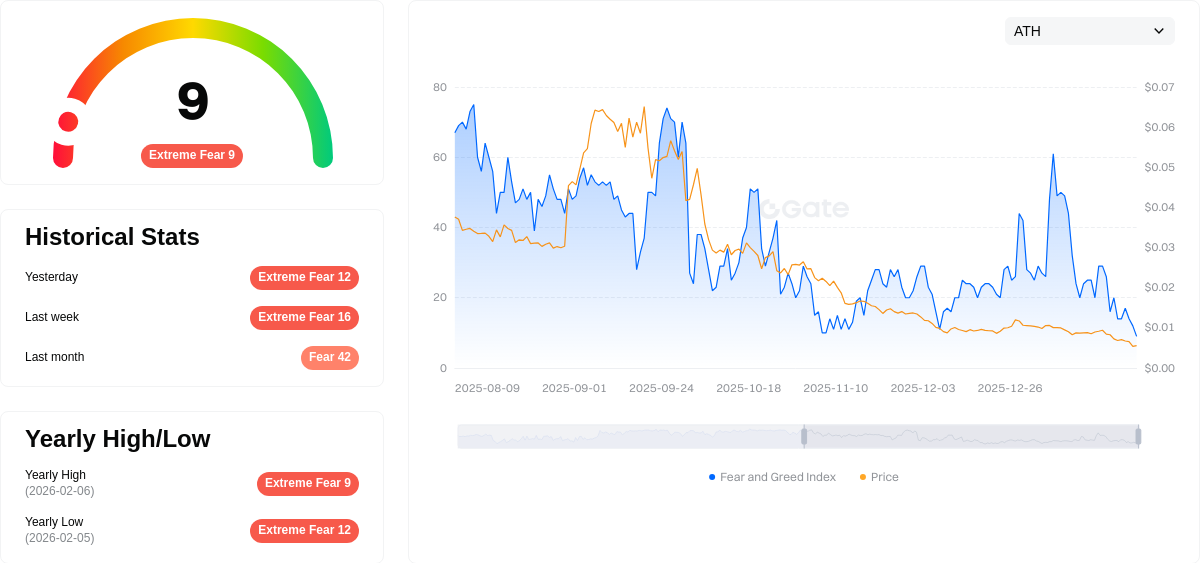
LEVER Market Sentiment Index
2026-02-06 Fear and Greed Index: 9 (Extreme Fear)
Click to view current Fear & Greed Index
The crypto market is experiencing extreme fear with the Fear and Greed Index hitting 9, signaling severe market pessimism. This exceptionally low reading indicates investors are highly risk-averse, with widespread concerns dominating market sentiment. Such extreme fear conditions often present contrarian opportunities for long-term investors, as panic-driven sell-offs may create attractive entry points. However, caution remains advisable until stabilization signals emerge. Market participants should carefully evaluate their risk tolerance and investment strategies during this volatile period on Gate.com.
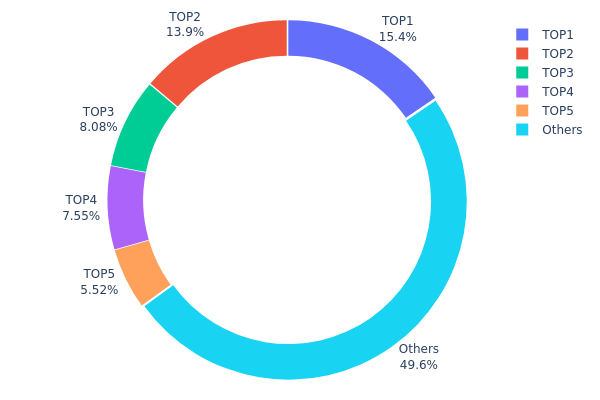
LEVER Holdings Distribution
The holdings distribution chart reflects the concentration of token ownership across different addresses on the blockchain. By analyzing the distribution pattern of LEVER tokens among top holders and other addresses, we can assess the degree of decentralization in token circulation and evaluate potential impacts on market structure and price volatility.
According to the current data, LEVER exhibits a moderate to high concentration pattern. The top holder controls 8,609,262.90K tokens, accounting for 15.43% of the total supply, while the second-largest address holds 13.85%. The top five addresses collectively control approximately 50.41% of the total supply, with the remaining 49.59% distributed among other addresses. This distribution structure indicates that nearly half of the token supply is concentrated in a relatively small number of addresses, which may increase market vulnerability to large-scale trading activities by major holders.
Such concentration levels present both opportunities and risks for market participants. On one hand, if these major holders are project teams, institutional investors, or long-term supporters, their stable holding behavior may provide price support and reduce market volatility. On the other hand, excessive concentration could lead to potential market manipulation risks, where sudden large-scale sell-offs by major holders could trigger significant price fluctuations. Currently, LEVER's holdings distribution suggests a market structure that leans toward centralized control, requiring investors to closely monitor the trading behaviors of major addresses to better assess short-term market risks and price movement trends.
Click to view current LEVER Holdings Distribution
| Top |
Address |
Holding Qty |
Holding (%) |
| 1 |
0x0d07...b492fe |
8609262.90K |
15.43% |
| 2 |
0x0529...c553b7 |
7731907.74K |
13.85% |
| 3 |
0x9642...2f5d4e |
4505149.94K |
8.07% |
| 4 |
0x4b4c...bb0829 |
4210002.21K |
7.54% |
| 5 |
0xc4e6...321876 |
3081735.29K |
5.52% |
| - |
Others |
27648441.93K |
49.59% |
II. Core Factors Influencing LEVER's Future Price
Supply Mechanism
LEVER's price outlook is influenced by market demand dynamics and adoption trends. The token exhibits notable volatility characteristics typical of smaller market capitalization digital assets. Historical data indicates LEVER has experienced significant price fluctuations, with instances of substantial single-day movements reflecting sensitivity to market sentiment shifts.
Institutional and Major Holder Dynamics
The involvement of institutional participants represents a key factor in LEVER's price development. Market demand from institutional actors, alongside broader adoption trends, contributes to price formation. The cryptocurrency's trajectory is shaped by participation levels from various market segments, though specific institutional holding patterns require ongoing monitoring as the ecosystem evolves.
Macroeconomic Environment
Monetary Policy Impact: LEVER's price performance correlates with broader economic conditions and global financial market trends. Changes in monetary policy frameworks and interest rate environments may influence investor risk appetite toward digital assets, including LEVER.
Geopolitical Factors: International economic developments and regulatory shifts across jurisdictions continue to shape the operational landscape for cryptocurrencies. LEVER's price sensitivity to these external factors underscores the importance of monitoring global market dynamics.
Market Demand and Competitive Dynamics
The cryptocurrency's price prospects are tied to evolving market demand patterns and competitive positioning within the decentralized finance sector. Supply and demand dynamics, influenced by both retail and institutional participation, remain central to price discovery processes. Additionally, broader cryptocurrency market trends and inter-asset competition factor into LEVER's valuation framework.
Investors should maintain awareness of ongoing market developments, technological advancements in the blockchain space, and regulatory evolution as these elements collectively influence LEVER's price trajectory. The cryptocurrency's inherent volatility necessitates careful consideration of risk factors when evaluating future price potential.
III. 2026-2031 LEVER Price Prediction
2026 Outlook
- Conservative prediction: $0.00001
- Neutral prediction: $0.00001
- Optimistic prediction: $0.00001
Based on current market data, LEVER is expected to maintain a relatively stable price level throughout 2026, with predicted high, average, and low prices all converging at $0.00001. This suggests limited volatility in the near term, with the token trading within a tight range.
2027-2029 Outlook
- Market stage expectation: Gradual growth phase with incremental upward movement
- Price range prediction:
- 2027: $0.00001 (projected change: +2%)
- 2028: $0.00001-$0.00002 (projected change: +4%)
- 2029: $0.00001-$0.00002 (projected change: +24%)
- Key catalysts: Market adoption trends, ecosystem development, and broader crypto market sentiment
During this mid-term period, LEVER may experience modest appreciation, with 2029 showing a more notable potential increase of approximately 24% compared to 2026 levels. The price is expected to gradually test the $0.00002 threshold as market conditions evolve.
2030-2031 Long-term Outlook
- Baseline scenario: $0.00001-$0.00002 (assuming steady market conditions and continued project development)
- Optimistic scenario: $0.00002 (assuming favorable market conditions and increased adoption)
- Transformative scenario: $0.00002+ (under highly favorable market conditions with significant ecosystem expansion)
By 2030, LEVER could see a projected change of approximately 28% from 2026 levels, while 2031 forecasts suggest a potential increase of around 46%. The token's average price is expected to stabilize around $0.00002 by 2031, reflecting gradual market maturation and sustained interest in the project. However, investors should note that these projections are subject to market volatility and various external factors that could impact actual performance.
| Year |
Predicted High Price |
Predicted Average Price |
Predicted Low Price |
Price Change |
| 2026 |
0.00001 |
0.00001 |
0.00001 |
0 |
| 2027 |
0.00001 |
0.00001 |
0.00001 |
2 |
| 2028 |
0.00002 |
0.00001 |
0.00001 |
4 |
| 2029 |
0.00002 |
0.00001 |
0.00001 |
24 |
| 2030 |
0.00002 |
0.00001 |
0.00001 |
28 |
| 2031 |
0.00002 |
0.00002 |
0.00001 |
46 |
IV. LEVER Professional Investment Strategy and Risk Management
LEVER Investment Methodology
(I) Long-term Holding Strategy
- Suitable for: Patient investors seeking exposure to DeFi leverage protocols with moderate risk tolerance
- Operational Recommendations:
- Consider accumulating positions during market corrections when the token trades significantly below historical averages
- Monitor project development milestones and community engagement metrics on platforms like Twitter and GitHub
- Storage Solution: Use Gate Web3 Wallet for secure custody with multi-signature functionality, or consider hardware wallet integration for larger holdings
(II) Active Trading Strategy
- Technical Analysis Tools:
- Volume Analysis: Monitor the 24-hour trading volume ($29,294) relative to market cap to identify liquidity trends and potential breakout points
- Support and Resistance Levels: Track the 24-hour range ($0.00001115 - $0.00001284) to identify entry and exit zones
- Swing Trading Considerations:
- Given the recent volatility (-5.44% in 24H, -37.36% in 30D), establish clear stop-loss levels to protect capital
- Consider the low liquidity environment when sizing positions to avoid significant slippage
LEVER Risk Management Framework
(I) Asset Allocation Principles
- Conservative Investors: 1-2% of cryptocurrency portfolio allocation
- Aggressive Investors: 3-5% of cryptocurrency portfolio allocation
- Professional Investors: Up to 7-10% with active hedging strategies and continuous monitoring
(II) Risk Hedging Approaches
- Position Sizing: Limit individual position exposure due to relatively low market cap ($400,041) and recent price decline trends
- Diversification Strategy: Balance LEVER holdings with more established DeFi tokens to reduce protocol-specific risk
(III) Secure Storage Solutions
- Hot Wallet Recommendation: Gate Web3 Wallet for active trading with convenient access and integrated security features
- Cold Storage Approach: For holdings intended for long-term investment, consider transferring to hardware wallet solutions after accumulation
- Security Precautions: Enable two-factor authentication, verify contract addresses (0x4B5f49487ea7B3609b1aD05459BE420548789f1f on Ethereum), and never share private keys or seed phrases
V. LEVER Potential Risks and Challenges
LEVER Market Risks
- High Volatility: The token has experienced substantial declines (-99.039% over 1 year), indicating extreme price volatility that may result in significant capital losses
- Liquidity Concerns: With relatively modest daily trading volume and only 4 exchanges listing the token, liquidity constraints could impact large position entries or exits
- Market Cap Position: Ranked #3188 with a market cap of approximately $400,000, the project faces challenges in gaining broader market recognition and institutional adoption
LEVER Regulatory Risks
- DeFi Protocol Scrutiny: Leverage-focused DeFi platforms may face increased regulatory attention as authorities examine lending protocols and derivatives-like products
- Compliance Evolution: Potential changes in cryptocurrency regulations across jurisdictions could impact the platform's operational model and token utility
- Token Classification Uncertainty: Evolving regulatory frameworks may lead to reclassification of governance or utility tokens, affecting trading availability and compliance requirements
LEVER Technical Risks
- Smart Contract Vulnerabilities: DeFi platforms integrating with multiple protocols face potential security risks from smart contract exploits or integration failures
- Platform Dependency: The project's reliance on EVM-compatible chains (Avalanche, Arbitrum) means network issues or ecosystem changes could affect platform performance
- Development Activity: Investors should monitor GitHub activity and development updates to assess ongoing technical maintenance and innovation capacity
VI. Conclusion and Action Recommendations
LEVER Investment Value Assessment
LEVER presents as a specialized DeFi leverage protocol with significant risk-reward dynamics. The token's substantial decline from its all-time high (approximately $0.00521513 in July 2022) to current levels near historical lows ($0.00001143) reflects both market-wide crypto sentiment shifts and project-specific challenges. While the platform offers seamless integration with DeFi protocols and operates on efficient EVM chains, the low market cap, limited exchange listings, and reduced liquidity suggest elevated risk for potential investors. The long-term value proposition depends heavily on the team's ability to expand the platform's utility, grow the user base beyond current holder count (8,647), and navigate an increasingly competitive DeFi landscape.
LEVER Investment Recommendations
✅ Beginners: Consider avoiding LEVER until gaining more experience with established cryptocurrencies; if interested, limit exposure to less than 1% of total portfolio and focus on understanding DeFi mechanics first
✅ Experienced Investors: Approach with extreme caution; allocate only risk capital you can afford to lose entirely; establish strict stop-loss parameters and monitor project developments closely through official channels
✅ Institutional Investors: Conduct comprehensive due diligence on protocol security, team credentials, and competitive positioning; consider LEVER only as a speculative allocation within a broadly diversified DeFi portfolio with appropriate risk hedging mechanisms
LEVER Trading Participation Methods
- Spot Trading: Access LEVER trading pairs on Gate.com with immediate settlement and full ownership of tokens
- Dollar-Cost Averaging: For those with conviction in long-term potential, consider systematic small purchases over time to mitigate timing risk
- Gate Web3 Wallet Integration: Utilize Gate Web3 Wallet for seamless transfer between exchange trading and decentralized protocol interactions
Cryptocurrency investment carries extreme risk, and this article does not constitute investment advice. Investors should make prudent decisions based on their own risk tolerance and are advised to consult professional financial advisors. Never invest more than you can afford to lose.
FAQ
What is LEVER token and what is its purpose?
LEVER is the native token of Lever Finance ecosystem, a decentralized finance platform. It enables governance participation, provides utility functions, and offers staking rewards for token holders in the protocol.
What are the main factors affecting LEVER price?
LEVER price is primarily influenced by market sentiment, regulatory policies, trading volume, Bitcoin market trends, and community adoption. Crypto markets react sharply to news and regulatory changes globally.
What is the LEVER price prediction for 2024-2025?
Based on market analysis using wave count methods, LEVER was predicted to reach $0.0035 by end of 2024 and $0.0027 by end of 2025. These forecasts have now passed as we are in 2026.
What is the difference between LEVER and other leverage tokens?
LEVER's collateral is redeployed to Convex or AAVE, combining DeFi yield generation. This unique mechanism distinguishes it from other leverage tokens by providing additional value through integrated yield strategies.
What risks should I be aware of when investing in LEVER?
LEVER contract trading involves leverage which amplifies both gains and losses, presenting high risk of substantial losses. Proper risk management, position sizing, and market knowledge are essential for trading LEVER contracts safely.
How to conduct technical analysis and price prediction for LEVER?
Use RSI and MACD indicators for technical analysis. Monitor daily, weekly, and 30-day price trends. Analyze trading volume patterns and support/resistance levels. Combined indicators suggest short-term upward momentum with potential gains in coming weeks.
* The information is not intended to be and does not constitute financial advice or any other recommendation of any sort offered or endorsed by Gate.