This comprehensive analysis provides MV price forecasts and investment strategies for 2026-2031. MV, a GameFi token within the GensoKishi Metaverse ecosystem, currently trades at $0.003749 with a $1.43M market cap, representing a significant decline from its $1.66 peak. The article examines critical factors including supply mechanisms, institutional dynamics, macroeconomic conditions, and technological developments that will shape MV's trajectory. Price predictions range from $0.00227-$0.0045 in 2026, potentially reaching $0.00959 by 2031 under optimistic scenarios. Investment strategies cover long-term holding approaches for ecosystem believers and active trading methods for experienced investors, alongside comprehensive risk management frameworks. The analysis highlights both opportunities in GameFi adoption and substantial challenges including high volatility, liquidity concerns, and regulatory uncertainties, making MV suitable primarily for risk-tolerant investors. Trading on Gate offers access to MV with
Introduction: MV's Market Position and Investment Value
GensoKishi Metaverse (MV), as a GameFi token positioned within the Japanese blockchain gaming ecosystem, has been developing since its launch in 2022 based on the 13-year legacy of the MMORPG "Elemental Knights." As of 2026, MV maintains a market capitalization of approximately $1.43 million, with a circulating supply of around 380.67 million tokens, and a price hovering around $0.003749. This asset, which enables players to create, acquire, and trade in-game items as NFTs, is playing an increasingly important role in the Web3 gaming and metaverse sectors.
This article will comprehensively analyze MV's price trends from 2026 to 2031, combining historical patterns, market supply and demand dynamics, ecosystem development, and macroeconomic conditions to provide investors with professional price forecasts and practical investment strategies.
I. MV Price History Review and Market Status
MV Historical Price Evolution Trajectory
- 2022: MV launched on the market in January, reaching a notable price point of $1.66 in February, marking the early peak phase of the token.
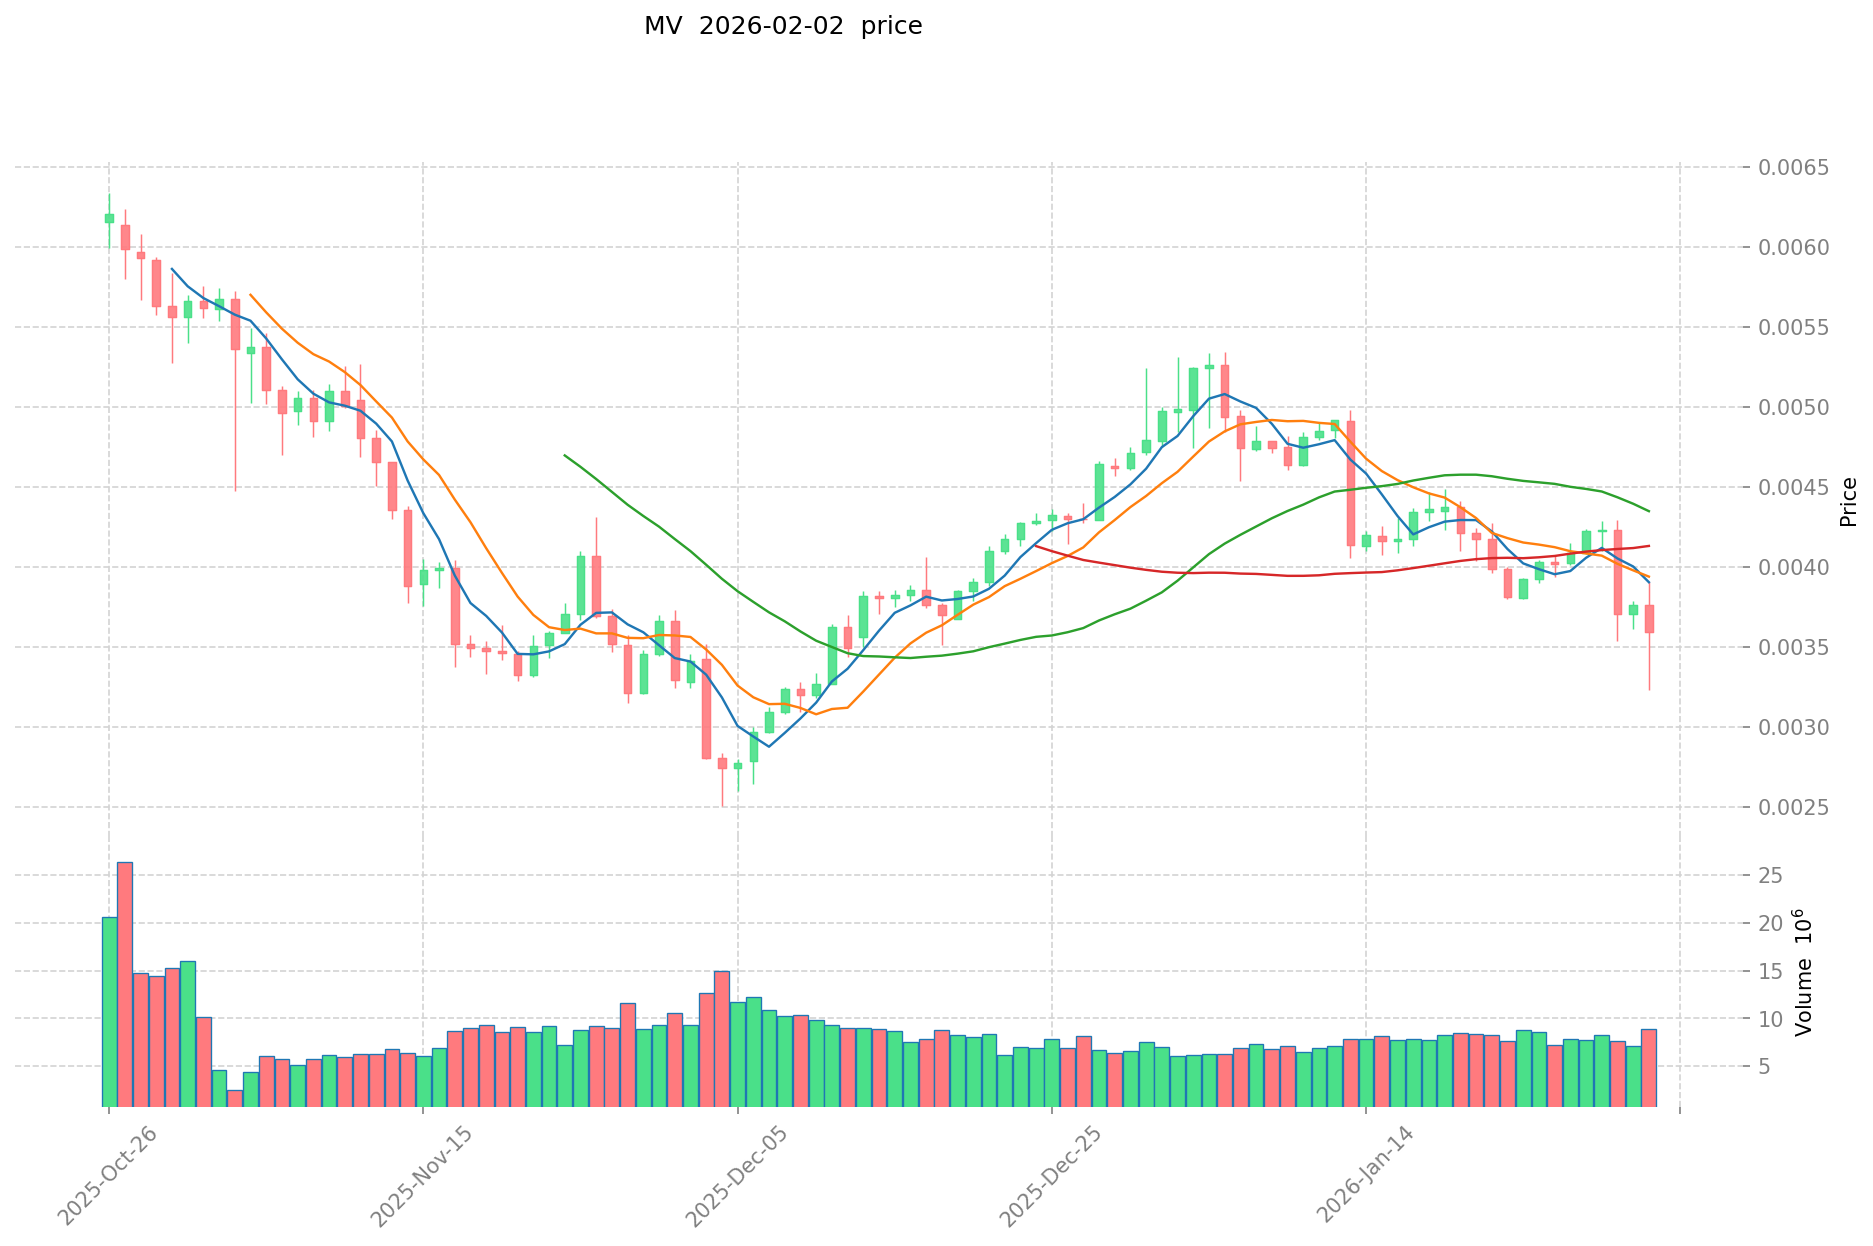
- 2025: The token experienced significant downward pressure, with the price declining to $0.00252092 in December, representing a substantial correction from earlier levels.
- 2026: The market entered a consolidation phase, with the price stabilizing around $0.003749 in early February.
MV Current Market Status
As of February 2, 2026, MV is trading at $0.003749, showing a decline of 0.66% over the past 24 hours and 0.92% over the past hour. The token has experienced more pronounced declines over longer timeframes, with a 6.85% decrease over the past 7 days, a 26% decline over the past 30 days, and a 64.33% decrease over the past year.
The 24-hour trading volume stands at $35,239.40, while the market capitalization is approximately $1.43 million. The circulating supply is 380.67 million MV tokens, representing 19.03% of the total supply of 400 million tokens. The fully diluted valuation is calculated at $1.50 million, with a maximum supply cap of 2 billion tokens.
The token's 24-hour price range has fluctuated between $0.003227 and $0.003908. MV is currently ranked at position 2279 in the cryptocurrency market, with a market dominance of 0.000055%. The token has 12,789 holders and is available for trading on 3 exchanges.
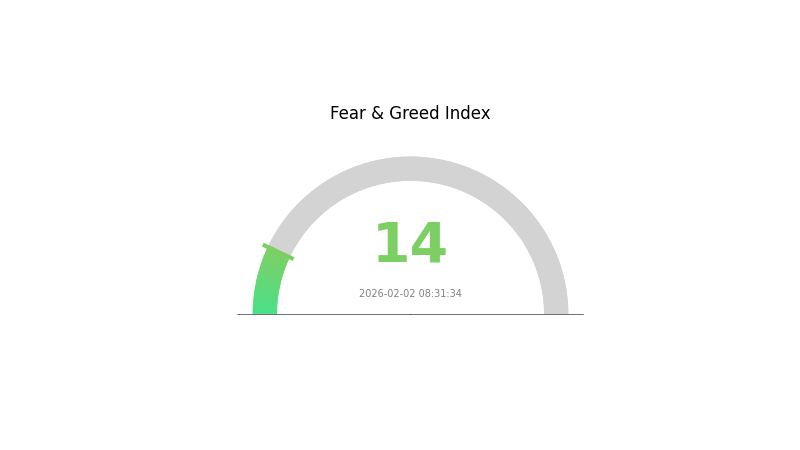
The current market sentiment indicator shows a reading of 14, reflecting an "Extreme Fear" environment in the broader cryptocurrency market, which may be contributing to the recent price pressure on MV.
Click to view current MV market price
MV Market Sentiment Indicator
2026-02-02 Fear and Greed Index: 14 (Extreme Fear)
Click to view the current Fear & Greed Index
The crypto market is currently experiencing extreme fear, with the Fear and Greed Index at 14. This indicates strong market pessimism and heightened risk aversion among investors. During such periods, market volatility typically increases as traders adopt defensive strategies. However, historically, extreme fear often precedes significant market corrections or potential buying opportunities for long-term investors. It's crucial to monitor market developments closely and manage risk appropriately during this phase.
MV Holding Distribution
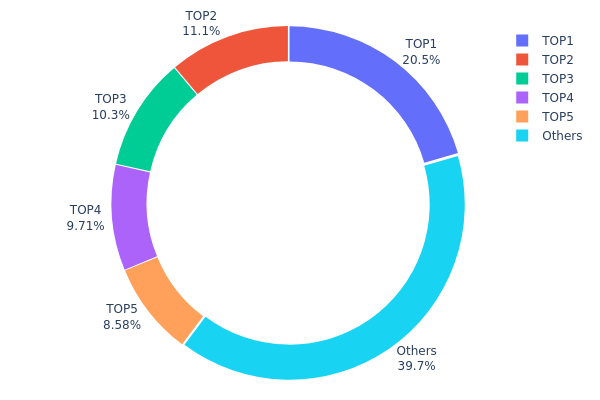
The holding distribution chart reveals the allocation of MV tokens across different wallet addresses, serving as a critical indicator of token concentration and decentralization level within the ecosystem. According to the latest on-chain data, the top 5 addresses collectively hold 175,739.71K MV tokens, representing approximately 60.27% of the total circulating supply. Specifically, the largest holder controls 59,841.01K tokens (20.53%), while the second and third positions hold 32,453.26K (11.13%) and 30,154.58K (10.34%) respectively. The remaining addresses outside the top 5 collectively account for 39.73% of the supply, indicating a relatively concentrated distribution pattern.
This concentration level suggests a moderately centralized token structure, where more than 60% of the circulating supply is controlled by a handful of addresses. Such concentration can introduce heightened volatility risks, as large holders possess significant influence over market price movements through potential sell-offs or strategic accumulation. The dominance of the top address holding over 20% particularly warrants attention, as this single entity could theoretically exert substantial impact on liquidity and price stability during periods of market stress.
From a market structure perspective, this distribution pattern reflects an ecosystem still in its early development phase, where initial distribution mechanisms or strategic allocations have resulted in uneven token ownership. While this concentration may facilitate coordinated governance decisions in the short term, it poses challenges for long-term decentralization objectives and may deter broader retail participation due to concerns about potential price manipulation.
Click to view current MV Holding Distribution
| Top |
Address |
Holding Qty |
Holding (%) |
| 1 |
0xe505...18a473 |
59841.01K |
20.53% |
| 2 |
0x8b55...ca083b |
32453.26K |
11.13% |
| 3 |
0x9fef...23ef5e |
30154.58K |
10.34% |
| 4 |
0x1b24...6fc82c |
28290.84K |
9.70% |
| 5 |
0x2187...a85bd4 |
25000.02K |
8.57% |
| - |
Others |
115668.84K |
39.73% |
II. Core Factors Affecting MV Future Price Trends
Supply Mechanism
- Supply Reduction Policy: China's steel industry implements capacity and output precision control, environmental production limits, and "anti-involution" actions. Combined with carbon quota and energy consumption grading constraints, crude steel output continues to decline moderately.
- Historical Pattern: From 2020 to 2025, China's crude steel output decreased from 1.065 billion tons to 961 million tons, a reduction of 104 million tons. Supply-side contraction has provided support for price stability.
- Current Impact: In 2026, crude steel output is expected to continue declining by 2.2% to 940 million tons. Capacity replacement policies are becoming stricter, with replacement ratios reaching 1.5:1 or above, accelerating the exit of inefficient capacity and further tightening supply.
Institutional and Major Player Dynamics
- Institutional Holdings: By the end of 2025, China's steel industry CR10 (top ten steel enterprises' crude steel output share) reached 44%, an increase of 4.8 percentage points compared to the end of the "13th Five-Year Plan." Leading enterprises continue to consolidate resources and enhance market voice through mergers and acquisitions.
- Enterprise Adoption: Major projects such as Baosteel's Zhanjiang Steel No. 5 extra-thick slab continuous casting machine and Ansteel's LP steel plate have been put into production, providing key material support for offshore wind power, heavy machinery and other major projects.
- National Policy: The "Steel Industry Stable Growth Work Plan (2025-2026)" continues to implement output reduction policies, following the principle of supporting advanced enterprises and forcing backward and inefficient capacity to exit. The Central Economic Work Conference in December 2025 explicitly listed deep governance of "involution-style" competition as a key economic work task for 2026.
Macroeconomic Environment
- Monetary Policy Impact: Against the backdrop of global economic slowdown, the IMF predicts global GDP growth rate of 3.1% in 2026, lower than 3.2% in 2025. Major economies show differentiated monetary policies, with the U.S. GDP growth rate expected at 1.6%, the Eurozone at 1.3%, and Japan at 1.0%.
- Inflation Hedge Attributes: China's economy shows a "stable with resilience, quality and efficiency improvement" operating trend. Domestic institutions predict growth rates between 4.8% and 5.0%, maintaining relatively high growth levels globally.
- Geopolitical Factors: Increased global trade barriers, increased policy uncertainties, and intensified geopolitical conflicts (such as Russia-Ukraine and Middle East situations) affect international economic patterns. The U.S. imposing high tariffs, EU CBAM (Carbon Border Adjustment Mechanism) implementation, and multiple countries' anti-dumping investigations put pressure on steel exports.
Technological Development and Ecosystem Construction
- Intelligent Manufacturing Upgrade: As of the end of 2025, 95.1% of steel enterprises have incorporated digital transformation strategies into overall development plans. For example, Shougang's intelligent production decision system based on general large models achieved 100% unit allocation accuracy and 66.7% production scheduling efficiency improvement.
- Green Technology Breakthrough: Low-carbon technologies upgrade from "emission reduction orientation" to "value creation orientation," focusing on breakthroughs in disruptive technologies such as hydrogen metallurgy and CCUS (Carbon Capture, Utilization and Storage). HBIS's CCUS technology industrial demonstration project achieved efficient capture of blast furnace gas CO2 and converted it into protein feed and quality building materials.
- Ecosystem Applications: The demand structure shifts from traditional construction to high-end manufacturing. Manufacturing steel consumption accounts for over 50%, becoming the main demand support. High-end special steel material demand grows at an annual average of over 12%, with oriented silicon steel, high-temperature alloys and other special steel materials' penetration rates continuously increasing in aerospace, high-end equipment and other fields.
III. 2026-2031 MV Price Prediction
2026 Outlook
- Conservative forecast: $0.00227 - $0.00372
- Neutral forecast: $0.00372 (average expectation)
- Optimistic forecast: $0.0045 (requiring favorable market conditions and increased adoption)
2027-2029 Mid-term Outlook
- Market stage expectation: Gradual recovery phase with moderate growth potential, as the token seeks to establish stronger market positioning and expand its user base.
- Price range forecast:
- 2027: $0.00267 - $0.00431, with an average price around $0.00411
- 2028: $0.00362 - $0.00627, reflecting potential 12% growth
- 2029: $0.00304 - $0.00707, with possible 39% increase under favorable conditions
- Key catalysts: Enhanced ecosystem development, broader platform integration, and increasing market recognition may drive price appreciation during this period.
2030-2031 Long-term Outlook
- Baseline scenario: $0.00585 - $0.00616 by 2030 (assuming steady ecosystem growth and stable market conditions)
- Optimistic scenario: $0.00653 - $0.00959 by 2031 (contingent on successful technological upgrades and expanded use cases)
- Transformative scenario: Approaching $0.00959 (requiring exceptional market conditions, widespread adoption, and significant ecosystem breakthroughs)
- 2026-02-02: MV trading within the lower range as the market evaluates long-term potential and fundamental value proposition
| Year |
Predicted High Price |
Predicted Average Price |
Predicted Low Price |
Price Change |
| 2026 |
0.0045 |
0.00372 |
0.00227 |
0 |
| 2027 |
0.00431 |
0.00411 |
0.00267 |
9 |
| 2028 |
0.00627 |
0.00421 |
0.00362 |
12 |
| 2029 |
0.00707 |
0.00524 |
0.00304 |
39 |
| 2030 |
0.0069 |
0.00616 |
0.00585 |
64 |
| 2031 |
0.00959 |
0.00653 |
0.00333 |
74 |
IV. MV Professional Investment Strategy and Risk Management
MV Investment Methodology
(1) Long-term Holding Strategy
- Suitable for: Investors interested in GameFi ecosystem growth and metaverse development
- Operational Recommendations:
- Consider accumulating MV during market corrections when trading below recent averages
- Monitor GensoKishi platform development updates and user growth metrics
- Use Gate Web3 Wallet for secure storage of MV tokens on Polygon network
(2) Active Trading Strategy
- Technical Analysis Tools:
- Volume Analysis: Monitor the 24-hour trading volume (currently around $35,239) for liquidity assessment
- Price Range Tracking: Observe daily high/low ranges (recent: $0.003227-$0.003908) for entry/exit points
- Swing Trading Considerations:
- Track short-term volatility patterns, noting the -0.92% hourly and -0.66% daily changes
- Consider the low circulating supply ratio (19.03%) which may contribute to price volatility
MV Risk Management Framework
(1) Asset Allocation Principles
- Conservative Investors: 1-3% of crypto portfolio allocation
- Moderate Investors: 3-7% of crypto portfolio allocation
- Experienced Investors: Up to 10% of crypto portfolio allocation
(2) Risk Hedging Approaches
- Portfolio Diversification: Balance MV holdings with other gaming tokens and major cryptocurrencies
- Position Sizing: Limit exposure based on the token's relatively low market cap ($1.43M) and ranking (#2,279)
(3) Security Storage Solutions
- Hot Wallet Recommendation: Gate Web3 Wallet for active trading and staking participation
- Cold Storage Option: Hardware wallet solutions for long-term holdings exceeding personal risk thresholds
- Security Precautions: Verify the official Polygon contract address (0xa3c322ad15218fbfaed26ba7f616249f7705d945) before any transactions
V. MV Potential Risks and Challenges
MV Market Risks
- High Volatility: The token has experienced a -64.33% decline over the past year, reflecting significant market pressure
- Liquidity Concerns: With a 24-hour trading volume of approximately $35,239, large trades may face slippage
- Price Distance from ATH: Currently trading at $0.003749, representing a 99.77% decline from the all-time high of $1.66 (February 2022)
MV Regulatory Risks
- GameFi Regulatory Evolution: Gaming token regulations continue to develop globally, potentially affecting project operations
- NFT Compliance Requirements: Regulatory frameworks for NFT trading and ownership rights remain uncertain in various jurisdictions
- Cross-border Gaming Regulations: Multi-regional operations may face varying compliance requirements
MV Technical Risks
- Smart Contract Dependency: Platform functionality relies on Polygon network smart contract security and performance
- Gaming Platform Sustainability: Long-term success depends on continuous user engagement and content updates
- Token Utility Limitations: The effectiveness of MV as both a governance and in-game utility token depends on sustained player adoption
VI. Conclusion and Action Recommendations
MV Investment Value Assessment
MV presents opportunities for investors interested in the GameFi sector, backed by an established gaming title with a 13-year history. However, significant challenges exist, including substantial price decline from historical peaks, relatively low market capitalization, and limited trading volume. The token's value proposition centers on its dual role as a governance token and in-game utility within the GensoKishi ecosystem. Short-term risks include continued price volatility and market sentiment pressure, while long-term potential depends on successful user adoption and platform development.
MV Investment Recommendations
✅ Beginners: Start with small allocations (1-2% of crypto portfolio) and focus on understanding GameFi mechanics before investing
✅ Experienced Investors: Consider strategic accumulation during favorable market conditions while maintaining strict position limits
✅ Institutional Investors: Conduct thorough due diligence on platform metrics, user retention data, and competitive positioning within the GameFi sector
MV Trading Participation Methods
- Spot Trading: Purchase MV through Gate.com with USDT or other supported trading pairs
- Portfolio Integration: Add MV as part of a diversified GameFi sector allocation
- Platform Participation: Engage with the GensoKishi ecosystem to understand token utility firsthand
Cryptocurrency investment carries extremely high risks, and this article does not constitute investment advice. Investors should make prudent decisions based on their own risk tolerance and are advised to consult professional financial advisors. Never invest more than you can afford to lose.
FAQ
What are the main factors influencing MV price predictions?
MV price predictions are primarily influenced by supply mechanisms, macro-economic conditions, technological advancements, institutional and whale dynamics, market trends, and ecosystem development. These factors collectively shape price movements and market sentiment.
How to use technical analysis to predict MV price?
Analyze MV price trends and combine with technical indicators for cross-validation. Declining MV signals reduced market participation, potentially leading to price adjustments or drops.
What are the risks and limitations in MV price predictions?
MV price predictions face risks from behavioral biases, model overfitting, and market anomalies. They often fail to account for psychological factors affecting investor decisions and transaction volume fluctuations, limiting accuracy.
What is the accuracy benefit of historical data for MV price predictions?
Historical data significantly improves MV price prediction accuracy. The precision depends on data volume and quality. More comprehensive historical data enables more reliable forecasts for price trends and market movements.
What is the difference between short-term and long-term MV price prediction methods?
Short-term MV price prediction focuses on immediate market movements using real-time data and technical analysis, typically over hours to days. Long-term prediction analyzes broader market trends, adoption cycles, and macro factors over months to years for sustained growth potential.
* The information is not intended to be and does not constitute financial advice or any other recommendation of any sort offered or endorsed by Gate.