This comprehensive analysis examines RADAR token's 2026-2031 price trajectory through expert market forecasting. Currently trading at $0.0003045 with extreme market fear sentiment (index: 12), RADAR presents both opportunities and risks for cryptocurrency investors. The article evaluates historical price patterns, ecosystem development, macroeconomic factors, and institutional dynamics to provide tailored predictions for conservative, neutral, and optimistic scenarios. Predictions range from $0.00019 to $0.00067 through 2031, with detailed investment strategies for beginners through institutional participants. Key analysis covers DappRadar's decentralized application ecosystem, token distribution concentrated among top holders (84.3%), supply mechanisms, and regulatory considerations. Investment recommendations emphasize position sizing, portfolio diversification, secure storage via Gate Web3 Wallet, and risk management frameworks. The article concludes that RADAR's long-term value depends on platform adoptio
Introduction: RADAR's Market Position and Investment Value
DappRadar (RADAR), as the native token of the world's leading decentralized application store, has been tracking and ranking dApps across all protocols and verticals since its launch in 2021. As of 2026, RADAR maintains a market capitalization of approximately $464,609, with a circulating supply of around 1.53 billion tokens, and the price hovering at $0.0003045. This asset, recognized as a "dApp ecosystem governance and utility token," is playing an increasingly critical role in providing enhanced insights, early industry report access, and reward mechanisms for community contributors.
This article will comprehensively analyze RADAR's price trends from 2026 to 2031, combining historical patterns, market supply-demand dynamics, ecosystem development, and macroeconomic conditions to provide investors with professional price forecasts and practical investment strategies.
I. RADAR Price History Review and Market Status
RADAR Historical Price Evolution Trajectory
- 2021: RADAR reached a notable price point during December, with the token trading at higher levels during the early phase of the DappRadar ecosystem launch
- 2026: Market conditions led to significant price adjustments, with the token experiencing considerable volatility in the broader cryptocurrency market environment
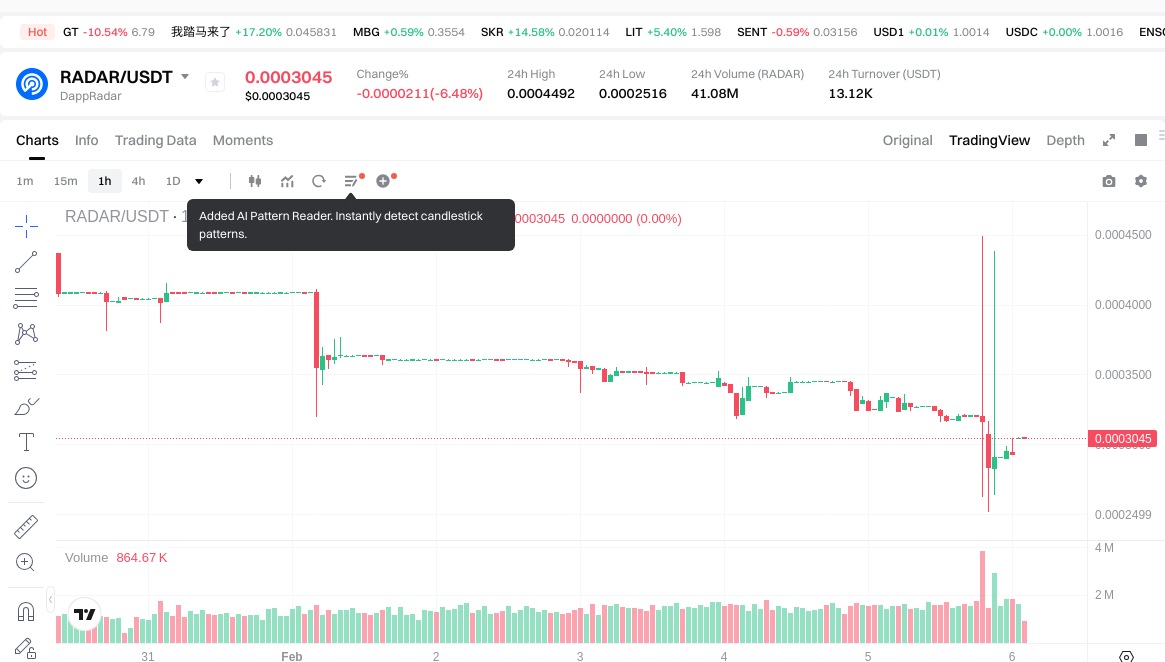
RADAR Current Market Situation
As of February 06, 2026, RADAR is trading at $0.0003045, representing a market capitalization of approximately $464,608. The token has experienced a 6.03% decline over the past 24 hours, with trading activity generating a volume of $13,101.98.
Over different time horizons, RADAR has shown varied performance metrics. The 1-hour period indicates a 3.71% increase, while the 7-day period reflects a 30.07% decrease. The 30-day performance shows a 37.13% decline, and the annual timeframe demonstrates a 91.64% decrease from previous levels.
The token's 24-hour trading range spans from $0.0002516 to $0.0004492. With a circulating supply of 1,525,808,338 RADAR tokens out of a maximum supply of 10,000,000,000, the current circulation represents approximately 15.26% of the total supply. The fully diluted market cap stands at $3,045,000.
RADAR maintains a market dominance of 0.00012% within the broader cryptocurrency ecosystem. The token is held by 13,623 addresses and is available for trading on cryptocurrency exchanges. The market sentiment indicator currently registers at level 1, suggesting a cautious trading environment. The current VIX reading of 12 corresponds to an "Extreme Fear" classification in market sentiment analysis.
RADAR operates as an ERC-20 token on the Ethereum blockchain, with the contract address 0x44709a920fCcF795fbC57BAA433cc3dd53C44DbE.
Click to view current RADAR market price
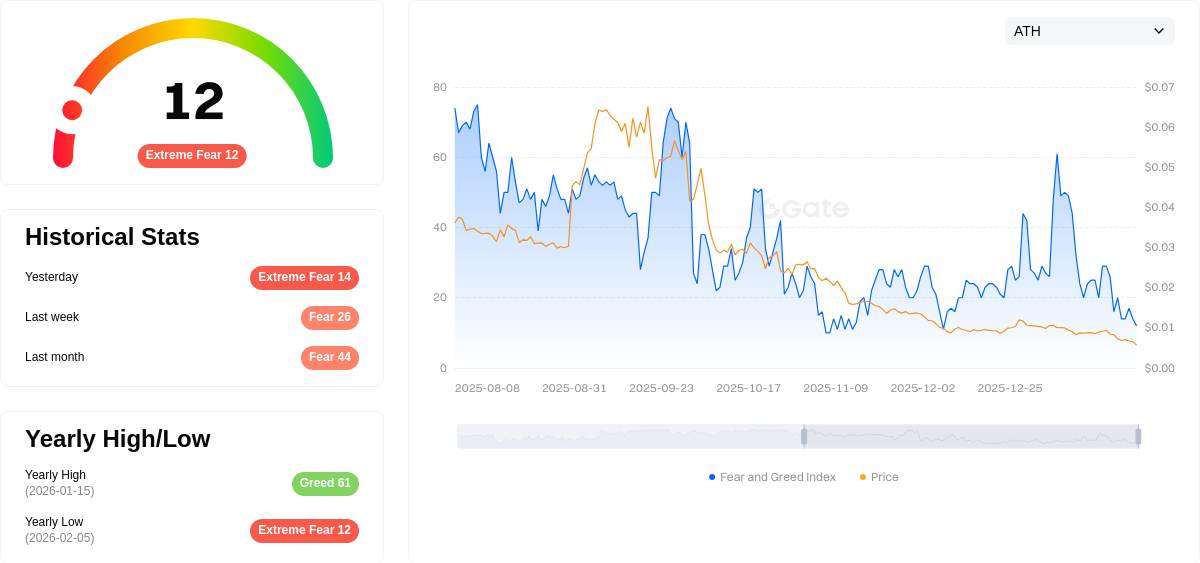
RADAR Market Sentiment Indicator
2026-02-05 Fear and Greed Index: 12 (Extreme Fear)
Click to view current Fear & Greed Index
The cryptocurrency market is experiencing extreme fear sentiment as the index plummets to 12. This historically low reading suggests significant market pessimism and potential capitulation among investors. Extreme fear typically presents contrarian opportunities, as markets often reverse sharply from such depressed levels. Investors should exercise caution while monitoring for potential accumulation opportunities. Risk-averse traders may consider defensive positions, while experienced investors might gradually build positions ahead of anticipated market recovery. Market dynamics remain highly volatile under current conditions.
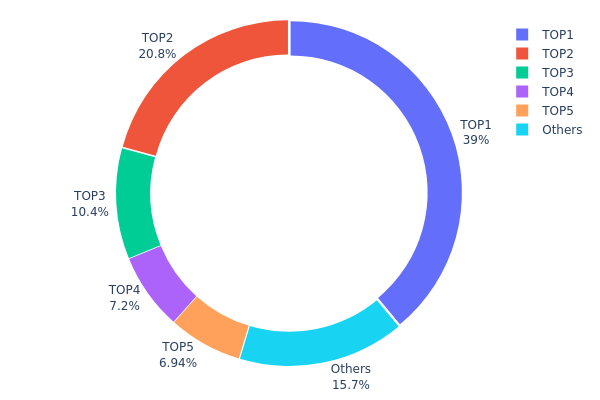
RADAR Holding Distribution
The holding distribution chart reveals the concentration of token ownership across different wallet addresses, serving as a crucial indicator of market structure and decentralization. Based on the current data, RADAR exhibits a highly concentrated holding pattern, with the top 5 addresses collectively controlling 84.3% of the total token supply. The largest address alone holds 38.97% (3,897,803.06K tokens), while the second and third largest addresses possess 20.77% and 10.42% respectively. This pronounced concentration suggests that a small number of entities maintain substantial control over the token's circulating supply.
Such a centralized distribution pattern carries significant implications for market dynamics. The dominance of top holders creates potential vulnerabilities to price manipulation, as large-scale selling from any major address could trigger substantial market volatility. Additionally, this concentration may limit genuine price discovery mechanisms, as trading activity becomes susceptible to the decisions of a few key players. The relatively modest 15.7% held by "Others" indicates limited retail participation and a narrow holder base, which typically correlates with reduced liquidity depth during market stress periods.
From a decentralization perspective, RADAR's current holding structure reflects weak on-chain governance distribution. While concentrated holdings may sometimes indicate institutional confidence or strategic reserve management, the extreme skew toward top addresses raises concerns about the token's resilience against coordinated market actions. Investors should carefully monitor any significant movements from these major addresses, as redistribution patterns could signal important shifts in market sentiment or fundamental project developments.
Click to view current RADAR Holding Distribution
| Top |
Address |
Holding Qty |
Holding (%) |
| 1 |
0x1117...40d911 |
3897803.06K |
38.97% |
| 2 |
0xe7dd...8778df |
2077724.40K |
20.77% |
| 3 |
0xfb22...55b6b9 |
1042275.85K |
10.42% |
| 4 |
0xc8d5...60db57 |
720450.09K |
7.20% |
| 5 |
0x4fde...e41ad1 |
694061.83K |
6.94% |
| - |
Others |
1567684.76K |
15.7% |
II. Core Factors Influencing RADAR's Future Price
Supply Mechanism
- Decentralized Trading Platform Token Distribution: RADAR operates as a token within decentralized trading ecosystems, where supply is typically governed by smart contract protocols and tokenomics structures.
- Historical Patterns: Price movements in decentralized exchange tokens have historically correlated with platform adoption rates and trading volume increases.
- Current Impact: The supply dynamics are influenced by token unlock schedules and circulation mechanisms inherent to the platform's design.
Institutional and Major Holder Dynamics
- Institutional Positioning: Information regarding specific institutional holdings of RADAR is limited in the provided materials.
- Enterprise Adoption: The decentralized trading platform model represents an emerging sector attracting attention from blockchain-focused entities.
- Regulatory Environment: Global regulatory frameworks for decentralized trading platforms continue to evolve, with varying approaches across jurisdictions impacting market confidence.
Macroeconomic Environment
- Monetary Policy Impact: Central bank policies regarding digital assets and blockchain technologies influence the broader cryptocurrency market sentiment.
- Inflation Hedge Characteristics: Decentralized trading platform tokens exhibit different risk-return profiles compared to traditional inflation hedges.
- Geopolitical Factors: Cross-border regulatory coordination and international policy developments affect decentralized finance (DeFi) platform operations.
Technological Development and Ecosystem Building
- Platform Competition: RADAR faces competition from established decentralized trading platforms, requiring continuous innovation to maintain market position.
- Regulatory Compliance: Evolving compliance requirements for decentralized platforms necessitate ongoing technological adaptations.
- Ecosystem Applications: The value proposition depends on user adoption, liquidity provision mechanisms, and integration with broader DeFi infrastructure.
Note: Specific technical upgrades, major partnerships, or detailed ecosystem projects were not available in the provided materials for comprehensive analysis.
III. 2026-2031 RADAR Price Prediction
2026 Outlook
- Conservative Prediction: $0.00019 - $0.00030
- Neutral Prediction: $0.00030 (average price scenario)
- Optimistic Prediction: $0.00034 (requires favorable market conditions and ecosystem expansion)
2027-2029 Outlook
- Market Stage Expectation: RADAR may enter a gradual growth phase as the project continues to develop its ecosystem and partnerships. This period could see moderate price appreciation driven by technological improvements and increased adoption.
- Price Range Predictions:
- 2027: $0.0002 - $0.00037 (projected 6% increase)
- 2028: $0.00018 - $0.00045 (projected 13% increase)
- 2029: $0.00033 - $0.00049 (projected 30% increase)
- Key Catalysts: ecosystem development, strategic partnerships, broader market recovery, and potential technological upgrades could serve as primary drivers for price movement during this period.
2030-2031 Long-term Outlook
- Base Scenario: $0.00034 - $0.0006 (assuming steady ecosystem growth and stable market conditions)
- Optimistic Scenario: $0.00039 - $0.00067 (assuming accelerated adoption and favorable regulatory environment)
- Transformative Scenario: Prices exceeding $0.00067 could materialize under exceptionally favorable conditions, including widespread institutional adoption and significant technological breakthroughs.
- 2026-02-06: RADAR trading within the predicted range, with market participants monitoring ecosystem developments and broader crypto market trends to assess future trajectory.
| Year |
Predicted High Price |
Predicted Average Price |
Predicted Low Price |
Price Change |
| 2026 |
0.00034 |
0.0003 |
0.00019 |
0 |
| 2027 |
0.00037 |
0.00032 |
0.0002 |
6 |
| 2028 |
0.00045 |
0.00035 |
0.00018 |
13 |
| 2029 |
0.00049 |
0.0004 |
0.00033 |
30 |
| 2030 |
0.0006 |
0.00044 |
0.00034 |
46 |
| 2031 |
0.00067 |
0.00052 |
0.00039 |
71 |
IV. RADAR Professional Investment Strategy and Risk Management
RADAR Investment Methodology
(I) Long-term Holding Strategy
- Suitable for: Investors seeking exposure to decentralized application ecosystem growth and those interested in governance participation
- Operational Recommendations:
- Consider establishing positions during market consolidation periods when volatility stabilizes
- Monitor DappRadar platform development milestones and ecosystem expansion metrics
- Utilize secure storage solutions such as Gate Web3 Wallet for asset custody
(II) Active Trading Strategy
- Technical Analysis Tools:
- Volume analysis: Monitor the relatively low 24-hour trading volume of approximately $13,101, which may indicate limited liquidity conditions
- Price range identification: Current 24-hour range between $0.0002516 and $0.0004492 provides reference points for short-term positioning
- Swing Trading Considerations:
- Be aware of potential price volatility given the recent 30-day decline of approximately 37%
- Consider the low circulating supply ratio of approximately 15.26% when evaluating trading depth
RADAR Risk Management Framework
(I) Asset Allocation Principles
- Conservative investors: Consider limiting RADAR allocation to 1-3% of cryptocurrency portfolio
- Moderate investors: May allocate 3-5% based on risk tolerance and market assessment
- Experienced investors: Could consider 5-10% allocation while maintaining diversification
(II) Risk Mitigation Approaches
- Portfolio diversification: Maintain exposure across multiple asset classes and cryptocurrency sectors
- Position sizing discipline: Implement predetermined entry and exit levels based on technical and fundamental analysis
(III) Secure Storage Solutions
- Web3 Wallet recommendation: Gate Web3 Wallet offers convenient access with security features
- Hardware storage option: Consider cold storage solutions for larger holdings intended for long-term investment
- Security precautions: Enable two-factor authentication, maintain secure backup procedures, and never share private keys or seed phrases
V. RADAR Potential Risks and Challenges
RADAR Market Risks
- Liquidity constraints: The relatively modest 24-hour trading volume may present challenges for larger position adjustments
- Price volatility: Recent performance shows significant price movements, with 7-day and 30-day declines exceeding 30%
- Market capitalization positioning: With a market cap of approximately $464,608 and ranking around 3071, RADAR operates in a highly competitive environment
RADAR Regulatory Risks
- Evolving regulatory landscape: Cryptocurrency regulations continue to develop across jurisdictions, potentially affecting token utility and trading availability
- Compliance considerations: Changes in regulatory frameworks may impact platform operations and token functionality
- Geographic restrictions: Regulatory developments could affect accessibility in certain regions
RADAR Technical Risks
- Smart contract dependencies: The token operates on Ethereum network infrastructure, inheriting associated technical considerations
- Platform development execution: Project success depends on continued platform development and user adoption metrics
- Competition dynamics: The decentralized application tracking and analytics sector includes multiple competing platforms
VI. Conclusion and Action Recommendations
RADAR Investment Value Assessment
RADAR represents exposure to the decentralized application analytics sector through DappRadar's ecosystem token. The project provides functionality related to governance participation and platform contribution rewards. Current market conditions reflect significant recent price adjustments, with the token trading considerably below historical levels. The relatively low circulating supply percentage of approximately 15.26% and modest trading volumes present both opportunities and considerations for potential participants. Long-term value proposition depends on platform adoption growth, ecosystem development, and sustained user engagement with DappRadar's analytics services.
RADAR Investment Recommendations
✅ Beginners: Consider starting with small position sizes to understand market dynamics, utilize educational resources about DappRadar platform functionality, and prioritize secure storage practices
✅ Experienced investors: May evaluate RADAR as a tactical allocation within broader cryptocurrency portfolios, considering recent price trends and liquidity conditions when sizing positions
✅ Institutional participants: Could assess RADAR within specialized digital asset strategies focused on Web3 infrastructure and analytics platforms, while conducting thorough due diligence on tokenomics and platform metrics
RADAR Trading Participation Methods
- Spot trading: Direct token purchases through cryptocurrency exchanges supporting RADAR trading pairs
- Gradual accumulation: Implement dollar-cost averaging approaches to build positions over time during various market conditions
- Platform engagement: Participate in DappRadar ecosystem activities to understand token utility and governance mechanisms
Cryptocurrency investment carries substantial risk, and this content does not constitute investment advice. Investors should make decisions carefully based on their own risk tolerance and are encouraged to consult professional financial advisors. Never invest more than you can afford to lose.
FAQ
What is the current price of RADAR token and how is its historical price trend?
As of February 5, 2026, RADAR token is trading at $0.002602. The token has shown stability with no price movement in the last 24 hours. Historical data indicates consistent performance in the market.
What are the main factors affecting RADAR price?
RADAR price is primarily influenced by adoption volume and order quantity. As adoption increases, prices are expected to decline. Technological advancements and market competition also play key roles in price movements.
RADAR代币未来价格预测和前景如何?
RADAR token shows strong market potential driven by growing trading volume and technological innovation. With expanding ecosystem adoption and increasing user engagement, the token is positioned for substantial price appreciation in the coming years.
What are the advantages and differences of RADAR compared to other cryptocurrencies?
RADAR focuses on specific market needs with faster transaction speeds and superior user experience. Its unique technology implementation and targeted approach differentiate it from mainstream cryptocurrencies, offering distinct value propositions for users.
What risks should I pay attention to when investing in RADAR tokens?
RADAR token prices are highly volatile and subject to market fluctuations. Investors should thoroughly assess their risk tolerance before participating. The crypto market carries inherent risks including liquidity challenges and regulatory uncertainties.
* The information is not intended to be and does not constitute financial advice or any other recommendation of any sort offered or endorsed by Gate.