This comprehensive analysis explores Taxa Network (TXT) token's price trajectory from 2026 through 2031, combining historical patterns with market dynamics. TXT, a privacy-focused blockchain infrastructure with TEE capabilities, currently trades at $0.0004961 with $310,062 market capitalization. The article examines critical factors influencing price movements, including unlimited supply mechanics, market sentiment indicators showing extreme fear, and concentrated holding patterns. Expert forecasts range from conservative estimates of $0.00037-$0.00050 in 2026 to transformational scenarios reaching $0.00133 by 2031. Investment strategies include long-term holding approaches and active trading methodologies with risk management frameworks suitable for different investor profiles. The analysis addresses significant risks including volatility, limited liquidity, and regulatory uncertainties. Through Gate exchange platform recommendations and strategic positioning advice, this guide equips investors with actionab
Introduction: TXT's Market Position and Investment Value
Taxa Network (TXT), positioned as a high-performance blockchain infrastructure with Trusted Execution Environment (TEE) capabilities and multi-blockchain protocol compatibility, has been advancing its mission since its launch in 2021. As of 2026, TXT maintains a market capitalization of approximately $310,062, with a circulating supply of 625 million tokens and a current price around $0.0004961. This asset, characterized as a "privacy-focused middleware solution," is playing an increasingly vital role in decentralized applications requiring enhanced performance and confidentiality across sectors including DeFi, AI, gaming, identity verification, and healthcare.
This article will comprehensively analyze TXT's price trajectory from 2026 to 2031, combining historical patterns, market supply-demand dynamics, ecosystem development, and macroeconomic conditions to provide investors with professional price forecasts and practical investment strategies.
I. TXT Price History Review and Current Market Status
TXT Historical Price Evolution Trajectory
- September 2021: TXT reached a notable price level of $0.02675211, representing a significant milestone in its early trading history
- March 2025: The token experienced a considerable decline, touching $0.00026597 during a period of market adjustment
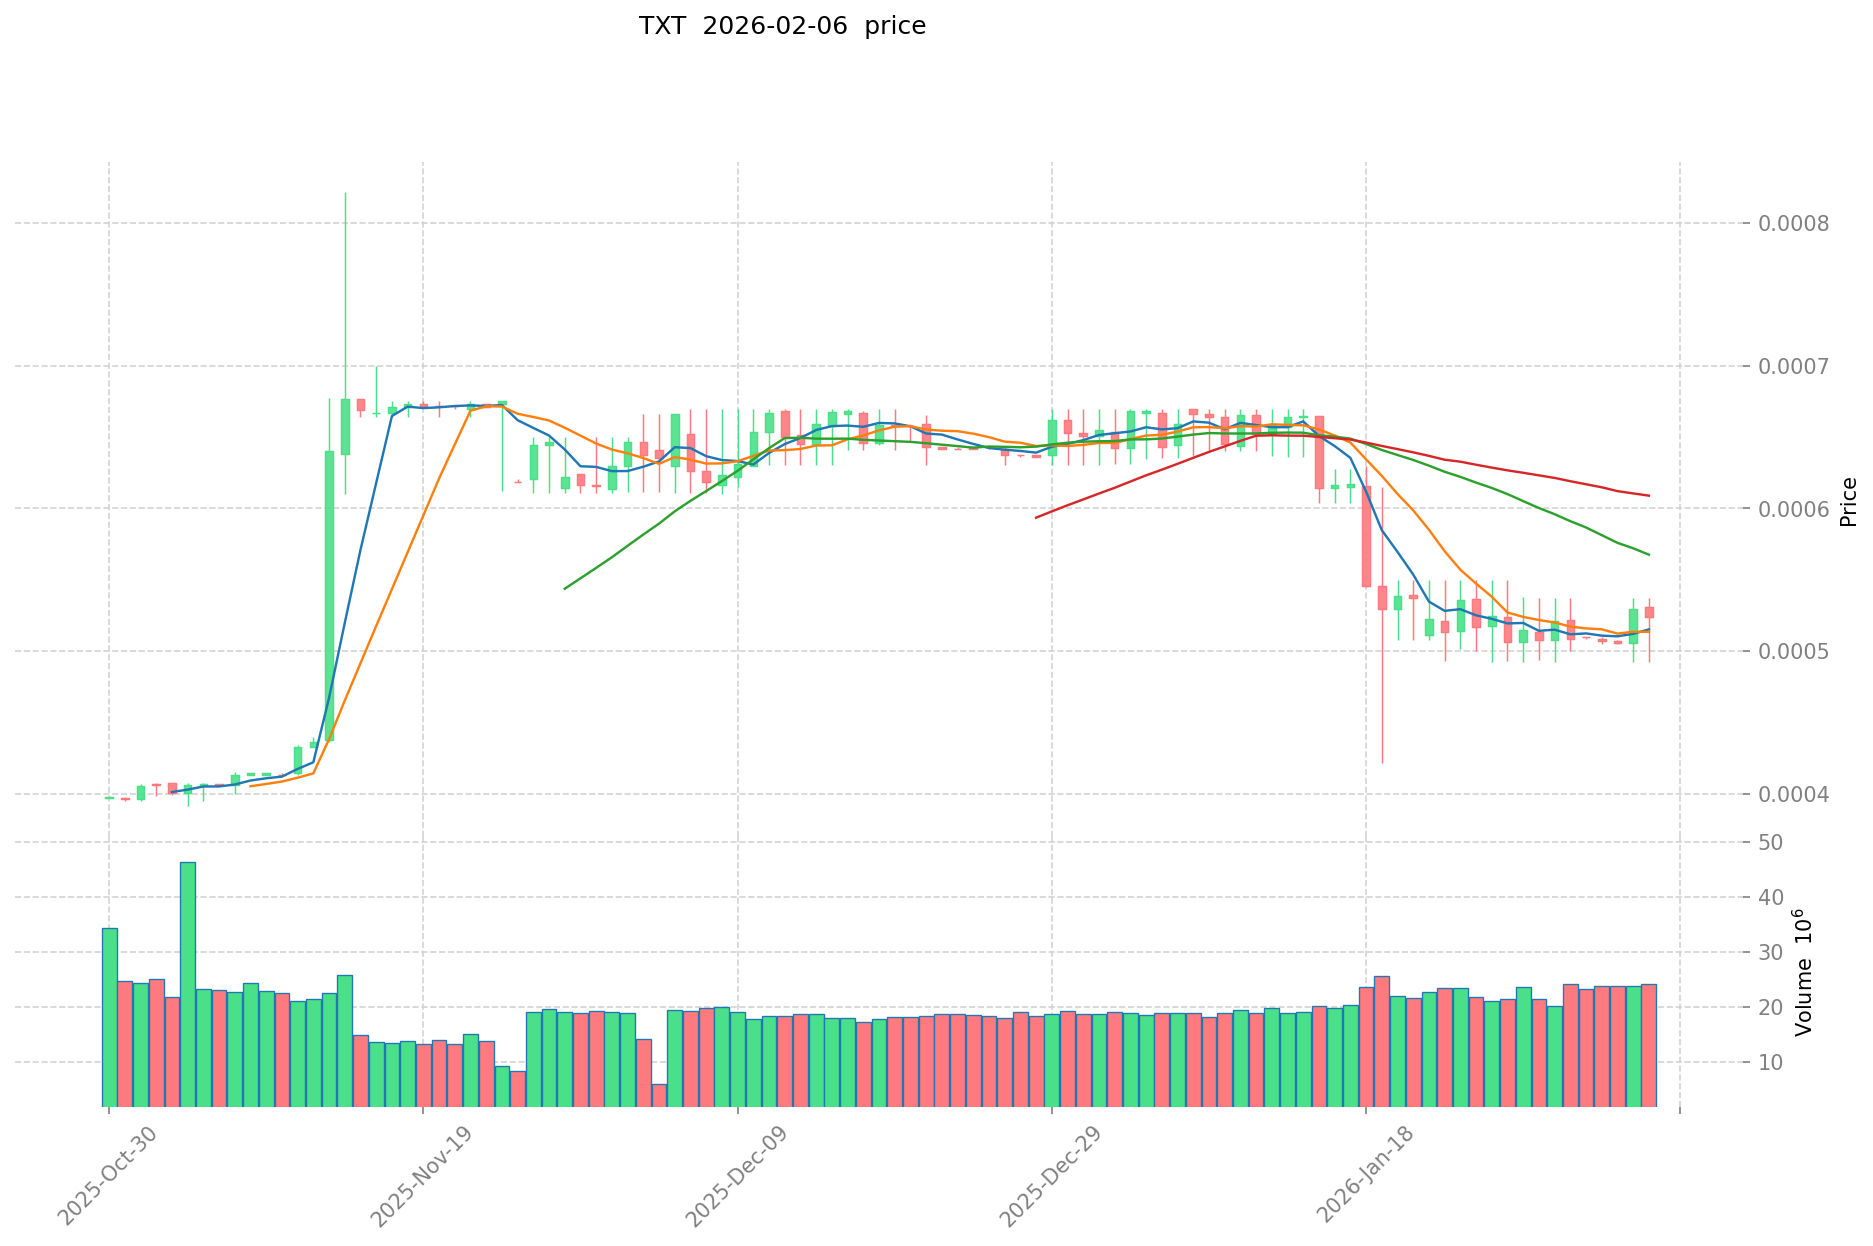
- 2025-2026: The token underwent substantial volatility, with prices fluctuating between extreme levels as market conditions evolved
TXT Current Market Situation
As of February 7, 2026, TXT is trading at $0.0004961, showing mixed short-term performance indicators. The token has experienced a decline of 6.12% over the past hour and 4.93% over the past 24 hours, with a 24-hour trading volume of $18,742.74. The recent 7-day performance shows a decrease of 4.55%, while the 30-day trend indicates a more pronounced decline of 25.53%.
The current market capitalization stands at $310,062.50, with a circulating supply of 625,000,000 TXT tokens out of a total supply of 10,000,000,000. This represents a circulation ratio of 6.25%. The fully diluted market cap is calculated at $4,961,000. The token's market dominance remains at 0.00019%, reflecting its position within the broader cryptocurrency ecosystem.
TXT's 24-hour price range has fluctuated between a low of $0.0004922 and a high of $0.000537, indicating active trading dynamics. The token is currently trading significantly below its previous peak from September 2021, representing a substantial distance from that level. The current holder count stands at 396 participants.
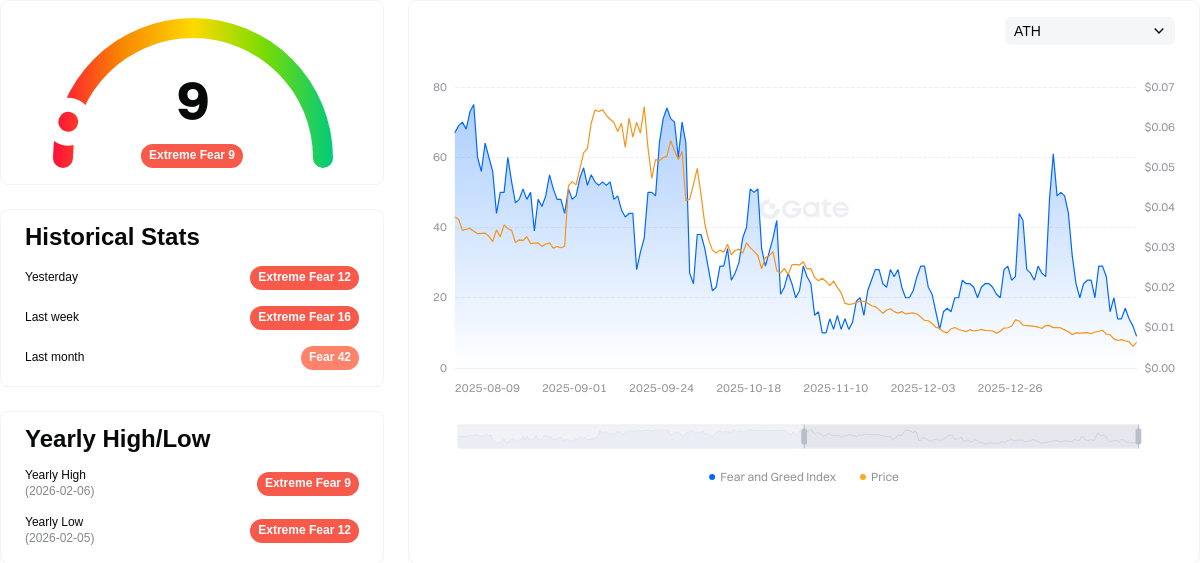
The Fear and Greed Index for the broader market registers at 9, indicating an "Extreme Fear" sentiment, which may be influencing trading patterns across various digital assets including TXT.
Click to view current TXT market price
TXT Market Sentiment Indicator
2026-02-06 Fear and Greed Index: 9 (Extreme Fear)
Click to view the current Fear & Greed Index
The cryptocurrency market is currently experiencing extreme fear, with the Fear and Greed Index hitting just 9 points. This historically low reading suggests investors are highly risk-averse and pessimistic about market conditions. Such extreme fear levels often present contrarian opportunities, as panic-driven sell-offs may create favorable entry points for long-term investors. However, caution remains advised until market sentiment stabilizes and broader indicators show recovery signs.
TXT Holding Distribution
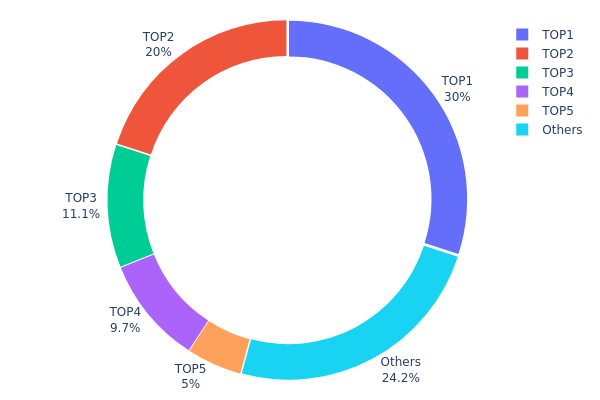
The holding distribution chart illustrates the concentration of token ownership across different wallet addresses, revealing the degree of decentralization within the network. This metric serves as a crucial indicator for assessing market structure stability and potential risks associated with concentrated holdings.
Based on the current data, TXT demonstrates a notably concentrated holding pattern. The top five addresses collectively control 75.79% of the total supply, with the largest single address holding 30.00% (3,000,000K tokens) and the second-largest possessing 20.00% (2,000,000K tokens). This level of concentration suggests that a relatively small number of entities maintain substantial control over the token's circulating supply, which deviates significantly from an ideal decentralized distribution model.
Such concentrated holdings present both structural and market implications. From a volatility perspective, large holders possess considerable influence over price movements, as significant sell-offs from any of the top addresses could trigger substantial market fluctuations. Additionally, this concentration pattern increases susceptibility to potential market manipulation scenarios, where coordinated actions by major holders could artificially impact trading dynamics. The remaining 24.21% distributed among other addresses indicates limited retail participation relative to whale dominance, which may constrain organic market development and trading liquidity depth.
Click to view current TXT Holding Distribution
| Top |
Address |
Holding Qty |
Holding (%) |
| 1 |
0x5cec...cf698d |
3000000.00K |
30.00% |
| 2 |
0x2b2a...f251a7 |
2000000.00K |
20.00% |
| 3 |
0x1caa...2cc017 |
1110000.00K |
11.10% |
| 4 |
0x78f6...714a13 |
969555.56K |
9.69% |
| 5 |
0x18e1...833887 |
500000.00K |
5.00% |
| - |
Others |
2420444.44K |
24.21% |
II. Core Factors Influencing TXT's Future Price
Supply Mechanism
- Unlimited Supply Model: TXT adopts an unlimited maximum supply mechanism, differing from traditional scarcity-based crypto assets. Currently, only 6.25% (625 million out of 10 billion) of tokens are in circulation.
- Historical Pattern: The token economics model features gradual release schedules that historically impact market liquidity and price discovery mechanisms.
- Current Impact: Future token releases under the unlimited supply framework may exert downward pressure on prices if demand growth fails to match the expanding circulating supply.
Market Supply and Demand Dynamics
- Circulation Ratio: With merely 6.25% of total supply currently circulating, subsequent token unlocks represent a significant factor in price trajectory assessment.
- Demand Drivers: Project ecosystem development and adoption rates will determine whether demand can absorb incoming supply effectively.
- Market Sentiment: Investor confidence levels, shaped by project progress and market conditions, play a crucial role in price formation.
Macroeconomic Environment
- Monetary Policy Influence: Central bank policies, interest rate adjustments, and liquidity conditions in major economies affect risk asset valuations, including cryptocurrencies.
- Market Cycles: Broader cryptocurrency market trends and cycles influence individual token performance, with bull markets typically providing tailwinds for price appreciation.
- Global Economic Conditions: Economic growth rates, inflation trends, and financial market stability create the backdrop against which digital assets trade.
Project Ecosystem Development
- Technical Progress: Ongoing development of Taxa Network's infrastructure and technology foundations supports long-term value proposition.
- Adoption Metrics: Growth in user base, transaction volumes, and real-world applications serves as fundamental drivers of sustainable demand.
- Competitive Positioning: The project's ability to differentiate itself and capture market share within its sector influences investment appeal and price potential.
III. 2026-2031 TXT Price Forecast
2026 Outlook
- Conservative forecast: $0.00037 - $0.00050
- Neutral forecast: $0.00050 (average estimate)
- Optimistic forecast: $0.00071 (requiring favorable market conditions and increased adoption)
2027-2029 Mid-term Outlook
- Market stage expectation: TXT is anticipated to enter a gradual growth phase, with potential expansion in utility and ecosystem development driving moderate price appreciation.
- Price range forecast:
- 2027: $0.0005 - $0.00074 (approximately 21% increase from 2026 baseline)
- 2028: $0.0004 - $0.00076 (34% cumulative growth potential)
- 2029: $0.00053 - $0.00103 (43% growth trajectory)
- Key catalysts: Enhanced platform integration, expanded user base, potential partnerships, and broader cryptocurrency market recovery cycles could serve as primary price drivers during this period.
2030-2031 Long-term Outlook
- Baseline scenario: $0.00079 - $0.00087 (assuming steady ecosystem growth and maintained market interest)
- Optimistic scenario: $0.00087 - $0.00093 in 2030 (contingent on significant adoption milestones and favorable regulatory environment)
- Transformational scenario: $0.00062 - $0.00133 in 2031 (under exceptionally favorable conditions including major platform upgrades, strategic partnerships, or breakthrough use cases, representing up to 81% growth potential)
- 2026-02-07: TXT is positioned at the beginning of its forecast period, with current price levels expected to establish a foundation for potential multi-year appreciation.
| Year |
Predicted High Price |
Predicted Average Price |
Predicted Low Price |
Price Change |
| 2026 |
0.00071 |
0.0005 |
0.00037 |
0 |
| 2027 |
0.00074 |
0.0006 |
0.0005 |
21 |
| 2028 |
0.00076 |
0.00067 |
0.0004 |
34 |
| 2029 |
0.00103 |
0.00071 |
0.00053 |
43 |
| 2030 |
0.00093 |
0.00087 |
0.00079 |
75 |
| 2031 |
0.00133 |
0.0009 |
0.00062 |
81 |
IV. TXT Professional Investment Strategies and Risk Management
TXT Investment Methodology
(1) Long-term Holding Strategy
- Target Investors: Investors who believe in blockchain infrastructure development and privacy-preserving computing solutions
- Operational Recommendations:
- Build positions gradually when market volatility is relatively low, avoiding concentrated large purchases
- Monitor project development progress, particularly updates in TEE technology implementation and multi-chain compatibility
- Utilize secure storage solutions such as Gate Web3 Wallet to ensure asset safety
(2) Active Trading Strategy
- Technical Analysis Tools:
- Moving Averages: Observe 7-day and 30-day moving averages to identify potential trend reversals, especially given the recent 25.53% decline over 30 days
- Volume Analysis: Monitor daily trading volume (currently around $18,742) for unusual activity that may signal significant price movements
- Swing Trading Considerations:
- Set stop-loss levels at 8-10% below entry price to manage downside risk
- Consider taking partial profits during short-term rebounds given recent price volatility
TXT Risk Management Framework
(1) Asset Allocation Principles
- Conservative Investors: 1-2% of cryptocurrency portfolio
- Aggressive Investors: 3-5% of cryptocurrency portfolio
- Professional Investors: Up to 5-8% of cryptocurrency portfolio with active hedging strategies
(2) Risk Hedging Solutions
- Portfolio Diversification: Balance TXT holdings with established infrastructure tokens and stablecoins
- Position Sizing: Limit individual position size based on the low liquidity reflected in daily trading volume
(3) Secure Storage Solutions
- Hot Wallet Recommendation: Gate Web3 Wallet for active trading needs with convenient access
- Cold Storage Option: Hardware wallet solutions for long-term holdings exceeding short-term trading requirements
- Security Precautions: Enable two-factor authentication, regularly verify wallet addresses before transactions, and never share private keys or seed phrases
V. TXT Potential Risks and Challenges
TXT Market Risks
- High Volatility: Recent price performance shows significant fluctuations, with a 30-day decline of 25.53% and 1-year decline of 30%
- Limited Liquidity: Daily trading volume of approximately $18,742 may result in slippage during larger transactions
- Low Market Capitalization: With a market cap of only $310,062, the token is susceptible to price manipulation and extreme volatility
TXT Regulatory Risks
- Privacy Technology Scrutiny: TEE-based privacy solutions may face increased regulatory examination as governments worldwide establish frameworks for privacy-preserving technologies
- Cross-chain Compliance: Multi-blockchain compatibility may create complex regulatory obligations across different jurisdictions
- Uncertain Classification: Middleware infrastructure tokens may face evolving regulatory classifications that could impact trading and usage
TXT Technical Risks
- Smart Contract Vulnerabilities: The tServices architecture may contain undiscovered security flaws that could be exploited
- TEE Implementation Challenges: Trusted Execution Environment technology faces ongoing scrutiny regarding hardware-level security assumptions
- Competition Risk: The privacy-preserving smart contract space includes numerous competing solutions that may offer superior technology or adoption
VI. Conclusion and Action Recommendations
TXT Investment Value Assessment
Taxa Network presents an interesting value proposition as middleware infrastructure focused on privacy-preserving, high-performance smart contracts through TEE technology. The project targets growing sectors including DeFi, AI, gaming, and healthcare. However, investors should carefully weigh the long-term potential against significant short-term risks, including substantial recent price declines (25.53% over 30 days, 30% over 1 year), extremely low liquidity, and a limited circulating supply of only 6.25% of total supply. The token's very low market capitalization and trading volume suggest it remains a highly speculative asset suitable only for risk-tolerant investors.
TXT Investment Recommendations
✅ Beginners: Consider avoiding TXT until demonstrating more stable price action and increased liquidity; focus on learning about blockchain infrastructure and privacy technologies first
✅ Experienced Investors: Limit allocation to 1-3% of cryptocurrency portfolio; conduct thorough due diligence on technical developments and only invest amounts affordable to lose completely
✅ Institutional Investors: Assess strategic fit with privacy-preserving computing thesis; consider pilot allocation with strict risk parameters and ongoing project evaluation
TXT Trading Participation Methods
- Spot Trading: Purchase TXT through Gate.com with careful attention to order book depth and potential slippage
- Dollar-Cost Averaging: Accumulate positions gradually over time to mitigate entry price risk in volatile markets
- Active Monitoring: Track project development updates, partnership announcements, and technical implementation progress before making investment decisions
Cryptocurrency investment carries extremely high risk, and this article does not constitute investment advice. Investors should make prudent decisions based on their own risk tolerance and are advised to consult professional financial advisors. Never invest more than you can afford to lose.
FAQ
What is TXT token? What are its main uses and sources of value?
TXT token is a cryptocurrency designed for market trading and ecosystem incentives. Its value derives from platform utility, transaction volume, community adoption, and market demand dynamics in the web3 space.
What are the main factors affecting TXT token price?
TXT token price is primarily influenced by market demand, supply volume, investor sentiment, and market trends. Trading volume and major news announcements significantly impact price movements.
How is the price prediction for TXT token in 2024-2025?
TXT token price prediction for 2025 is estimated between $0.015926 and $0.03032. These projections are based on market trend analysis and historical data patterns in the cryptocurrency sector.
How to conduct TXT token price prediction analysis? What are the technical and fundamental indicators?
Use technical indicators like moving averages, RSI, and MACD to analyze TXT price trends. Monitor trading volume and price momentum. Combine technical analysis with fundamental metrics such as project development, adoption rate, and market sentiment for comprehensive prediction.
What are the advantages and risks of TXT token compared to other similar tokens?
TXT offers emerging market potential with higher growth prospects compared to mature alternatives like FIL. Its advantages include innovative technology and early adoption opportunities. However, risks include market volatility, lower liquidity, and regulatory uncertainties. FIL provides greater stability for conservative investors, while TXT suits aggressive traders seeking exponential returns in the growing decentralized storage sector.
What risk factors should I consider when investing in TXT tokens?
Key risks include market volatility, regulatory changes, and project execution uncertainty. Assess your risk tolerance, diversify your portfolio, and conduct thorough research before investing.
* The information is not intended to be and does not constitute financial advice or any other recommendation of any sort offered or endorsed by Gate.