ARCA vs DYDX: A Comprehensive Comparison of Two Leading Decentralized Exchange Protocols

Introduction: Investment Comparison Between ARCA and DYDX
In the cryptocurrency market, the comparison between ARCA vs DYDX has become a topic of interest for investors. These two assets differ significantly in market capitalization ranking, application scenarios, and price performance, representing distinct positioning within the crypto asset landscape.
Legend of Arcadia (ARCA): Launched in 2024, this card-based RPG game token has carved out a niche in the blockchain gaming sector, enabling players to engage in immersive PvP gameplay and trade composable NFTs on mobile devices.
dYdX (DYDX): Originating in 2021, this governance token powers a decentralized derivatives trading protocol, facilitating margin trading and perpetual contracts with off-chain order matching and on-chain settlement.
This article will examine the investment value comparison between ARCA vs DYDX through the lens of historical price trends, supply mechanisms, institutional adoption, technological ecosystems, and future projections, attempting to address investors' primary concern:
"Which asset presents more compelling characteristics for consideration?"
I. Historical Price Comparison and Current Market Status
Historical Price Trends of ARCA (Coin A) and DYDX (Coin B)
- 2024: ARCA reached its all-time high of $0.095 on November 4, 2024, shortly after its initial listing.
- 2024: DYDX experienced significant price movement, reaching its all-time high of $4.52 on March 8, 2024.
- Comparative Analysis: During the recent market cycle, ARCA declined from $0.095 to $0.00485, while DYDX dropped from $4.52 to $0.122242, representing a more substantial percentage decline for DYDX.
Current Market Status (February 5, 2026)
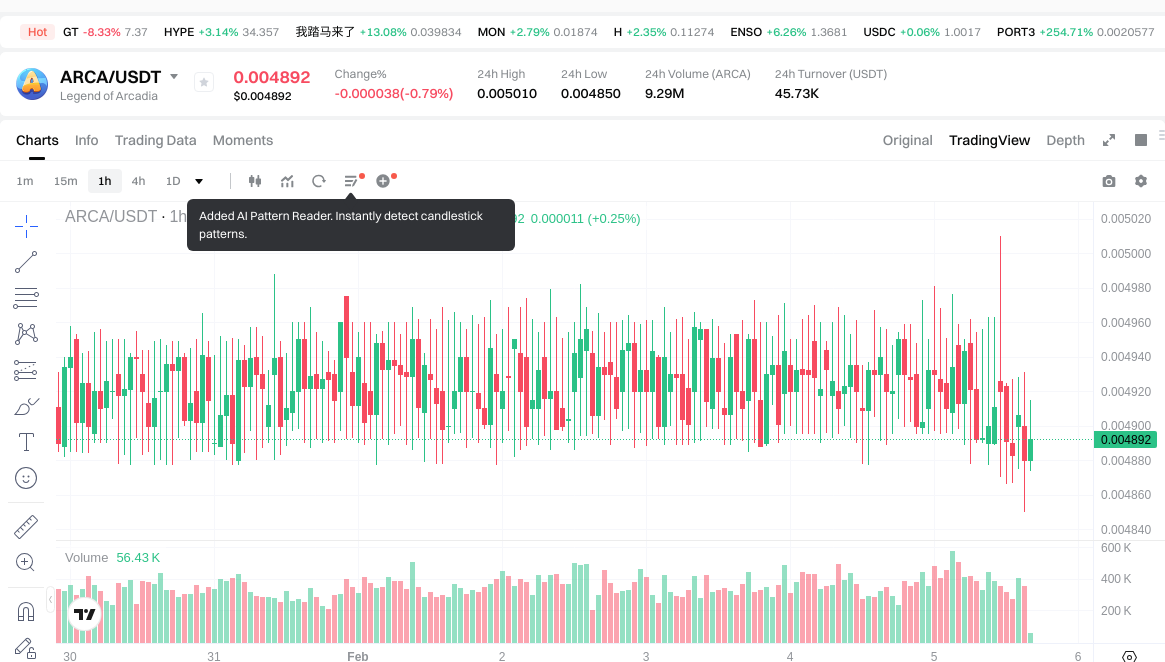
- ARCA Current Price: $0.004912
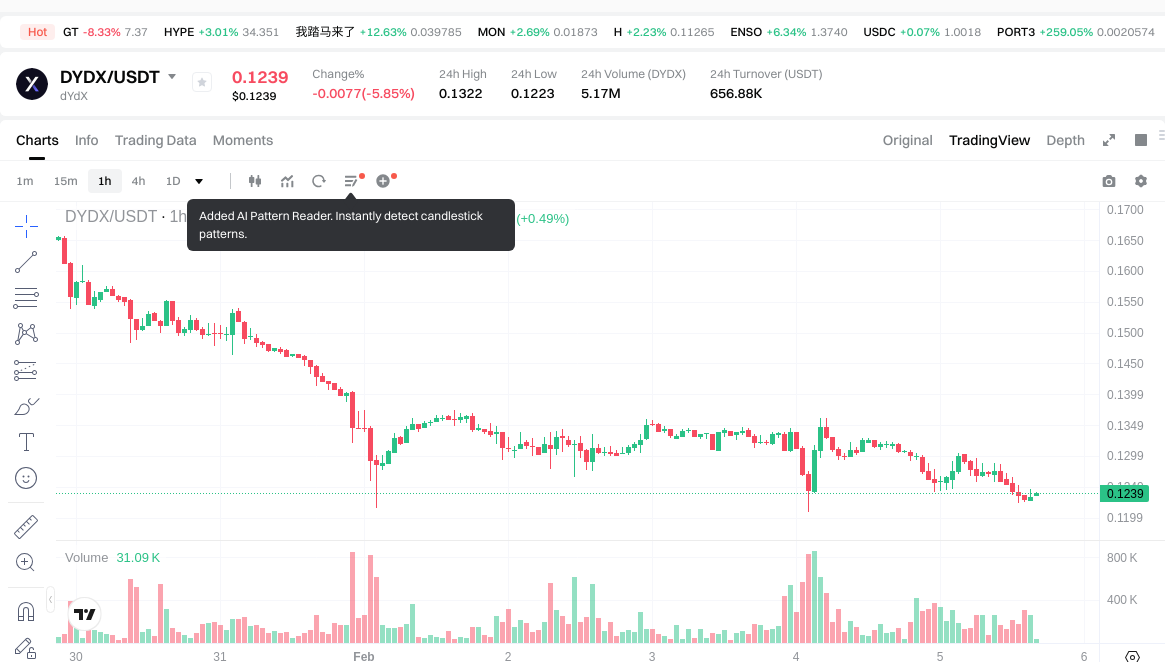
- DYDX Current Price: $0.1233
- 24-Hour Trading Volume: ARCA $45,767.22 vs DYDX $655,195.64
- Market Sentiment Index (Fear & Greed Index): 12 (Extreme Fear)
View real-time prices:
- View ARCA current price Market Price
- View DYDX current price Market Price
II. Core Factors Influencing ARCA vs DYDX Investment Value
Supply Mechanism Comparison (Tokenomics)
-
ARCA: Available reference materials do not provide specific information about ARCA's supply mechanism or tokenomics model. Without verified data on total supply, issuance schedule, or economic design, it is not possible to characterize its supply structure.
-
DYDX: DYDX operates under a staking-based model where token holders can stake to secure the Cosmos-based application chain and earn transaction fee rewards proportional to their staked amount. The token serves dual functions: network security through staking and governance rights for protocol development. Token holders can delegate their DYDX to validators in exchange for a portion of earned rewards. Under current activity levels, the chain generates over $43 million in annualized fees for validators.
-
📌 Historical Pattern: For DYDX, the migration to its own Cosmos chain in November 2023 represented a structural shift that enhanced tokenomics by enabling direct fee distribution to stakers—a mechanism difficult to reverse and more sustainable than team-operated revenue sharing systems. This design creates a linear relationship between token ownership and yield generation.
Institutional Adoption and Market Application
-
Institutional Holdings: Reference materials mention that activist investors, including Arca (a crypto hedge fund), have shown interest in governance token opportunities where they can influence protocol direction or unlock value from treasury assets. However, specific institutional holdings data for either ARCA or DYDX tokens is not provided in the available materials.
-
Enterprise Adoption: DYDX operates as a decentralized derivatives exchange offering perpetual contract trading across 66 trading pairs (as of June 2024). Its upgrade to v4 significantly improved the token economic model through changes to governance processes, token utility, and revenue accrual methods. The materials do not contain information about ARCA's enterprise adoption or specific use cases in cross-border payments, settlement, or investment portfolios.
-
National Policy: The reference materials discuss general governance token frameworks and regulatory considerations but do not provide specific comparative analysis of different countries' regulatory stances toward ARCA or DYDX individually.
Technical Development and Ecosystem Building
-
ARCA Technical Upgrades: The available materials do not contain specific information about ARCA's technical development roadmap, protocol upgrades, or ecosystem initiatives.
-
DYDX Technical Development: In November 2023, dYdX upgraded to v4, which included migration from an Ethereum-based rollup to its own Cosmos application chain. This migration was driven partly by superior decentralization through a distributed PoS validator set, reducing regulatory risks associated with centralized sequencers and enabling direct protocol-level revenue distribution to token holders. Token holders can propose and vote on initiatives directly affecting the chain's development direction, including introduction of new perpetual contract markets, trading incentive programs, foundation funding, and technical upgrades. All successfully voted proposals are executed on-chain.
-
Ecosystem Comparison: For DYDX, the technical migration to Cosmos represents significant ecosystem infrastructure development. The materials note that strong control and reliability in governance frameworks—exemplified by dYdX—create more sustainable investment narratives. However, specific comparative data on DeFi integration, NFT ecosystems, payment applications, or smart contract deployment between ARCA and DYDX is not available in the reference materials.
Macroeconomic Environment and Market Cycles
-
Performance in Inflationary Environments: The reference materials do not provide specific analysis comparing ARCA and DYDX performance characteristics under different inflation scenarios or their relative anti-inflation properties.
-
Macroeconomic Monetary Policy: While the materials discuss general market conditions affecting crypto assets in Q3 2023—including declining trading volumes (down 20.2% for centralized exchanges compared to Q2) and overall market cap decline of approximately 10%—they do not offer specific comparative analysis of how interest rates, US dollar index movements, or monetary policy shifts differentially impact ARCA versus DYDX.
-
Geopolitical Factors: The reference materials mention general regulatory developments and legal proceedings affecting governance tokens but do not provide comparative analysis of how cross-border transaction demand, international situations, or geopolitical factors specifically influence ARCA and DYDX investment value differently.
III. 2026-2031 Price Prediction: ARCA vs DYDX
Short-term Forecast (2026)
- ARCA: Conservative $0.004753 - $0.0049 | Optimistic $0.0049 - $0.00686
- DYDX: Conservative $0.085698 - $0.1242 | Optimistic $0.1242 - $0.14283
Mid-term Forecast (2028-2029)
- ARCA may enter a gradual growth phase, with projected price range of $0.004618152 - $0.0102771375
- DYDX may enter a moderate expansion phase, with projected price range of $0.090763497 - $0.1663997445
- Key drivers: institutional capital inflows, ETF developments, ecosystem expansion
Long-term Forecast (2030-2031)
- ARCA: Baseline scenario $0.006474596625 - $0.01003562476875 | Optimistic scenario $0.0108218257875 - $0.010336693511812
- DYDX: Baseline scenario $0.10800856143 - $0.18663244070625 | Optimistic scenario $0.2144287616625 - $0.242622172918125
Disclaimer
ARCA:
| Year | Predicted High Price | Predicted Average Price | Predicted Low Price | Price Change |
|---|---|---|---|---|
| 2026 | 0.00686 | 0.0049 | 0.004753 | 0 |
| 2027 | 0.0081144 | 0.00588 | 0.0046452 | 19 |
| 2028 | 0.00944622 | 0.0069972 | 0.004618152 | 42 |
| 2029 | 0.0102771375 | 0.00822171 | 0.0071528877 | 67 |
| 2030 | 0.0108218257875 | 0.00924942375 | 0.006474596625 | 88 |
| 2031 | 0.010336693511812 | 0.01003562476875 | 0.007827787319625 | 104 |
DYDX:
| Year | Predicted High Price | Predicted Average Price | Predicted Low Price | Price Change |
|---|---|---|---|---|
| 2026 | 0.14283 | 0.1242 | 0.085698 | 0 |
| 2027 | 0.1415259 | 0.133515 | 0.10814715 | 8 |
| 2028 | 0.16502454 | 0.13752045 | 0.099014724 | 11 |
| 2029 | 0.1663997445 | 0.151272495 | 0.090763497 | 22 |
| 2030 | 0.2144287616625 | 0.15883611975 | 0.10800856143 | 28 |
| 2031 | 0.242622172918125 | 0.18663244070625 | 0.147439628157937 | 51 |
IV. Investment Strategy Comparison: ARCA vs DYDX
Long-term vs Short-term Investment Strategies
-
ARCA: May appeal to investors interested in blockchain gaming ecosystems and NFT composability, particularly those seeking exposure to emerging gaming-focused tokens with lower entry price points. The token's application in card-based RPG gameplay represents a specific niche within the broader crypto gaming sector.
-
DYDX: May appeal to investors focused on decentralized derivatives infrastructure and governance participation. The token's staking mechanism provides ongoing yield opportunities tied to protocol trading activity, potentially suited for those seeking utility-backed assets with established product-market fit in the derivatives trading segment.
Risk Management and Asset Allocation
-
Conservative Investors: A conservative approach might consider ARCA 20-30% vs DYDX 70-80%, reflecting DYDX's more established protocol infrastructure and revenue-generating mechanisms through staking rewards. Conservative positioning would emphasize DYDX's governance utility and fee distribution model.
-
Aggressive Investors: An aggressive approach might consider ARCA 40-50% vs DYDX 50-60%, incorporating higher exposure to ARCA's gaming sector positioning while maintaining significant allocation to DYDX's derivatives infrastructure. This allocation reflects tolerance for gaming sector volatility alongside established DeFi protocols.
-
Hedging Tools: Portfolio construction may incorporate stablecoin allocations (15-25% of crypto portfolio), options strategies where available, and cross-asset diversification across different blockchain sectors (gaming, DeFi, infrastructure) to mitigate concentration risk.
V. Potential Risk Comparison
Market Risk
-
ARCA: Faces market risks associated with blockchain gaming sector volatility, including shifts in player engagement patterns, competition from alternative gaming tokens, and broader sentiment toward play-to-earn models. The relatively lower 24-hour trading volume ($45,767.22) may present liquidity challenges during market stress periods.
-
DYDX: Subject to market risks tied to derivatives trading volume fluctuations, competition from centralized exchanges and alternative decentralized derivatives platforms, and sensitivity to broader DeFi sector sentiment. Trading volume concentration and validator participation rates may impact token utility and staking yields.
Technical Risk
-
ARCA: Technical considerations include scalability of the gaming platform under increased user load, network stability for real-time PvP gameplay, and ongoing development requirements for NFT composability features. The reference materials do not provide detailed technical architecture information.
-
DYDX: Following migration to Cosmos-based chain architecture, technical risks include validator set decentralization patterns, potential consensus mechanism vulnerabilities, cross-chain bridge security for asset transfers, and ongoing maintenance of off-chain order matching infrastructure. The November 2023 v4 upgrade introduced new technical dependencies requiring sustained development support.
Regulatory Risk
-
The regulatory landscape may affect ARCA and DYDX differently based on their functional classifications. Gaming tokens face potential scrutiny regarding virtual asset regulations, consumer protection frameworks, and gambling-related compliance requirements in various jurisdictions.
-
DYDX, as a governance token for a derivatives trading protocol, faces regulatory considerations related to securities classifications, derivatives trading regulations, and cross-border financial services compliance. The materials note that decentralized validator structures may reduce certain regulatory risks compared to centralized sequencer models.
-
Both assets operate in evolving regulatory environments where policy developments may materially impact utility, trading accessibility, and institutional adoption patterns across different jurisdictions.
VI. Conclusion: Which Is the Better Buy?
📌 Investment Value Summary:
-
ARCA Characteristics: Represents exposure to blockchain gaming sector with focus on mobile card-based RPG gameplay and NFT trading functionality. Launched in 2024, the token operates in a developing market segment with evolving user adoption patterns. Current price positioning at $0.004912 reflects early-stage market valuation.
-
DYDX Characteristics: Provides exposure to decentralized derivatives infrastructure with established trading functionality across 66 perpetual contract pairs. The November 2023 v4 upgrade introduced enhanced tokenomics through direct fee distribution to stakers, creating utility alignment between token holders and protocol activity. Current trading volume and staking mechanisms represent operational protocol economics.
✅ Investment Considerations:
-
Entry-level Participants: May consider starting with assets demonstrating clearer utility models and established operational metrics. Understanding governance mechanisms, staking requirements, and sector-specific dynamics remains important before allocation decisions. Diversification across multiple blockchain sectors may help manage concentration risk.
-
Experienced Participants: May evaluate relative positioning based on sector exposure preferences (gaming vs derivatives infrastructure), governance participation interest, and risk-adjusted return expectations. Comparative analysis of tokenomics models, ecosystem development trajectories, and competitive positioning within respective sectors may inform allocation frameworks.
-
Institutional Participants: May assess factors including liquidity depth, custody solutions availability, regulatory clarity in relevant jurisdictions, governance rights structure, and alignment with broader portfolio mandates. Due diligence on protocol security audits, team backgrounds, and treasury management practices remains relevant for institutional allocation processes.
⚠️ Risk Disclosure: Cryptocurrency markets exhibit substantial volatility and risk characteristics. This content does not constitute investment advice, financial recommendation, or trading guidance. Market participants should conduct independent research, assess personal risk tolerance, and consider consultation with qualified financial advisors before making allocation decisions. Past performance does not indicate future results, and digital asset investments may result in partial or total capital loss.
VII. FAQ
Q1: What are the primary differences in tokenomics between ARCA and DYDX?
DYDX features a clearly defined staking-based economic model with direct fee distribution, while ARCA lacks publicly available tokenomics information in current reference materials. DYDX token holders can stake tokens to secure the Cosmos-based application chain and earn proportional transaction fee rewards—the chain generates over $43 million in annualized fees for validators under current activity levels. This creates a linear relationship between token ownership and yield generation. In contrast, available materials do not provide specific information about ARCA's total supply, issuance schedule, or economic design mechanisms, making comparative tokenomics analysis incomplete.
Q2: How do the technical architectures of ARCA and DYDX differ?
DYDX operates on a dedicated Cosmos application chain with distributed PoS validators, while ARCA's technical infrastructure remains unspecified in available materials. DYDX migrated to its v4 architecture in November 2023, transitioning from an Ethereum-based rollup to its own blockchain. This architecture enables on-chain governance execution, off-chain order matching, and direct protocol-level revenue distribution. The distributed validator set reduces regulatory risks associated with centralized sequencers. For ARCA, reference materials mention mobile-based card RPG gameplay and NFT composability but do not detail the underlying blockchain infrastructure, scalability solutions, or network architecture.
Q3: Which asset demonstrates stronger institutional adoption indicators?
DYDX shows more concrete institutional adoption evidence through its operational derivatives protocol, while ARCA's institutional positioning remains unclear. DYDX operates as a functional decentralized derivatives exchange with 66 trading pairs as of June 2024, generating quantifiable trading volume and validator participation. The materials mention activist investors like Arca (the crypto hedge fund) showing interest in governance token opportunities, though specific institutional holdings data for either ARCA or DYDX tokens is not provided. DYDX's established product-market fit in derivatives trading and revenue-generating staking mechanism present more measurable institutional engagement points compared to ARCA's early-stage gaming sector positioning.
Q4: What are the comparative liquidity profiles of ARCA and DYDX?
DYDX demonstrates significantly higher liquidity metrics compared to ARCA based on current trading volumes. As of the reference date, DYDX recorded 24-hour trading volume of $655,195.64 versus ARCA's $45,767.22—representing approximately 14 times greater liquidity. This disparity may impact execution quality, price slippage, and position entry/exit efficiency, particularly during periods of market volatility. Lower liquidity assets like ARCA may present challenges for larger position sizes and rapid portfolio adjustments. The liquidity differential reflects DYDX's more established market presence and broader exchange listing coverage compared to ARCA's recent 2024 launch.
Q5: How do regulatory risk profiles differ between gaming tokens and derivatives protocol tokens?
Gaming tokens and derivatives protocol tokens face distinct regulatory frameworks based on their functional classifications. Gaming tokens like ARCA may encounter scrutiny regarding virtual asset regulations, consumer protection frameworks, and potential gambling-related compliance requirements across various jurisdictions. DYDX, as a governance token for a derivatives trading protocol, faces considerations related to securities classifications, derivatives trading regulations, and cross-border financial services compliance. The materials note that DYDX's decentralized validator structure may mitigate certain regulatory risks compared to centralized sequencer models. Both assets operate in evolving regulatory environments where policy developments may materially impact utility and accessibility.
Q6: What portfolio allocation strategies might suit different investor risk profiles?
Conservative investors might consider ARCA 20-30% versus DYDX 70-80%, emphasizing DYDX's established protocol infrastructure and revenue-generating staking mechanisms. This allocation prioritizes governance utility and fee distribution models with demonstrated operational metrics. Aggressive investors might allocate ARCA 40-50% versus DYDX 50-60%, incorporating higher exposure to gaming sector positioning while maintaining significant derivatives infrastructure allocation. This reflects tolerance for gaming sector volatility alongside established DeFi protocols. Both strategies may incorporate stablecoin allocations (15-25% of crypto portfolio), options strategies where available, and cross-asset diversification across different blockchain sectors to manage concentration risk.
Q7: How do the governance mechanisms of ARCA and DYDX compare?
DYDX features comprehensive on-chain governance with direct proposal execution, while ARCA's governance structure is not detailed in available materials. DYDX token holders can propose and vote on initiatives directly affecting chain development, including introduction of new perpetual contract markets, trading incentive programs, foundation funding, and technical upgrades. All successfully voted proposals execute on-chain, creating transparent and irreversible governance outcomes. The v4 upgrade enhanced governance processes alongside token utility and revenue accrual methods. For ARCA, reference materials do not provide information about governance frameworks, voting mechanisms, or community participation structures, limiting comparative analysis of decentralized decision-making capabilities.
Q8: What drives the substantial price prediction variance between ARCA and DYDX through 2031?
Price projection differences reflect distinct market capitalizations, established ecosystem maturity, and sector-specific growth trajectories. DYDX projections (2031: $0.147-$0.243) incorporate existing derivatives trading infrastructure, quantifiable fee generation, and established market positioning. ARCA projections (2031: $0.0078-$0.0103) reflect early-stage gaming sector positioning and lower current market valuation starting from $0.004912. The percentage growth rates shown in projection tables indicate ARCA's 104% projected change versus DYDX's 51% by 2031, though absolute price levels differ substantially. Key drivers include institutional capital inflows, ecosystem expansion rates, competitive dynamics within respective sectors, and broader crypto market adoption patterns affecting gaming tokens differently than DeFi infrastructure tokens.
Share
Content
Introduction: Investment Comparison Between ARCA and DYDX
I. Historical Price Comparison and Current Market Status
II. Core Factors Influencing ARCA vs DYDX Investment Value
III. 2026-2031 Price Prediction: ARCA vs DYDX
IV. Investment Strategy Comparison: ARCA vs DYDX
V. Potential Risk Comparison
VI. Conclusion: Which Is the Better Buy?
VII. FAQ
How to Buy Cryptocurrency


Trending Cryptocurrencies


2025 Vertus daily combo code: Web3 gamers rewards guide

Today's Vertus Daily Combo Code: Boost Your Web3 Gaming Rewards (April 29, 2025)

GALA Coin (GALA) – Web3 Gaming Token Overview, Price Prediction & Trading on Gate.com

What is Gaming Crypto?How Gaming Crypto Works?
Detailed analysis of the top ten encryption game coins to be launched in 2025
Top 6 Best Gaming Currencies

Comprehensive Guide to Bitcoin Rainbow Chart

2026 MP Price Prediction: Expert Analysis and Market Outlook for Next-Generation Computing Power

2026 TMAI Price Prediction: Expert Analysis and Market Forecast for the Next Bull Run
2026 SPON Price Prediction: Expert Analysis and Market Forecast for Sponge Token's Future Value
2026 DRAC Price Prediction: Expert Analysis and Market Forecast for Decentralized Resilient AI Computing