Candlestick Patterns in Trading: A Fundamental Guide

What Are Candlestick Patterns
Candlestick charts represent one of the most fundamental tools in technical analysis, and they are typically the first element traders encounter when opening a price chart. These visual representations can reveal much more about market conditions than one might initially expect.
A candlestick is a method of displaying price data for a specific time period, with each candle showing information based on a predetermined time frame. When multiple candlesticks are connected together, they reveal market conditions over a period of time, forming what traders call "patterns." Understanding candlestick formations enables traders to comprehend short-term market sentiment and momentum.
Candlesticks serve as a cornerstone of technical analysis, with each candle composed of several key elements:
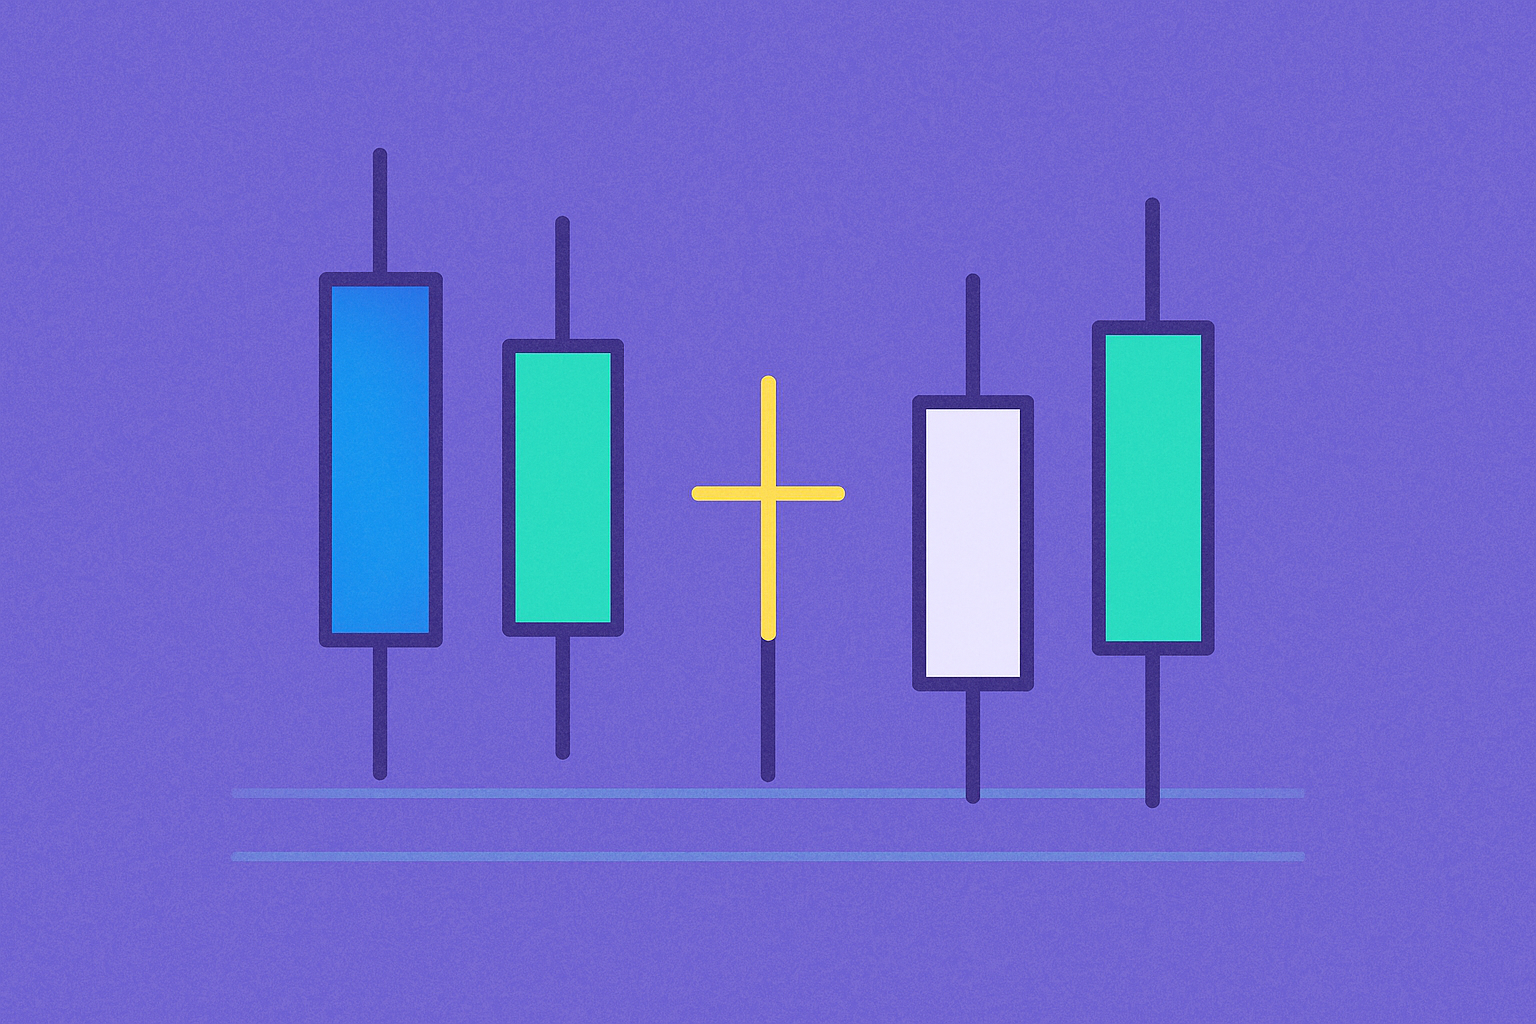
The Candle Body: This represents the distance between the opening and closing prices. The body essentially summarizes the momentum that occurred during each time period. For instance, on a daily chart, one candlestick represents the opening and closing prices of the day, providing a summary of that day's price movement. A larger body indicates stronger momentum in the direction of the trend, whether bullish or bearish.
The Candle Wicks (or Shadows): These are the thin lines extending from the body, showing the intra-period high and low prices. The wicks reveal price volatility during each period, indicating the highest and lowest prices reached. Longer wicks with a smaller body suggest higher volatility and indecision in the market. Additionally, wicks can indicate buying or selling pressure corresponding to demand and supply zones, often serving as early warning signals for potential reversals.
Candle Color: The color indicates the direction of price movement within the period. Typically, green or white candles show that the closing price is higher than the opening price (bullish), while red or black candles indicate that the closing price is lower than the opening price (bearish). Some trading platforms allow customization of these colors based on trader preference.
Basic Candlestick Reading Principles
The characteristics of Japanese candlesticks can be summarized as follows:
Comprehensive Price Information: Each candlestick provides a complete dataset about opening and closing prices, volatility levels, and price momentum within a defined time period. This condensed information format allows traders to quickly assess market conditions at a glance.
Market Psychology Indicators: Candlesticks reveal the psychology of market participants, showing the balance between buying and selling pressure in the short term. The formation of each candle reflects the collective decisions of thousands of traders, making them powerful sentiment indicators.
Pattern Formation: When multiple candlesticks are combined, they form price patterns that can be used to create short-term trading strategies, such as scalping or day trading approaches. These patterns have been studied and documented over centuries, providing traders with reliable signals for entry and exit points.
Time Frame Flexibility: Candlestick analysis works across all time frames, from 1-minute charts for scalpers to monthly charts for long-term investors. The principles remain consistent regardless of the time frame chosen.
Characteristics of Candlestick Types
Each individual candlestick carries its own significance and can be broadly categorized into bearish (red) and bullish (green) candles. However, the specific formation provides varying degrees of bullish or bearish sentiment:
Red Candles: These range from extremely bearish (left) to mildly bearish (right) based on their formation. A long red candle with little to no wicks indicates strong selling pressure and bearish momentum. Conversely, a red candle with a small body and long wicks suggests that despite the bearish close, there was significant buying interest during the period.
Green Candles: These range from extremely bullish (left) to mildly bullish (right). A long green candle with minimal wicks demonstrates powerful buying pressure and bullish conviction. A green candle with a small body and extended wicks indicates that while buyers managed to close higher, there was considerable selling pressure to overcome.
Doji Candles: A Doji forms when the opening and closing prices are identical or extremely close to each other. This creates a candle with little to no body, typically appearing as a cross or plus sign. Doji candles signal market indecision and lack of clear momentum, often appearing at potential turning points in the market. The significance of a Doji increases when it appears after a strong trend, suggesting that the trend may be losing steam.
10 Essential Candlestick Patterns and Their Interpretations
Bullish Reversal Patterns
Bullish Engulfing Pattern: This formation consists of two candlesticks, where the first is a red (bearish) candle followed by a larger green (bullish) candle that completely engulfs the body of the previous red candle. The green candle opens lower than the red candle's close but closes higher than the red candle's open, demonstrating a shift in momentum from sellers to buyers.
This pattern indicates that after a period of selling pressure, buying interest has suddenly overwhelmed the bears. It suggests that the price may have reached a support level, and traders might consider entering long positions with a stop loss placed below the pattern. For confirmation, traders should check if the RSI indicator is in oversold territory (below 30), which would strengthen the reversal signal. The pattern is most reliable when it appears after a sustained downtrend and at key support levels.
Morning Star Pattern: This three-candle formation signals a potential reversal from a downtrend to an uptrend. The first candle is a long red bearish candle, the second is a small-bodied candle (which can be red or green) or a Doji showing indecision, and the third is a long green bullish candle that closes well above the midpoint of the first candle.
The pattern tells a story of changing market sentiment: the first candle shows strong selling pressure, the second candle indicates that sellers are losing control and buyers are starting to step in, and the third candle confirms that buyers have taken control. The longer the third candle's body, the stronger the reversal signal. Traders often wait for the third candle to close before entering positions to confirm the pattern's completion.
Bearish Reversal Patterns
Bearish Engulfing Pattern: This formation consists of two candlesticks, where the first is a green (bullish) candle followed by a larger red (bearish) candle that completely engulfs the body of the previous green candle. The red candle opens higher than the green candle's close but closes lower than the green candle's open.
This pattern indicates that after an upward trend, profit-taking selling pressure has overwhelmed the bulls. It suggests that the price may have reached a resistance level, and traders might consider taking profits on long positions or opening short positions. In a strong bull market, traders should use trendlines to confirm that the market has actually reversed, rather than just experiencing temporary profit-taking. The pattern is most significant when it appears after a prolonged uptrend and near key resistance levels.
Evening Star Pattern: This three-candle formation signals a potential reversal from an uptrend to a downtrend. The first candle is a long green bullish candle, the second is a small-bodied candle (which can be red or green) or a Doji showing indecision, and the third is a long red bearish candle that closes well below the midpoint of the first candle.
The pattern demonstrates a shift in market dynamics: after a strong upward move in the first candle, traders become hesitant in the second candle, causing momentum to slow. The third candle shows that sellers have entered in force and successfully pushed prices lower. The longer the body of the third candle, the stronger the bearish reversal signal. Volume confirmation can add reliability to this pattern.
Bullish Continuation Patterns
Rising Three Methods: This pattern consists of five candlesticks and indicates that an uptrend will continue after a brief consolidation. The first candle is a long green bullish candle, followed by three smaller red bearish candles (the "three methods") that trade within the range of the first candle without closing below its open. The fifth candle is a long green bullish candle that closes above the high of the first candle.
This pattern is comparable to a breakout from a temporary pause or consolidation phase, with the trend resuming its upward direction. The three small red candles represent profit-taking or temporary weakness, but the fact that they remain within the first candle's range shows that the underlying bullish sentiment remains intact. When the fifth candle breaks out to new highs, it confirms that buyers are back in control and the uptrend is likely to continue.
Bearish Continuation Patterns
Falling Three Methods: This pattern consists of five candlesticks and indicates that a downtrend will continue after a brief rebound. The first candle is a long red bearish candle, followed by three smaller green bullish candles that trade within the range of the first candle without closing above its open. The fifth candle is a long red bearish candle that closes below the low of the first candle.
This pattern is comparable to a breakout from a temporary rebound, with the downtrend resuming its course. Traders can use Fibonacci retracement levels to gauge the extent of the rebound and identify optimal entry points for short positions aligned with the trend. The pattern confirms that despite temporary buying interest, the overall bearish sentiment remains dominant, and sellers are likely to push prices lower.
Indecision Patterns
Indecision patterns primarily consist of various Doji formations, differentiated by the characteristics of their wicks or shadows:
Gravestone Doji: This Doji has a long upper wick with little to no lower wick, and the open and close are at or near the low of the period. It indicates that buyers pushed prices significantly higher during the period, but sellers overwhelmed them before the close, driving prices back down to the opening level.
While technically an indecision pattern, the Gravestone Doji carries bearish implications, especially when it appears at resistance levels. The long upper wick shows rejection of higher prices, suggesting that selling pressure remains significant. If this pattern forms after an uptrend and at a key resistance level, it can serve as a reversal signal from bullish to bearish.
Dragonfly Doji: This Doji has a long lower wick with little to no upper wick, and the open and close are at or near the high of the period. It indicates that sellers pushed prices significantly lower during the period, but buyers stepped in forcefully before the close, driving prices back up to the opening level.
While technically an indecision pattern, the Dragonfly Doji carries bullish implications, especially when it appears at support levels. The long lower wick shows rejection of lower prices, suggesting that buying pressure remains significant. If this pattern forms after a downtrend and at a key support level, it can serve as a reversal signal from bearish to bullish.
Neutral Doji: This formation has wicks of similar length on both the top and bottom, with the opening and closing prices equal or very close to each other. This candlestick indicates high market volatility combined with a complete lack of directional bias, where buying and selling forces are nearly equal.
The Neutral Doji represents a market in sideways consolidation, waiting for a catalyst to trigger momentum in either direction. Traders should exercise caution when encountering this pattern, as it signals that the market is at an equilibrium point and could break out in either direction with sufficient volume and momentum.
Spinning Top: This pattern features wicks of similar length on both top and bottom, similar to a Doji, but with a more substantial body. Whether the body is red or green, the interpretation remains the same: the market has not yet decided on a direction, and the prevailing trend is beginning to lose momentum.
Spinning tops suggest that the balance between buyers and sellers is shifting, and the current trend may be exhausting. Traders should be alert for potential reversals or consolidation periods when these patterns appear. It's often wise to consider taking profits or implementing trailing stop losses when spinning tops emerge after extended trends.
Summary: Candlestick Patterns in Trading Practice
Candlestick patterns, or candlestick charts, serve as a concise yet information-rich tool for displaying price action over specific time periods. They represent one of the most fundamental aspects of technical analysis. The characteristics and properties of candlesticks reveal momentum and short-term market conditions arising from the interplay between buying pressure, selling pressure, opening prices, and closing prices.
To maximize the effectiveness of candlestick pattern analysis, traders should combine these formations with other technical tools such as support and resistance levels, Fibonacci retracements, and trendlines. This multi-faceted approach significantly enhances trading accuracy and decision-making speed.
Candlestick analysis is versatile and applicable to all trading styles, including:
Scalping: Quick trades based on small price movements, where candlestick patterns on lower time frames (1-minute to 15-minute charts) provide rapid entry and exit signals.
Day Trading: Intraday positions held for hours, where candlestick patterns on hourly and 4-hour charts help identify optimal trade setups within the trading day.
Swing Trading: Positions held for days to weeks, where daily candlestick patterns combined with weekly trend analysis provide high-probability trade opportunities.
Regardless of your trading style, mastering candlestick pattern recognition and interpretation will significantly improve your ability to read market sentiment, identify potential reversals and continuations, and make more informed trading decisions. Remember that no single pattern guarantees success, and patterns should always be confirmed with other technical indicators, volume analysis, and proper risk management strategies.
FAQ
What is a candlestick chart(K-line chart)? What are the basic components of candlestick charts?
A candlestick chart displays four price points: open, close, high, and low. Each candle consists of a body(showing open and close prices), wicks(showing high and low prices), and color(red for up, green for down). Each candle represents one trading period's volume and price movement data.
What are the most common candlestick patterns? How to identify them?
Common patterns include Doji, Spinning Top, Engulfing, Harami, and Hammer. Identify by analyzing candlestick body size, wick length, and position relative to previous candles. Each pattern signals different market sentiment and potential trend reversals.
What trading signals do hammer lines, inverted hammer lines, and engulfing patterns represent respectively?
Hammer line signals bullish reversal with strong buying pressure. Inverted hammer line indicates bearish reversal after uptrend. Engulfing patterns suggest trend reversal, with bullish engulfing showing reversal to uptrend and bearish engulfing indicating reversal to downtrend.
How to use candlestick patterns for trading decisions?
Identify market trends and potential reversals using candlestick patterns like hammers and hanging mans. Combine patterns with other technical analysis tools and volume analysis to confirm signals. Use patterns to spot entry and exit points, but always conduct independent research and manage risk properly.
Candlestick pattern analysis accuracy and limitations?
Candlestick pattern accuracy depends on trader experience and market conditions. Key limitations include subjective interpretation, false signals in volatile markets, and poor performance without volume confirmation. Patterns work best combined with other technical indicators.
How to combine candlestick patterns with other technical indicators for trading?
Combine candlestick patterns with technical indicators like RSI, moving averages, and Bollinger Bands to filter and confirm trading signals. Use these combinations to enhance trend-following strategies and improve market analysis accuracy for better trading outcomes.
How should beginners learn and apply candlestick patterns for risk management?
Beginners should master basic candlestick patterns like hammers and engulfing candles, then apply stop-loss orders to manage risk effectively. Use patterns to identify trends and reversals, combining technical analysis with proper position sizing for consistent risk management in trading.
Share
Content
How to Buy Cryptocurrency


Trending Cryptocurrencies


K-line Investment Strategies: Using Technical Chart Patterns to Capture the Best Trading Opportunities

Mastering chart codes: Candlestick chart analysis helps you invest accurately

K-line Techniques Unveiled: How to Understand Market Trends Through K-lines

PENGU Price Analysis: Volatility Patterns, Support at $0.0087 and BTC Correlation
SKYAI Price Analysis: MACD and RSI Signals Reveal Bearish Short-Term Trend

Candlestick Chart Basics: Understanding the Structure and Trading Applications of Candle Charts

7 Top Blockchain Game Tokens

11 Strategies for Managing Economic Downturns

How to Buy Bitcoin in Russia with Rubles Commission-Free: Essential Strategies

Mechanisms of Crypto Asset (Virtual Currency) Lending and Domestic Services
6 Best Web3 Marketing Agencies To Support Your Crypto Project