Comprehensive Guide to Bitcoin Trading with the Wyckoff Pattern

Bitcoin Price Outlook Through the Wyckoff Pattern
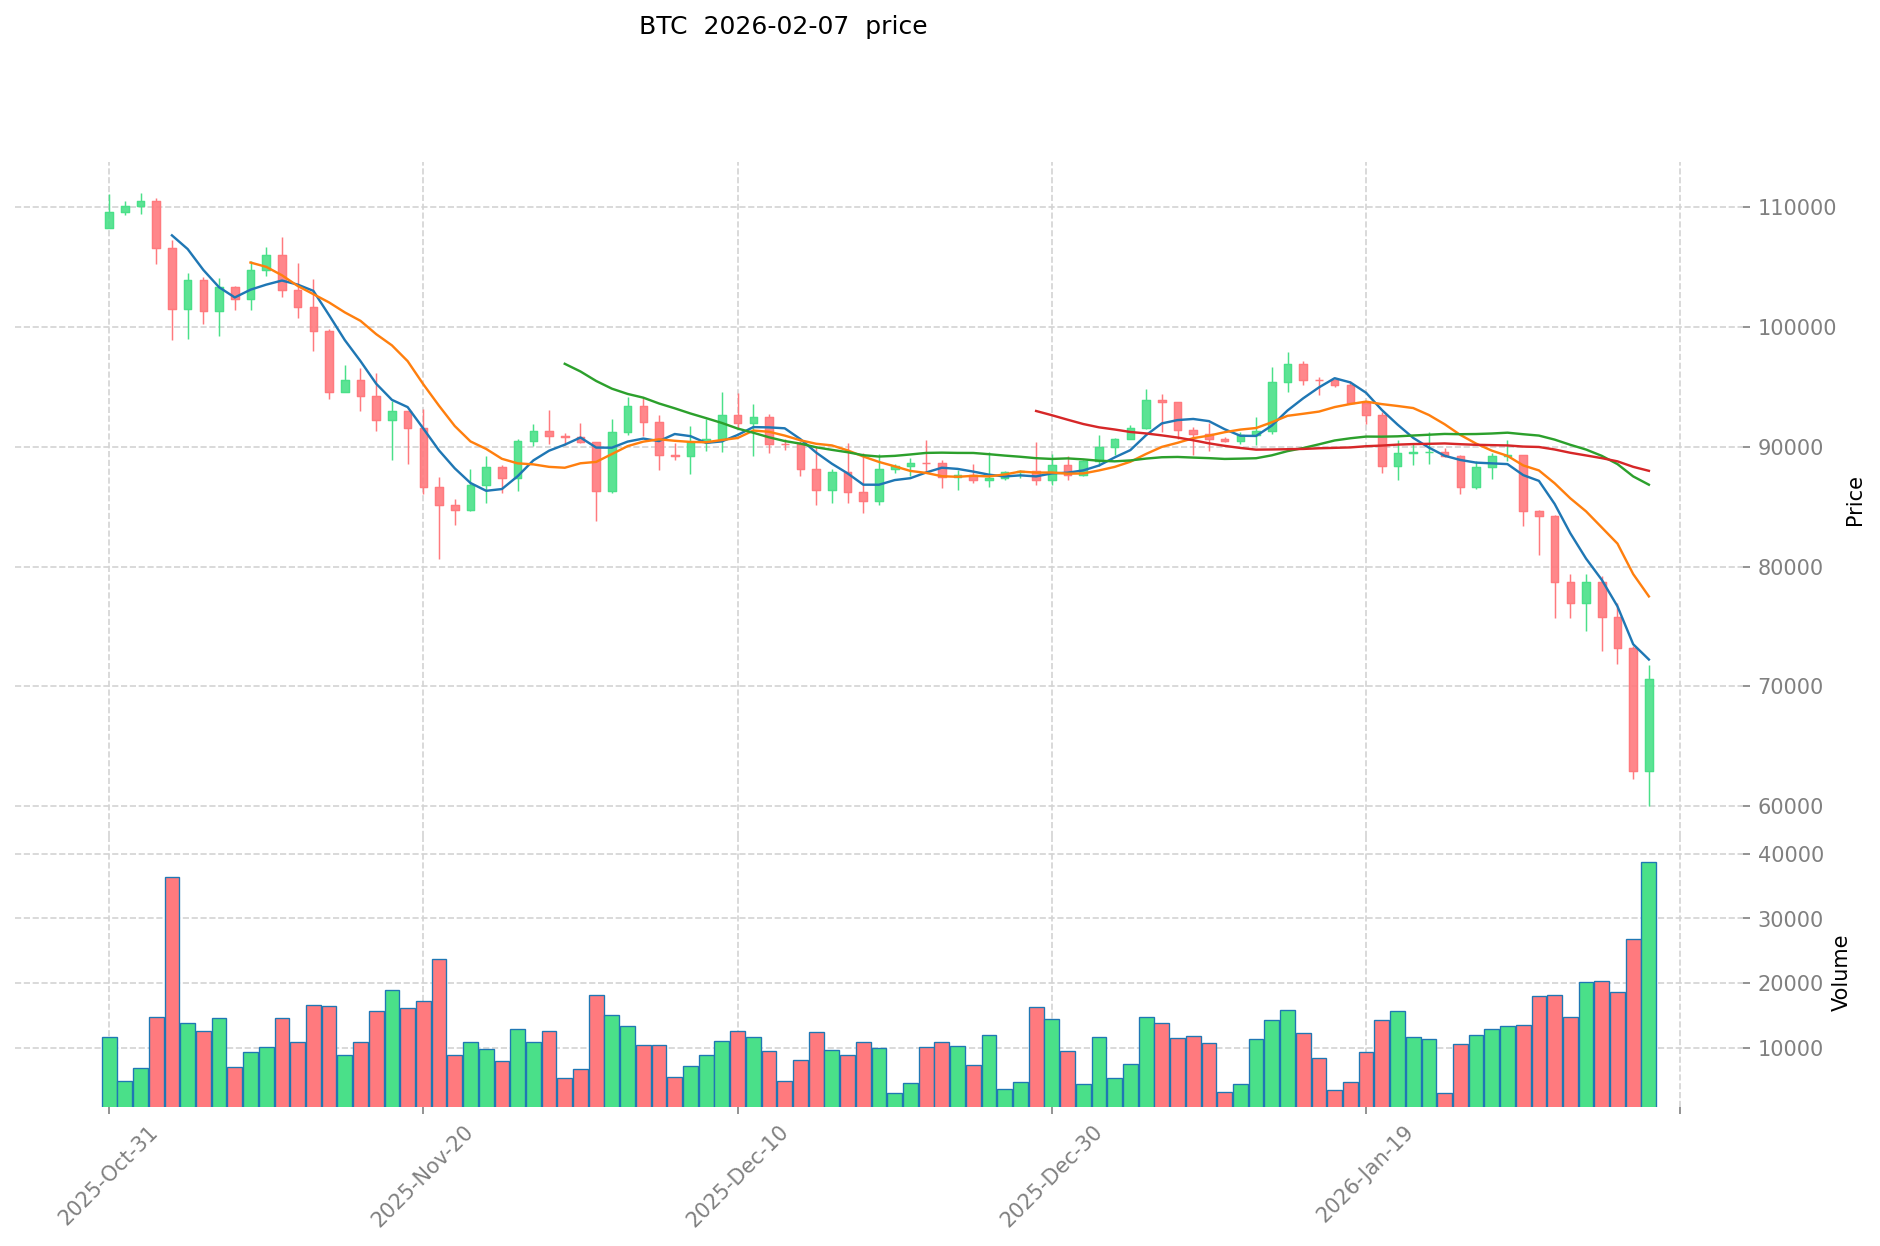
Analysts may have different perspectives when analyzing Bitcoin's Wyckoff pattern. According to on-chain analysis platforms, Bitcoin's price has been in a re-accumulation phase in recent months. The Bitcoin price has been oscillating between a horizontal support level (approximately $57,178) and a resistance level (approximately $71,587), which represents the typical sideways movement characteristic of re-accumulation.
Generally, the re-accumulation phase occurs early in the distribution stage of the Wyckoff pattern. This signals that institutions or experienced investors are looking to re-enter positions in the asset. During this phase, prices may rise again or stabilize at a certain level. Unlike the accumulation phase, trading volume tends to decrease during the re-accumulation phase, indicating a period of consolidation before the next significant move.
However, analysts have noted that in the short term, Bitcoin's price could potentially fall to between $57,000 and $51,000. This corresponds to the final stage of distribution in the Wyckoff pattern, where weak hands exit their positions before the next major trend emerges.
If the re-accumulation phase continues, the Wyckoff pattern could lead to the next phase of an upward trend or breakout. However, to confirm this transition, it is crucial to carefully monitor exchange inflows and on-chain indicators, which provide valuable insights into the behavior of smart money and retail investors.
Understanding the Wyckoff Pattern
The Wyckoff pattern is uniquely useful for understanding and trading within expected price ranges, unlike other tools that track price reversals and trend-based movements. This methodology provides traders with a framework for identifying market phases and anticipating future price action based on the interplay between supply and demand.
This method examines the market from a broader perspective through supply and demand dynamics, as well as price and volume analysis. It helps identify price movements that may be hidden within wide price ranges or behind whipsaws—sudden price movements that trap inexperienced traders. By understanding these dynamics, traders can position themselves advantageously before major moves occur.
Every standard Wyckoff price cycle can be divided into four distinct phases: accumulation, markup (uptrend), distribution, and markdown (downtrend). Each phase has specific characteristics that help traders identify where the market currently stands and what might come next.
Accumulation Phase
The first phase revolves around smart money—experienced investors or institutional investors with significant resources and market information. During this phase, these sophisticated market participants accumulate their desired coins or specific asset classes while prices are still relatively low.
This phase appears as trading that occurs after a steady price decline. To ordinary investors, it may look like a range-bound movement or consolidation, but in reality, it's a zone where smart money is actively buying. Informed investors recognize the characteristics of undervalued assets during the accumulation phase and carefully continue their purchases, often disguising their activity to avoid driving prices up prematurely.
The price of a declining coin eventually finds support and begins to move sideways, creating a trading range. This sideways movement is crucial as it allows smart money to build substantial positions without significantly impacting the price. The accumulation phase typically features decreasing volatility and volume as the downtrend exhausts itself.
Distribution Phase
The distribution phase is the third phase of the Wyckoff price cycle. After the accumulation and markup phases are completed, following a sustained uptrend, a certain trading range appears at higher price levels. At this point, smart money or well-informed and experienced investors begin to quietly dispose of their holdings, distributing their positions to less-informed market participants.
The distribution phase is the exact opposite of the accumulation phase and signals preparation for a sustained price decline. During this phase, smart money exits their positions while retail investors, driven by fear of missing out, often enter at unfavorable prices. This transfer of assets from strong hands to weak hands sets the stage for the subsequent markdown phase.
Use Cases of the Wyckoff Pattern
The Wyckoff pattern is one of several trading strategy tools, including moving averages and relative strength index (RSI). When used in conjunction with other cryptocurrency investment strategies, the Wyckoff pattern can help capture notable investment momentum and provide confirmation for trading decisions.
Traders can apply the Wyckoff methodology across various timeframes, from intraday charts to weekly or monthly charts, making it versatile for different trading styles. Short-term traders might use it to identify entry and exit points within a single phase, while long-term investors can use it to understand the broader market cycle and position themselves accordingly for major trends.
History of the Wyckoff Pattern
The Wyckoff pattern is a technique first introduced by market analyst Richard Demille Wyckoff in his 1931 book "Stock Market Technique." He believed that market flow changes significantly according to the behavior of experienced traders or institutional investors, and he dedicated his career to understanding and codifying these patterns.
The principles that drive the Wyckoff pattern are as follows:
- All markets consist of cycles of accumulation, markup, distribution, and markdown phases.
- Markets are driven by supply and demand, which determine prices. Investors should read price and volume data together to understand the true market dynamics.
- Institutional investors or smart money can influence market movements. When predicting trends, their behavior should be tracked through careful analysis of price and volume.
- To capture potential opportunities, compare the asset to a benchmark or index to understand relative strength or weakness.
- Accurate timing of trades is essential to trading success, and the Wyckoff method provides a framework for identifying optimal entry and exit points.
In-Depth Analysis of the Wyckoff Method
Wyckoff trading consists of four main approaches that work together to provide a comprehensive market analysis framework:
- Determining market cycles or phases
- Analyzing supply and demand dynamics
- Assessing market conditions (strengths and weaknesses)
- Analyzing market readiness (finding signs and optimal timing to enter or liquidate)
Accumulation
This phase occurs immediately after a downtrend and is characterized by buying at low prices, steady increases in buying volume, and small price fluctuations. The accumulation phase typically shows a gradual absorption of available supply, with smart money methodically building positions. Price action during this phase often appears choppy and directionless to the untrained eye, but careful analysis reveals a pattern of higher lows and decreasing selling pressure.
Markup Phase
During the markup phase, prices rise consistently as demand overwhelms supply. This phase represents the transition from accumulation to a clear uptrend, where the asset breaks out of its trading range and begins a sustained advance. Volume typically increases during this phase, confirming the strength of the move. Traders who identified the accumulation phase early are now seeing their positions move into profit.
Distribution Phase
The distribution phase begins after a prolonged uptrend. It is characterized by a high relative strength index and an increase in red candles (bearish price action). This also means that selling pressure is increasing as smart money begins to exit their positions. The distribution phase often shows signs of exhaustion, such as decreasing momentum despite new highs, or increased volatility as buyers and sellers battle for control.
Markdown Phase
A downtrend appears after the distribution phase. At this time, selling pressure becomes evident, and even investors who invested unconsciously begin to cash out. The markdown phase represents the final stage of the Wyckoff cycle, where prices decline as supply overwhelms demand. This phase continues until prices reach levels attractive enough for smart money to begin accumulating again, starting the cycle anew.
Market Dynamics in the Wyckoff Pattern
Understanding the relationship between price and volume is crucial for applying the Wyckoff method effectively:
- A price increase with high volume indicates strong buying pressure and suggests that the move is likely to continue, while a price decrease with high volume indicates strong selling pressure and warns of potential further declines.
- If active accumulation and distribution phases are in progress, candlestick boundaries can act as resistance and support levels, providing reference points for trading decisions.
- Some Wyckoff patterns occur between each phase, serving as transition signals that help traders anticipate the next market move.
- The time period for analyzing Wyckoff patterns can vary depending on the trader's timeframe and the specific market being analyzed, from minutes to months.
Key Points for Better Predictions
Understanding these specific events within the Wyckoff cycle enhances prediction accuracy:
Preliminary Support (PS) - This precedes the accumulation phase and represents the lowest point of the asset, where initial buying interest begins to emerge after a prolonged decline.
Selling Climax (SC) - This is the section before the asset enters the accumulation trading range under significant selling pressure. The selling climax often represents capitulation by weak hands and marks the exhaustion of selling pressure.
Automatic Rally (AR) - After the selling climax, this occurs when prices receive support in the preliminary support zone. The automatic rally represents the first sign that supply has been absorbed and demand is beginning to assert itself.
Secondary Test (ST) - This is a price decline that occurs after the automatic rally, testing whether the selling pressure has truly been exhausted. A successful secondary test on lower volume confirms that sellers are no longer in control.
Spring - During the accumulation phase, this is the stage where the price falls below the preliminary support. The "spring" is characterized by a decrease in volume after a price decline, indicating that selling momentum is waning and represents a final shakeout of weak hands before the markup phase begins.
Last Point of Support (LPS) - The asset price tests the previous secondary test support line once more, providing a final opportunity to enter positions before the markup phase begins in earnest.
Preliminary Supply (PSY) - When a specific coin's price chart enters the distribution phase, the upward price trend breaks and meets a resistance zone within the range. This marks the beginning of smart money distribution.
Buying Climax (BC) - A sudden influx of buyers or buying pressure occurs, often driven by euphoria and fear of missing out. This excessive buying creates the conditions for smart money to distribute their holdings.
Automatic Reaction (AR) or Automatic Sell-off (AS) - This is a rapid price correction caused by smart money selling their assets, representing the first significant sign that distribution is underway.
Upthrust (UT) - After the automatic sell-off, a rally called an upthrust follows, meaning "pushing upward." This move is designed to attract final buyers before the markdown phase begins.
Secondary Test - After the asset price retests PSY or preliminary resistance, it begins to correct again, confirming that supply is overcoming demand.
Upthrust After Distribution (UTAD) - This can be seen as the asset price's last attempt to rise, often trapping final buyers before the significant decline begins.
Last Point of Supply (LPSY) - This is the point where the price breaks through the automatic rally support line and begins to fall, confirming that the distribution phase is complete and the markdown phase is beginning.
Assessing Market Strength: Complementing the Wyckoff Method
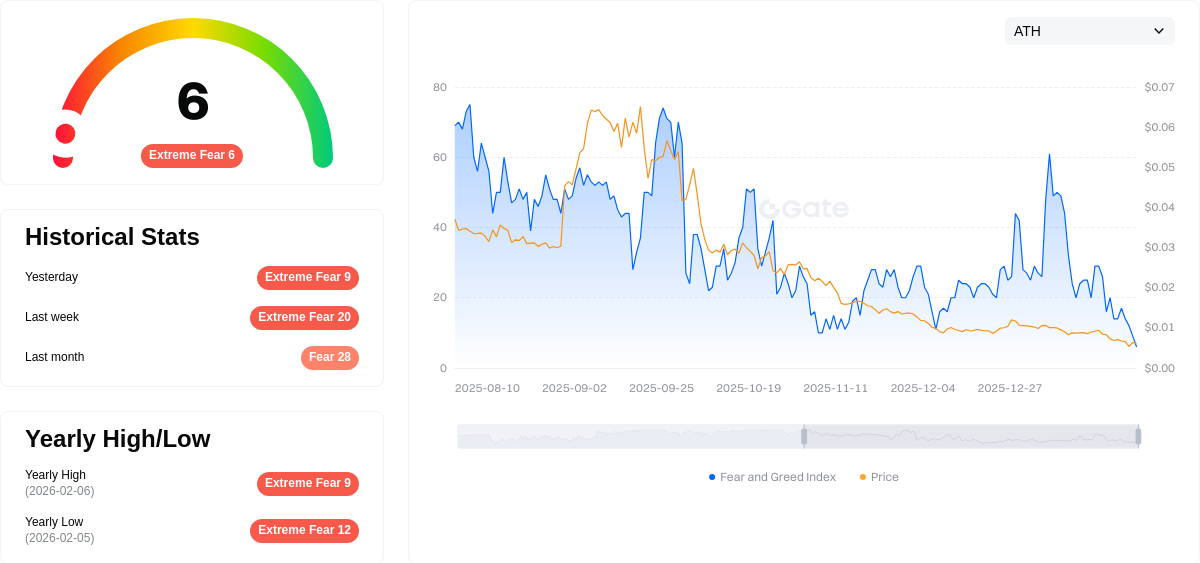
Understanding the Wyckoff pattern helps find important investment momentum, but it's also important to gain additional insights by assessing market strength. For example, when investing in cryptocurrencies, it's advisable to check Bitcoin dominance and the fear and greed index to gauge overall market sentiment and risk appetite.
Another approach is to examine the correlation with the relative strength index (RSI). When an asset is in the accumulation phase and a bullish divergence appears (where price makes lower lows but RSI makes higher lows), this can be interpreted as an uptrend or long-term upward movement signal. Such divergences often precede significant price advances and provide additional confirmation for positions established during accumulation.
Traders can also compare the asset's performance against broader market indices or similar assets to identify relative strength, which often indicates that smart money is accumulating that particular asset more aggressively than others.
Limitations of Wyckoff Pattern Analysis
While powerful, the Wyckoff method has limitations that traders should understand:
-
Time-Consuming: Learning and applying the Wyckoff pattern can take considerable time and requires significant practice to master. Traders must develop the ability to recognize subtle patterns in price and volume that distinguish one phase from another.
-
Should Not Rely on One Method Alone: You should not rely solely on the Wyckoff pattern. Trend analysis should be done using various analytical tools such as moving averages, momentum indicators, and other technical analysis methods together. Combining multiple approaches provides confirmation and reduces the risk of false signals.
-
Market Volatility: Assets can rise or fall immediately depending on market sentiment, sometimes overriding the Wyckoff pattern's predictions. External factors such as regulatory news, macroeconomic events, or sudden shifts in market psychology can disrupt expected pattern development. Additionally, the cryptocurrency market's 24/7 nature and global participation can create unique dynamics not present in traditional markets where Wyckoff originally developed his methodology.
Conclusion
The Wyckoff pattern is a proven tool that analyzes market dynamics such as supply and demand, price and volume, and accumulation and distribution more closely. This methodology provides traders with a comprehensive framework for understanding market cycles and positioning themselves advantageously throughout different phases.
Investors can further enhance the utility of the Wyckoff pattern by using it in conjunction with key technical analysis tools such as moving averages, various indicators, and market sentiment analysis. By combining the Wyckoff method with modern analytical tools and maintaining awareness of market fundamentals, traders can develop a robust approach to cryptocurrency trading that accounts for both technical patterns and broader market context.
The enduring relevance of the Wyckoff method, nearly a century after its introduction, testifies to its fundamental insights into market behavior. While markets have evolved significantly since Wyckoff's time, the underlying principles of supply and demand, and the behavior of informed versus uninformed market participants, remain as relevant today as they were in the early 20th century.
FAQ
What is Wyckoff Pattern and what are its basic principles?
Wyckoff Pattern is a technical analysis method developed by Richard Wyckoff based on supply and demand principles. It identifies market trends and potential price movements by analyzing volume, price action, and market structure to guide trading decisions.
What are the four stages of the Wyckoff Pattern and how to identify each stage?
The four stages are accumulation, markup, distribution, and markdown. Identify accumulation by rising price with low volume; markup by sustained uptrend; distribution by peak price with declining volume; markdown by downward movement with high volume.
How to apply Wyckoff Pattern in actual trading to make trading decisions?
Identify key price levels and volume patterns using Wyckoff analysis. Watch for accumulation and distribution phases, confirm reversals with volume spikes, and enter trades at support/resistance breakouts. Use volume confirmation to validate price moves for optimal entry and exit timing.
What is the role of trading volume in Wyckoff Pattern? Why is trading volume important?
Trading volume in Wyckoff Pattern reveals market liquidity and sentiment. High volume confirms strong trends and accumulation phases, while declining volume signals weakening momentum. Volume is critical for validating price movements and identifying trend reversals or continuation.
What is the difference between Accumulation and Distribution phases?
Accumulation is when smart money quietly buys assets at low prices, increasing volume and demand. Distribution is when they sell at higher prices to retail investors. Accumulation precedes bull runs; distribution precedes price declines.
What is the relationship between Wyckoff Pattern and other technical analysis methods (such as K-line patterns and moving averages)?
Wyckoff Pattern integrates K-line patterns and moving averages for more precise trend analysis. It identifies price and volume relationships over time to confirm support/resistance levels and buying/selling signals more accurately than individual methods alone.
How to identify key support and resistance levels in the Wyckoff Pattern?
Identify support and resistance by analyzing price bounces and declines that reflect supply and demand shifts. Support levels form at price bottoms where rebounds occur, while resistance levels form at tops where price advances stall. These pivotal points help predict future price movements and trend reversals.
Wyckoff Pattern在不同时间周期上的应用有什么不同?
Wyckoff Pattern在不同时间周期上的应用各具特色。短期周期(日线、小时线)捕捉快速波动和局部反转,适合短线交易。中期周期(周线)识别主要趋势和关键支撑阻力。长期周期(月线)揭示大级别趋势和战略机会。多时间框架联合分析能更全面准确地把握市场动向。
What are common mistakes or pitfalls when trading using the Wyckoff Pattern?
Common Wyckoff Pattern trading mistakes include ignoring trading volume analysis, failing to identify market phases correctly, poor risk management, and chasing false breakouts. Success requires combining price action with volume confirmation and understanding market structure.
Is the application effect of Wyckoff Pattern the same in cryptocurrency markets and stock markets?
No, Wyckoff Pattern shows different effectiveness across markets. Cryptocurrency markets exhibit higher volatility and weaker correlation with broader trends, making the pattern less consistent compared to traditional stock markets. Its reliability varies significantly between these two asset classes.
Share
Content
Bitcoin Price Outlook Through the Wyckoff Pattern
Understanding the Wyckoff Pattern
Accumulation Phase
Distribution Phase
Use Cases of the Wyckoff Pattern
History of the Wyckoff Pattern
In-Depth Analysis of the Wyckoff Method
Market Dynamics in the Wyckoff Pattern
Key Points for Better Predictions
Assessing Market Strength: Complementing the Wyckoff Method
Limitations of Wyckoff Pattern Analysis
Conclusion
FAQ
How to Buy Cryptocurrency


Trending Cryptocurrencies


How to Withdraw Money from Crypto Exchanges in 2025: A Beginner's Guide

5 ways to get Bitcoin for free in 2025: Newbie Guide
Treasure NFT Marketplace: A 2025 Guide for Web3 Gamers and Investors

What Is TOAD Coin and How Does Its Tokenomics Work?

Crypto Assets Beginner's Guide: How to Buy, Store, and Trade Your First Crypto Coin
What Is the Best AI Crypto in 2025?

What is Satoshi and Why Bitcoin is Divided into Parts

Movement Coin Price Outlook and Delisting Controversy: Everything You Need to Know

Understanding Byzantine Fault Tolerance in Blockchain: A Comprehensive Guide to 10 Key Concepts

What is Unspent Transaction Output (UTXO)?
Master Japanese candlesticks like a pro and explore the most popular patterns with real-world examples