GTAI vs FLOW: Which AI-Powered Platform Delivers Superior Performance and User Experience?
Introduction: Investment Comparison Between GTAI and FLOW
In the cryptocurrency market, the comparison between GTAI and FLOW represents a discussion of two distinct blockchain ecosystems with different value propositions. Both projects occupy different market positions in terms of market capitalization ranking, application scenarios, and price performance, reflecting varied approaches to blockchain technology adoption.
GT-Protocol (GTAI): Launched in 2024, this project positions itself around AI-driven portfolio management and trading execution across CeFi, DeFi, and NFT markets, utilizing a conversational AI interface for Web3 interactions.
Flow (FLOW): Introduced in 2020, Flow has established itself as a blockchain platform designed for next-generation applications and digital assets, with particular focus on gaming and mainstream user adoption.
This article will examine historical price trends, supply mechanisms, technical ecosystems, and market dynamics to provide a comprehensive analysis of the GTAI vs FLOW investment comparison, addressing key questions that investors frequently consider:
"Which represents a more suitable investment opportunity based on current market conditions?"
I. Historical Price Comparison and Current Market Status
GTAI (Coin A) and FLOW (Coin B) Historical Price Trends
- March 2024: GTAI reached a notable price level of $5.4994, representing a significant peak in its trading history during a period of heightened market activity.
- April 2021: FLOW experienced substantial price appreciation, reaching $42.4, driven by growing adoption in the NFT ecosystem and partnerships with major entertainment brands.
- September 2020: FLOW launched with an initial offering price of $0.1, establishing its entry point in the blockchain infrastructure market.
- January 2024: GTAI entered the market with a publish price of $0.2, introducing its AI-driven trading protocol to the Web3 ecosystem.
- Comparative Analysis: During the recent market cycle, GTAI declined from its peak of $5.4994 to a low of $0.02736, while FLOW decreased from its historical high of $42.4 to $0.052876, demonstrating substantial volatility across both assets.
Current Market Situation (February 3, 2026)
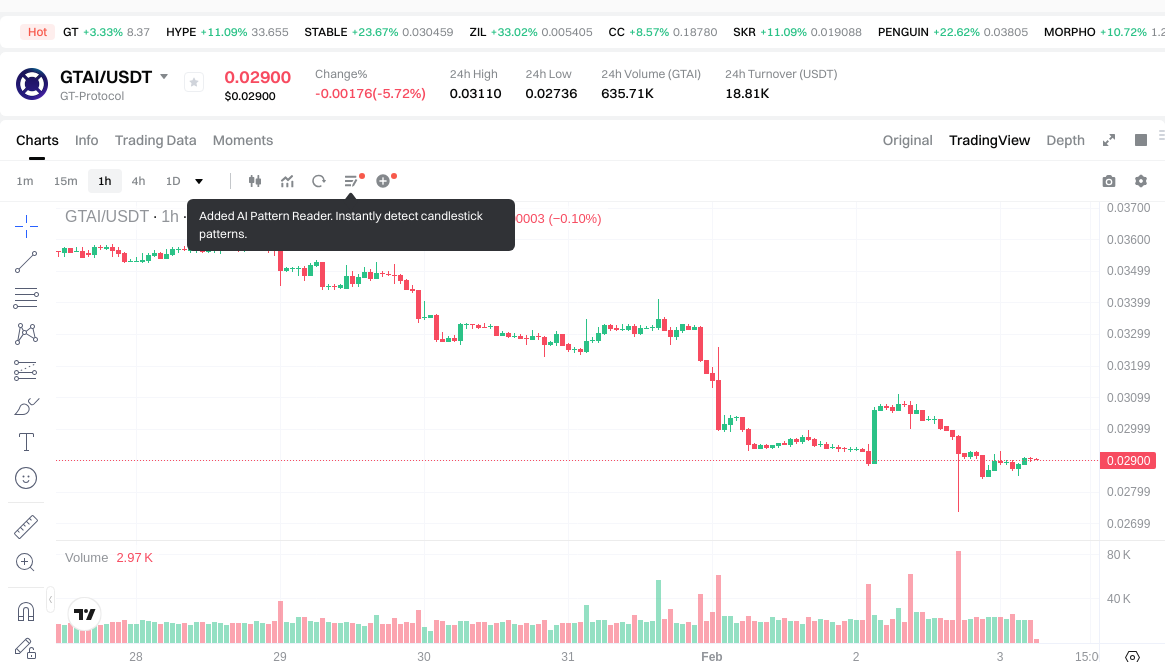
- GTAI Current Price: $0.02907
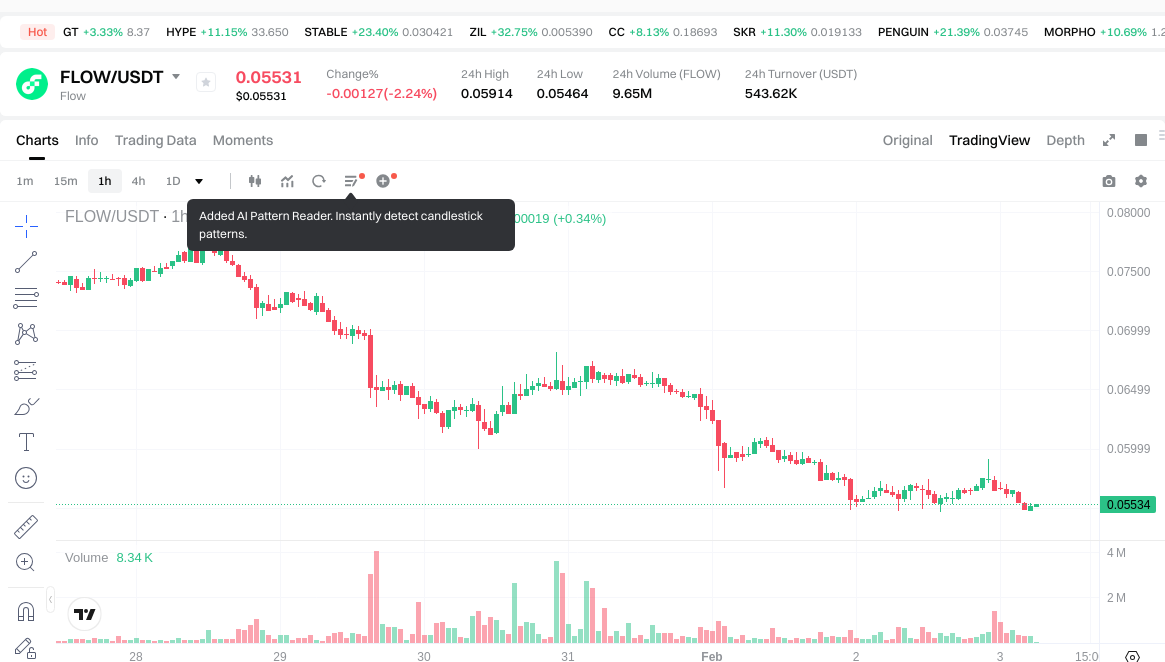
- FLOW Current Price: $0.0552
- 24-Hour Trading Volume: GTAI recorded $18,842.48 compared to FLOW's $544,684.39
- 24-Hour Price Change: GTAI declined 5.62%, while FLOW decreased 2.28%
- Market Capitalization: GTAI stands at approximately $1.18 million with a ranking of #2407, whereas FLOW maintains around $90.46 million at ranking #336
- Circulating Supply: GTAI has 40.58 million tokens in circulation (54.10% of total supply), while FLOW has 1.64 billion tokens circulating (representing over 100% of initial supply metrics)
- Market Sentiment Index (Fear & Greed Index): 14 (Extreme Fear)
View real-time prices:
- Check GTAI current price Market Price
- Check FLOW current price Market Price
II. Core Factors Affecting GTAI vs FLOW Investment Value
Supply Mechanism Comparison (Tokenomics)
- GTAI: Information regarding GTAI's supply mechanism is not available in the provided materials.
- FLOW: Information regarding FLOW's supply mechanism is not available in the provided materials.
Institutional Adoption and Market Application
- Institutional Holdings: The materials do not provide specific information comparing institutional preference between GTAI and FLOW.
- Enterprise Adoption: According to Germany Trade & Invest (GTAI), the organization has been actively assisting international companies with investment projects in Germany since 2004, particularly in sectors such as photovoltaic enterprises. GTAI serves as Germany's foreign trade and regional marketing company, providing support for German companies in international markets. However, specific information regarding enterprise adoption of GTAI or FLOW in cross-border payments, settlements, or investment portfolios is not available.
- National Policies: GTAI benefits from Germany's favorable trade policies and strong international trade relationships. The organization is supported by the German federal government and plays a role in promoting foreign investment in Germany. Information regarding specific regulatory attitudes toward GTAI or FLOW as investment instruments is not available.
Technology Development and Ecosystem Building
- GTAI Technology Development: As a trade and investment promotion agency, GTAI operates within Germany's robust innovation ecosystem, which includes strong industrial infrastructure and research institutions. Germany possesses significant information technology capabilities and has been ranked fifth globally in information technology according to GTAI's 2019 reports.
- FLOW Technology Development: Information regarding FLOW's technology development is not available in the provided materials.
- Ecosystem Comparison: The materials do not provide information for comparing DeFi, NFT, payment systems, or smart contract implementation between GTAI and FLOW.
Macroeconomic Environment and Market Cycles
- Performance in Inflationary Environments: The materials do not provide information comparing GTAI and FLOW's performance characteristics in inflationary environments.
- Macroeconomic Monetary Policy: Germany's economic environment, which influences GTAI's operations, is supported by stable GDP growth and substantial infrastructure investment. The potential market value in certain sectors, such as green building, has been estimated by experts at forums in 2019. However, specific information regarding how interest rates, the US dollar index, or monetary policies affect GTAI or FLOW is not available.
- Geopolitical Factors: GTAI benefits from Germany's strong international trade relationships and its position as a hub for foreign investment in Europe. The organization has facilitated cross-border investment and trade cooperation. Information regarding how geopolitical factors specifically impact GTAI or FLOW as investment instruments is not available.
III. 2026-2031 Price Prediction: GTAI vs FLOW
Short-term Forecast (2026)
- GTAI: Conservative $0.017406 - $0.02901 | Optimistic $0.02901 - $0.0380031
- FLOW: Conservative $0.0309288 - $0.05523 | Optimistic $0.05523 - $0.0585438
Mid-term Forecast (2028-2029)
- GTAI may enter a gradual growth phase, with estimated price range of $0.028638 - $0.049466 in 2028, potentially reaching $0.031630 - $0.044629 by 2029
- FLOW may enter a consolidation phase, with estimated price range of $0.059253 - $0.073907 in 2028, potentially reaching $0.043351 - $0.079820 by 2029
- Key drivers: institutional capital flows, ETF developments, ecosystem expansion
Long-term Forecast (2030-2031)
- GTAI: Baseline scenario $0.032105 - $0.043979 (2030) | Optimistic scenario $0.039128 - $0.051057 (2031)
- FLOW: Baseline scenario $0.050534 - $0.074315 (2030) | Optimistic scenario $0.060604 - $0.096101 (2031)
Disclaimer
GTAI:
| Year | Predicted High Price | Predicted Average Price | Predicted Low Price | Price Change |
|---|---|---|---|---|
| 2026 | 0.0380031 | 0.02901 | 0.017406 | 0 |
| 2027 | 0.040877991 | 0.03350655 | 0.022114323 | 15 |
| 2028 | 0.049465719765 | 0.0371922705 | 0.028638048285 | 27 |
| 2029 | 0.044628864986475 | 0.0433289951325 | 0.031630166446725 | 49 |
| 2030 | 0.0514553481696 | 0.043978930059487 | 0.032104618943425 | 51 |
| 2031 | 0.051057338852561 | 0.047717139114543 | 0.039128054073925 | 64 |
FLOW:
| Year | Predicted High Price | Predicted Average Price | Predicted Low Price | Price Change |
|---|---|---|---|---|
| 2026 | 0.0585438 | 0.05523 | 0.0309288 | 0 |
| 2027 | 0.070539756 | 0.0568869 | 0.036407616 | 3 |
| 2028 | 0.07390746048 | 0.063713328 | 0.05925339504 | 15 |
| 2029 | 0.0798200573184 | 0.06881039424 | 0.0433505483712 | 24 |
| 2030 | 0.098839250286336 | 0.0743152257792 | 0.050534353529856 | 34 |
| 2031 | 0.096100734216372 | 0.086577238032768 | 0.060604066622937 | 56 |
IV. Investment Strategy Comparison: GTAI vs FLOW
Long-term vs Short-term Investment Strategies
-
GTAI: May suit investors focusing on emerging AI-driven DeFi protocols with higher risk tolerance, considering its early-stage market position and substantial price volatility from peak levels. The token's lower market capitalization ranking (#2407) and limited trading volume suggest characteristics associated with speculative, short-to-medium-term positioning rather than established long-term holdings.
-
FLOW: May appeal to investors seeking exposure to established blockchain infrastructure with demonstrated application in digital assets and gaming sectors. With a market capitalization ranking of #336 and substantially higher trading volume, FLOW presents characteristics more aligned with medium-to-long-term strategic allocation for those evaluating mature Layer-1 platforms.
Risk Management and Asset Allocation
-
Conservative Investors: A potential allocation framework might consider 20-30% GTAI vs 70-80% FLOW, emphasizing the more established market position and liquidity profile of FLOW while maintaining limited exposure to GTAI's early-stage potential.
-
Aggressive Investors: A potential allocation framework might consider 40-50% GTAI vs 50-60% FLOW, accepting higher volatility exposure through increased GTAI allocation while maintaining substantial positioning in FLOW's infrastructure narrative.
-
Hedging Instruments: Portfolio risk management may incorporate stablecoin positions for liquidity preservation, options strategies where available for downside protection, and cross-asset diversification across different blockchain ecosystems to mitigate concentration risk.
V. Potential Risk Comparison
Market Risk
-
GTAI: Exhibits substantial volatility characteristics, having declined approximately 99.5% from its peak of $5.4994 to current levels around $0.02907. Limited trading volume of $18,842.48 suggests liquidity constraints that may amplify price movements during market stress periods. The token's relatively low market capitalization ranking indicates exposure to broader market sentiment shifts.
-
FLOW: Demonstrates significant historical volatility, having declined approximately 99.9% from its peak of $42.4 to current levels around $0.0552. While trading volume of $544,684.39 indicates better liquidity conditions than GTAI, the token remains subject to broader cryptocurrency market cycles and sentiment changes, as reflected in the current Extreme Fear index reading of 14.
Technical Risk
-
GTAI: Information regarding specific technical architecture, scalability solutions, and network stability mechanisms is not available in the provided materials.
-
FLOW: Information regarding specific technical risks, including scalability limitations, network stability considerations, or potential security vulnerabilities, is not available in the provided materials.
Regulatory Risk
- Global regulatory developments may impact GTAI and FLOW differently based on their functional classifications. AI-driven trading protocols like GTAI may face scrutiny regarding automated trading mechanisms and potential market manipulation concerns. Blockchain infrastructure platforms like FLOW may encounter regulatory considerations related to digital asset issuance, gaming applications, and platform governance. Evolving regulatory frameworks across different jurisdictions present ongoing uncertainty for both projects.
VI. Conclusion: Which Is the Better Buy?
📌 Investment Value Summary:
-
GTAI Characteristics: Represents exposure to AI-driven DeFi protocol development with early-stage positioning in conversational Web3 interfaces. Current market metrics indicate a smaller-cap asset with limited liquidity, potentially offering higher volatility characteristics for those seeking speculative exposure to emerging AI-crypto convergence narratives.
-
FLOW Characteristics: Represents exposure to established blockchain infrastructure with demonstrated application traction in digital assets and gaming sectors. Current market metrics indicate a mid-cap positioning with relatively better liquidity profile, potentially offering exposure to Layer-1 platform development with focus on mainstream user adoption.
✅ Investment Considerations:
-
New Investors: May consider prioritizing established projects with clearer market positioning and better liquidity profiles. Understanding fundamental blockchain concepts and market dynamics before allocation decisions remains important. Starting with smaller position sizes and gradual exposure building may help manage learning curve risks.
-
Experienced Investors: May evaluate both projects within broader portfolio construction frameworks, considering allocation percentages aligned with individual risk tolerance and investment thesis. Active monitoring of ecosystem developments, trading volumes, and market sentiment indicators may inform position adjustments. Diversification across multiple blockchain ecosystems may help manage concentration risks.
-
Institutional Investors: May assess both projects against institutional due diligence frameworks, including liquidity requirements, custody considerations, regulatory compliance evaluation, and correlation analysis with existing portfolios. FLOW's larger market capitalization and higher trading volumes may present more feasible characteristics for institutional allocation sizing compared to GTAI's current market metrics.
⚠️ Risk Disclosure: Cryptocurrency markets exhibit substantial volatility characteristics. Historical price performance does not indicate future results. This analysis does not constitute investment advice, financial recommendations, or trading guidance. Individuals should conduct independent research, assess personal risk tolerance, and consider consulting qualified financial professionals before making investment decisions.
VII. FAQ
Q1: Which cryptocurrency has better liquidity for trading - GTAI or FLOW?
FLOW demonstrates significantly better liquidity characteristics. FLOW's 24-hour trading volume of $544,684.39 substantially exceeds GTAI's $18,842.48, representing approximately 29 times higher trading activity. Additionally, FLOW's market capitalization of $90.46 million and ranking at #336 indicates a more established market presence compared to GTAI's $1.18 million market cap at ranking #2407. Higher liquidity generally enables easier entry and exit positions with reduced slippage risk during trading execution.
Q2: What are the primary use cases distinguishing GTAI from FLOW?
GTAI and FLOW serve fundamentally different blockchain ecosystem functions. GTAI positions itself as an AI-driven portfolio management and trading execution protocol, focusing on conversational AI interfaces for Web3 interactions across CeFi, DeFi, and NFT markets. FLOW operates as a Layer-1 blockchain infrastructure platform designed for next-generation applications and digital assets, with particular emphasis on gaming and mainstream user adoption. This distinction reflects GTAI's specialization in trading automation versus FLOW's broader platform infrastructure approach.
Q3: How have GTAI and FLOW performed relative to their all-time high prices?
Both assets have experienced substantial declines from peak levels. GTAI has declined approximately 99.5% from its March 2024 high of $5.4994 to current levels around $0.02907. FLOW has decreased approximately 99.9% from its April 2021 peak of $42.4 to current levels around $0.0552. These significant retracement patterns reflect broader cryptocurrency market cycle dynamics and emphasize the high volatility characteristics inherent in digital asset markets, particularly during extended bear market periods.
Q4: What allocation strategy might suit conservative versus aggressive investors?
Conservative investors might consider a potential allocation framework of 20-30% GTAI versus 70-80% FLOW, emphasizing FLOW's more established market position, higher liquidity profile, and larger market capitalization. Aggressive investors might evaluate a potential allocation framework of 40-50% GTAI versus 50-60% FLOW, accepting higher volatility exposure through increased GTAI allocation while maintaining substantial positioning in FLOW's infrastructure narrative. These frameworks should be customized based on individual risk tolerance, investment timeframe, and portfolio diversification objectives.
Q5: What are the key price prediction differences between GTAI and FLOW for 2026?
For 2026, GTAI's conservative forecast ranges from $0.017406 to $0.02901, with an optimistic scenario extending to $0.0380031. FLOW's conservative forecast ranges from $0.0309288 to $0.05523, with an optimistic scenario reaching $0.0585438. FLOW's predicted prices remain higher in absolute terms, though both assets exhibit similar percentage volatility ranges. These predictions should be interpreted as analytical frameworks rather than guaranteed outcomes, as cryptocurrency markets remain subject to numerous unpredictable variables.
Q6: What is the current market sentiment affecting both GTAI and FLOW?
The current Fear & Greed Index reading of 14 indicates "Extreme Fear" conditions in the cryptocurrency market as of February 3, 2026. This sentiment metric suggests heightened risk aversion among market participants, which typically correlates with selling pressure, reduced trading volumes, and negative price momentum across digital assets. Both GTAI and FLOW have experienced negative 24-hour price changes (GTAI -5.62%, FLOW -2.28%) reflecting this broader market sentiment environment. Extreme fear conditions historically present both elevated risk and potential opportunity depending on individual investment strategies.
Q7: What are the main risks investors should consider when comparing GTAI and FLOW?
Primary risks include market volatility risk, with both assets demonstrating substantial historical price declines from peak levels. Liquidity risk affects GTAI more significantly given its lower trading volume and market capitalization. Technical risks involve potential vulnerabilities in protocol architecture, though specific details are not available in current materials. Regulatory risk encompasses evolving global frameworks that may impact AI-driven trading protocols and blockchain infrastructure platforms differently. Additionally, both projects face competitive risk from alternative blockchain ecosystems and technological obsolescence concerns in rapidly evolving sectors.
Q8: How do circulating supply metrics compare between GTAI and FLOW?
GTAI has 40.58 million tokens in circulation, representing 54.10% of its total supply, indicating substantial locked or unreleased tokens that may enter circulation in future periods. FLOW has 1.64 billion tokens circulating, representing over 100% of initial supply metrics, suggesting potential token burn mechanisms, staking programs, or supply adjustment mechanisms. The different supply dynamics may influence future price movements, as unreleased GTAI tokens entering circulation could create selling pressure, while FLOW's supply characteristics may indicate more mature tokenomics implementation. Investors should monitor supply release schedules and tokenomics developments for both projects.
Share
Content
Introduction: Investment Comparison Between GTAI and FLOW
I. Historical Price Comparison and Current Market Status
II. Core Factors Affecting GTAI vs FLOW Investment Value
III. 2026-2031 Price Prediction: GTAI vs FLOW
IV. Investment Strategy Comparison: GTAI vs FLOW
V. Potential Risk Comparison
VI. Conclusion: Which Is the Better Buy?
VII. FAQ
How to Buy Cryptocurrency


Trending Cryptocurrencies


What will be the market capitalization of USDC in 2025? Analysis of the stablecoin market landscape.

How is DeFi different from Bitcoin?

What is DeFi: Understanding Decentralized Finance in 2025
USDC stablecoin 2025 Latest Analysis: Principles, Advantages, and Web3 Eco-Applications

Development of Decentralized Finance Ecosystem in 2025: Integration of Decentralized Finance Applications with Web3
2025 USDT USD Complete Guide: A Must-Read for Newbie Investors

Top 5 Tokens Recommended for DeFi Investment

Top 3 Solutions for Earning Free Cryptocurrency
Cryptocurrency Exchanges Without Verification: An Up-to-Date Guide to the Best Choices
What distinguishes Layer 1 from Layer 2?

Comprehensive Guide to Gary Gensler and SEC Cryptocurrency Regulation