Master Japanese candlestick analysis like a professional and explore the most well-known patterns with real-world examples
What Are Japanese Candlesticks?
Japanese candlesticks are a time-honored technical analysis tool that originated in 17th-century Japanese rice markets. Today, they are one of the most essential technical indicators used by traders worldwide to forecast the future movements of financial assets, including cryptocurrencies, stocks, and commodities.
By studying candlestick patterns on charts, traders can interpret market psychology and anticipate upcoming price movements. Candlesticks reflect investor behavior and their reactions to price changes, making them a powerful resource for reading market sentiment and making informed trading decisions. The true strength of Japanese candlesticks lies in their ability to visually distill complex price action into an intuitive format.
How to Read Japanese Candlesticks
Each Japanese candlestick on a chart contains valuable information about price action over a specific time period. To read them correctly, you should understand these key components:
- High: The highest price reached during the candlestick’s time frame
- Low: The lowest price reached during the same period
- Close: The final price at the end of the interval
- Open: The initial price at the start of the interval
- Volume: The amount of the asset traded during the candlestick’s lifespan, indicating the strength of buying or selling pressure
Grasping these five elements enables you to interpret market activity more precisely and supports better trading decisions based on actual data.
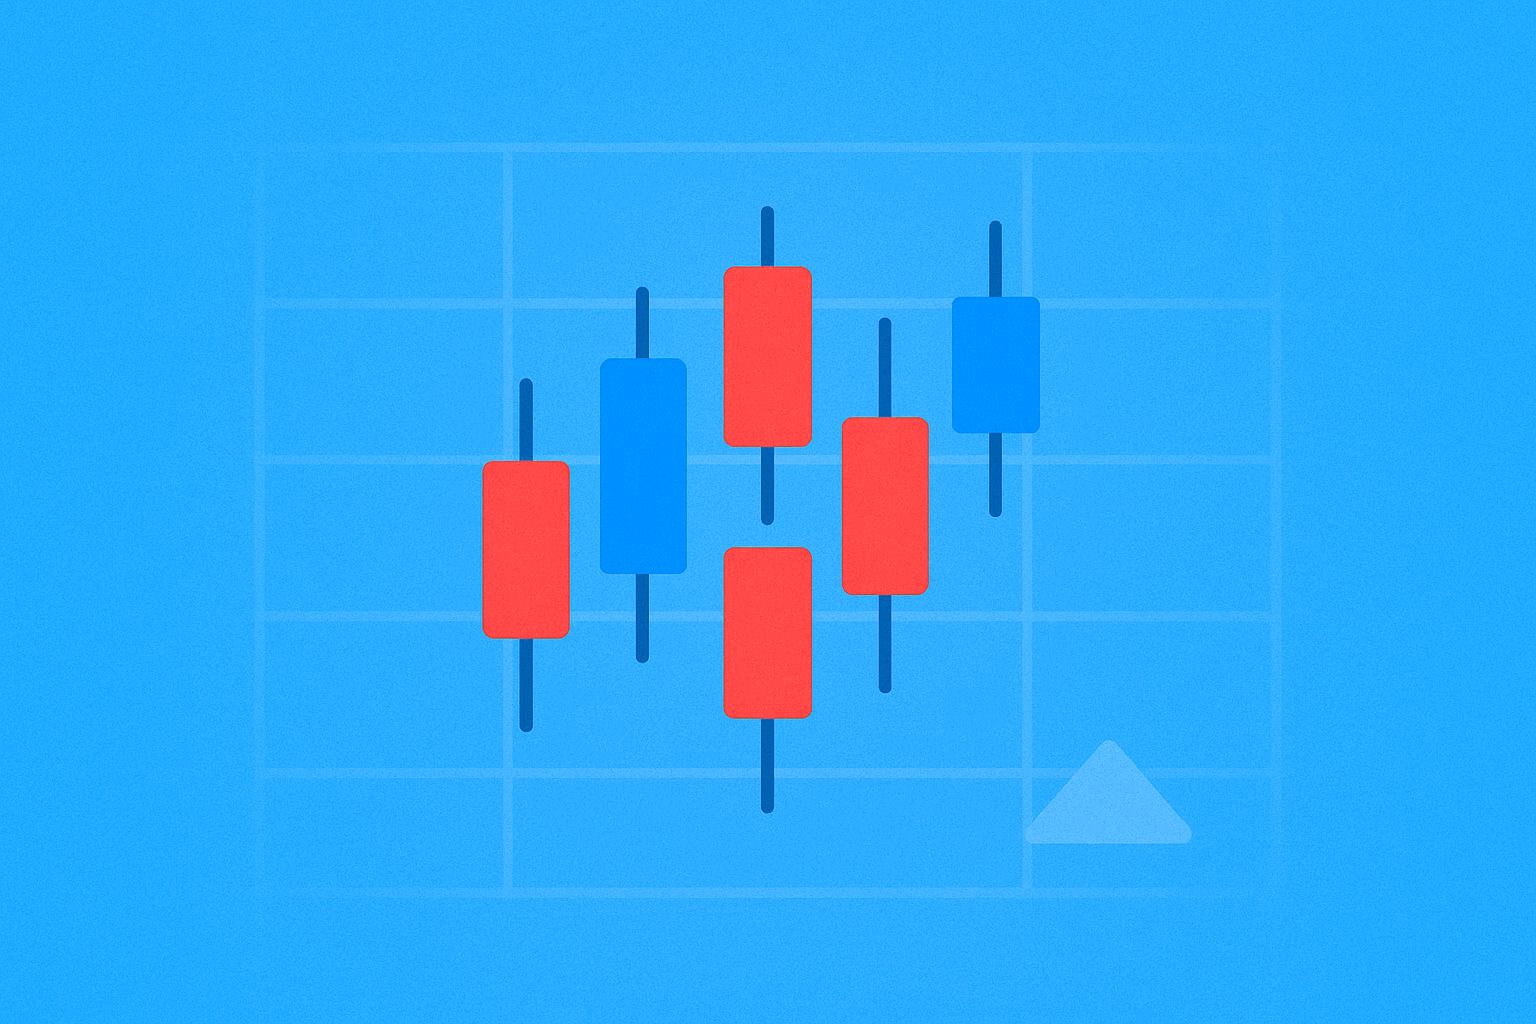
Candlestick Color and Its Significance
The color of a candlestick carries important meaning in technical analysis:
- Green (or White): Shows the closing price is higher than the opening price, indicating the price increased during the period. This reflects strong buying pressure in the market.
- Red (or Black): Shows the closing price is lower than the opening price, indicating a price decrease. This reflects strong selling pressure.
It’s important to note that color intensity and the size of the candlestick body reveal the strength of the price movement and the degree of control by buyers or sellers.
Components of a Japanese Candlestick
A Japanese candlestick consists of several components, each conveying crucial information:
-
Body: The wide portion of the candlestick representing the distance between the open and close. A large green body signals strong buying pressure, while a large red body signals strong selling pressure. A small body indicates market indecision and an unclear direction.
-
Wick/Shadow: The thin line extending above and below the body. The upper wick marks the highest price, while the lower wick marks the lowest. Wick length shows the intensity of the struggle between buyers and sellers. A long wick suggests significant price rejection at those levels.
-
Open: The price at which the candlestick period begins.
-
Close: The price at which the candlestick period ends.
Understanding these components helps you interpret the full narrative of price action during the candlestick’s interval.
Candlestick Time Frame and Its Relevance
Every Japanese candlestick has a set time interval—from open to close—which could be a minute, five minutes, an hour, a day, a week, or even a month.
The longer the candlestick’s time frame, the more impactful and reliable it is in determining the overall market trend. For example:
- Daily candlesticks: Offer comprehensive insights into price movement and are most reliable for medium- and long-term traders
- Hourly candlesticks: Useful for day traders seeking short-term opportunities
- Minute candlesticks: Common in high-frequency trading but more susceptible to market noise and random fluctuations
Choosing the right time frame depends on your trading strategy and investment objectives.
Key Japanese Candlestick Patterns for Crypto Trading
There are numerous Japanese candlestick patterns that can help you anticipate market moves. Below are the most important patterns every crypto trader should know:
Hammer Candlestick
The hammer candlestick is a bullish reversal pattern that typically emerges at the end of a downtrend. It is characterized by a small body at the top and a long lower wick at least twice as long as the body.
The logic behind the hammer candlestick: The price starts relatively high, then strong selling pressure pushes it down sharply. At the point of panic, buyers step in forcefully and drive the price back up near the opening. This shift indicates sellers have lost control while buyers begin to dominate.
The hammer is a strong signal for a potential trend reversal and the start of a recovery phase. If it appears after a sustained downtrend, it often signals the end of bearish momentum and the beginning of a rally. For confirmation, it’s best to wait for a green confirmation candle in the next interval.
Bullish Engulfing Candlestick
The bullish engulfing pattern is one of the strongest reversal patterns in technical analysis. It consists of two candles: a small red candle followed by a large green candle that fully engulfs the red one.
This pattern often appears at the end of a downtrend and is a clear sign of a market sentiment shift. The large green body represents significant buying pressure, showing buyers have overtaken sellers.
This pattern’s reliability increases on longer time frames, such as daily or weekly charts. In crypto, spotting this pattern can indicate a strong buying opportunity, especially if accompanied by high volume. Experienced traders wait for confirmation before taking action.
Bearish Engulfing Candlestick
The bearish engulfing pattern is the exact opposite and is a strong indicator of a reversal from bullish to bearish momentum. It consists of a small green candle followed by a large red candle that engulfs the green one completely.
This pattern appears at the end of an uptrend, signaling strong rejection of higher prices. The large red candle indicates heavy selling pressure, suggesting investors believe the asset is overvalued and due for a pullback.
In crypto’s volatile environment, this pattern can warn of a sharp downturn. Skilled traders use it to lock in profits, exit long positions, or enter shorts if their strategy permits. Waiting for a confirming red candle is important to validate the signal.
Morning Star Candle
The Morning Star is one of the most dependable bullish reversal patterns. It involves three consecutive candles:
- First candle: Large red candle continuing the downtrend
- Second candle: Small candle (red or green) showing indecision and weakening selling pressure
- Third candle: Large green candle closing above the midpoint of the first, confirming the reversal
This pattern illustrates a gradual shift in sentiment. The small middle candle marks equilibrium between buyers and sellers as selling weakens. The third large green candle confirms buyers have taken control.
The morning star typically appears at the end of a downtrend and reliably marks the start of a new upward phase. In crypto, this pattern often signals an excellent buying opportunity, especially after a sharp price decline.
Shooting Star Candlestick
The shooting star is a bearish reversal pattern formed by a single candle. It features a small body at the bottom and a long upper wick at least twice the body’s length, with little or no lower wick.
This pattern often appears at the end of an uptrend and serves as a strong warning of a potential reversal. The rationale: Price surges to new highs, but sellers step in and drive it back near the open. This reflects forceful rejection of higher prices and waning buying strength.
In the crypto market, the shooting star is a prime signal for profit-taking. If you’re holding a long position and spot this candle, it may be time to exit and secure profits before a downturn. Professionals wait for a confirming red candle before selling.
Crypto Market Volatility and Instability
The crypto market has unique characteristics that set it apart from traditional finance. With varying liquidity and relatively smaller market capitalization, the crypto market experiences high volatility and sharp price swings in short timeframes.
This volatility means Japanese candlestick patterns may appear frequently, but not all are equally reliable. It’s critical to read the broader market context and understand the story behind the candlesticks instead of relying solely on memorized patterns.
High volatility creates opportunities for rapid gains but also carries significant risks. Crypto traders should exercise extra caution and apply strict risk management when trading based on candlestick patterns.
Candlesticks Alone Don’t Offer the Whole Picture
Technical analysis with Japanese candlesticks is a strong tool, but it’s not sufficient by itself for consistently successful trading. Consider the full market landscape and factor in other elements:
-
What is the dominant trend across various time frames?: Analyze longer time frames (daily, weekly) to understand the overall trend before making decisions based on lower intervals.
-
Are there relevant updates or news for the crypto asset and its project?: Positive news—like new partnerships or technical upgrades—can drive prices up regardless of chart patterns, and the opposite is true for negative news.
-
What are global economic conditions?: Major events such as interest rate decisions and inflation data impact all financial markets, including crypto.
-
What are the geopolitical factors?: Political events and international tensions can shift investor sentiment and capital flows in or out of digital assets.
-
Trading volume: Always consider the volume accompanying candlestick patterns. Patterns confirmed by high volume are more reliable than those with low volume.
Successful traders blend technical analysis (candlesticks and technical indicators) with fundamental analysis (news and developments) to make well-informed decisions.
Mastering Candlestick Analysis Requires Practice
Understanding and interpreting Japanese candlesticks is not just theoretical—it’s a practical skill that takes years of consistent experience to truly master.
The best way to develop this expertise is by analyzing as many charts as possible on a daily basis. Every chart tells a unique story about the ongoing battle between buyers and sellers, and the emotions of fear and greed that drive price action. Over time, you’ll start to recognize recurring patterns and the contexts in which they appear.
Begin by studying historical charts and predicting what happened after certain patterns formed. Compare your expectations to actual outcomes. This will help you distinguish reliable from misleading signals.
Keep a journal of your trades and candlestick-based decisions. Review your log regularly to identify mistakes and strengths. Learning from errors is a core part of every successful trader’s growth.
Remember, the ultimate goal is not just to spot candlestick patterns, but to understand the narrative they reveal about the market. Once you can read these stories clearly, you’ll be able to achieve consistent profits and avoid major losses.
FAQ
What are Japanese candlesticks, and what do their components (open, close, high, low) represent?
Japanese candlesticks display price action over a given period. The body represents the opening and closing prices; the wicks show the high and low. Color indicates whether prices rose (white) or fell (black).
What are the most popular bullish Japanese candlestick patterns and their features?
Popular bullish patterns include the hammer and morning star. The hammer features a long lower shadow and a small body. The morning star forms after a decline with three candles: the first is bearish, the second is a small body, and the third is strongly bullish, closing above the midpoint of the first.
What are common bearish Japanese candlestick patterns, and how do you identify reversal signals like the shooting star and evening star?
The shooting star forms after an uptrend with a long upper wick and a small body, indicating waning buying pressure. The evening star forms after a price increase with three consecutive candles, signaling a strong bearish reversal.
How do you distinguish between filled and hollow candlesticks? What does each indicate in the market?
Filled candlesticks show the close is higher than the open, reflecting a strong bullish trend. Hollow candlesticks show the close is lower than the open, reflecting a bearish trend.
What’s the difference between single-candle and multi-candle patterns? Why is it important to combine multiple time frames in analysis?
A single candlestick reflects one day’s price action, while multi-candle patterns reveal market direction over several days. Using multiple time frames helps you identify trends and reversals more accurately and produces more reliable signals.
Is it safe to place orders based solely on Japanese candlestick patterns? What other indicators and tools should you use?
No, relying only on candlestick patterns isn’t safe. You should combine them with other technical indicators such as moving averages and RSI to increase trade signal accuracy and your chances of success.
Does Japanese candlestick analysis apply to all financial markets? Can it be used for stocks, forex, and crypto?
Yes, candlestick analysis applies to all financial markets including stocks, forex, and cryptocurrencies. The OHLC structure is consistent across all asset types and time frames.
How long does it take for beginners to master Japanese candlesticks? What are the most common learning mistakes?
It takes several months of ongoing practice to master Japanese candlesticks. Common mistakes include neglecting risk management, relying on a single pattern, and lacking patience. Focus on core principles before moving to advanced strategies.
Share
Content
How to Buy Cryptocurrency


Trending Cryptocurrencies


How to Withdraw Money from Crypto Exchanges in 2025: A Beginner's Guide

5 ways to get Bitcoin for free in 2025: Newbie Guide

Treasure NFT Marketplace: A 2025 Guide for Web3 Gamers and Investors

What Is TOAD Coin and How Does Its Tokenomics Work?

Crypto Assets Beginner's Guide: How to Buy, Store, and Trade Your First Crypto Coin
What Is the Best AI Crypto in 2025?
Hamster Kombat Overview: Essential Information on This Popular Game
What is DYP: A Comprehensive Guide to Understanding Decentralized Yield Protocol and Its Impact on DeFi
What is CORL: A Comprehensive Guide to Collaborative Online Research and Learning
What is MUSE: A Comprehensive Guide to Multi-Scale Unsupervised Sentence Embeddings
What is EGG: A Comprehensive Guide to Understanding Egg Nutrition, Benefits, and Culinary Uses