OVER vs THETA: A Comprehensive Comparison of Two Leading Decentralized Video Streaming Platforms


Introduction: Investment Comparison Between OVER and THETA
In the cryptocurrency market, the comparison between OVER vs THETA continues to be a significant topic for investors. These two assets demonstrate notable differences in market cap ranking, application scenarios, and price performance, representing distinct positioning within the crypto asset landscape.
OVER (OVER): Launched in 2024, OverProtocol positions itself as a Layer 1 blockchain enabling individuals to run full nodes on personal computers through the OverScape application, creating opportunities in decentralized validation and P2P financial networks.
THETA (THETA): Introduced in 2017, Theta Network has established itself as a decentralized video streaming platform utilizing blockchain technology to incentivize bandwidth sharing and reduce content distribution costs.
This article will comprehensively analyze the investment value comparison between OVER vs THETA across multiple dimensions including historical price trends, supply mechanisms, technical ecosystems, and future outlook, attempting to address investors' primary concern:
"Which is the better buy right now?"
I. Historical Price Comparison and Current Market Status
OverProtocol (OVER) and Theta Network (THETA) Historical Price Trends
- 2024: OVER launched in December 2024 at a debut price of $0.1, with price experiencing notable volatility in its initial trading period.
- 2021: THETA reached a notable price level of $15.72 in April 2021, reflecting significant market interest during that period.
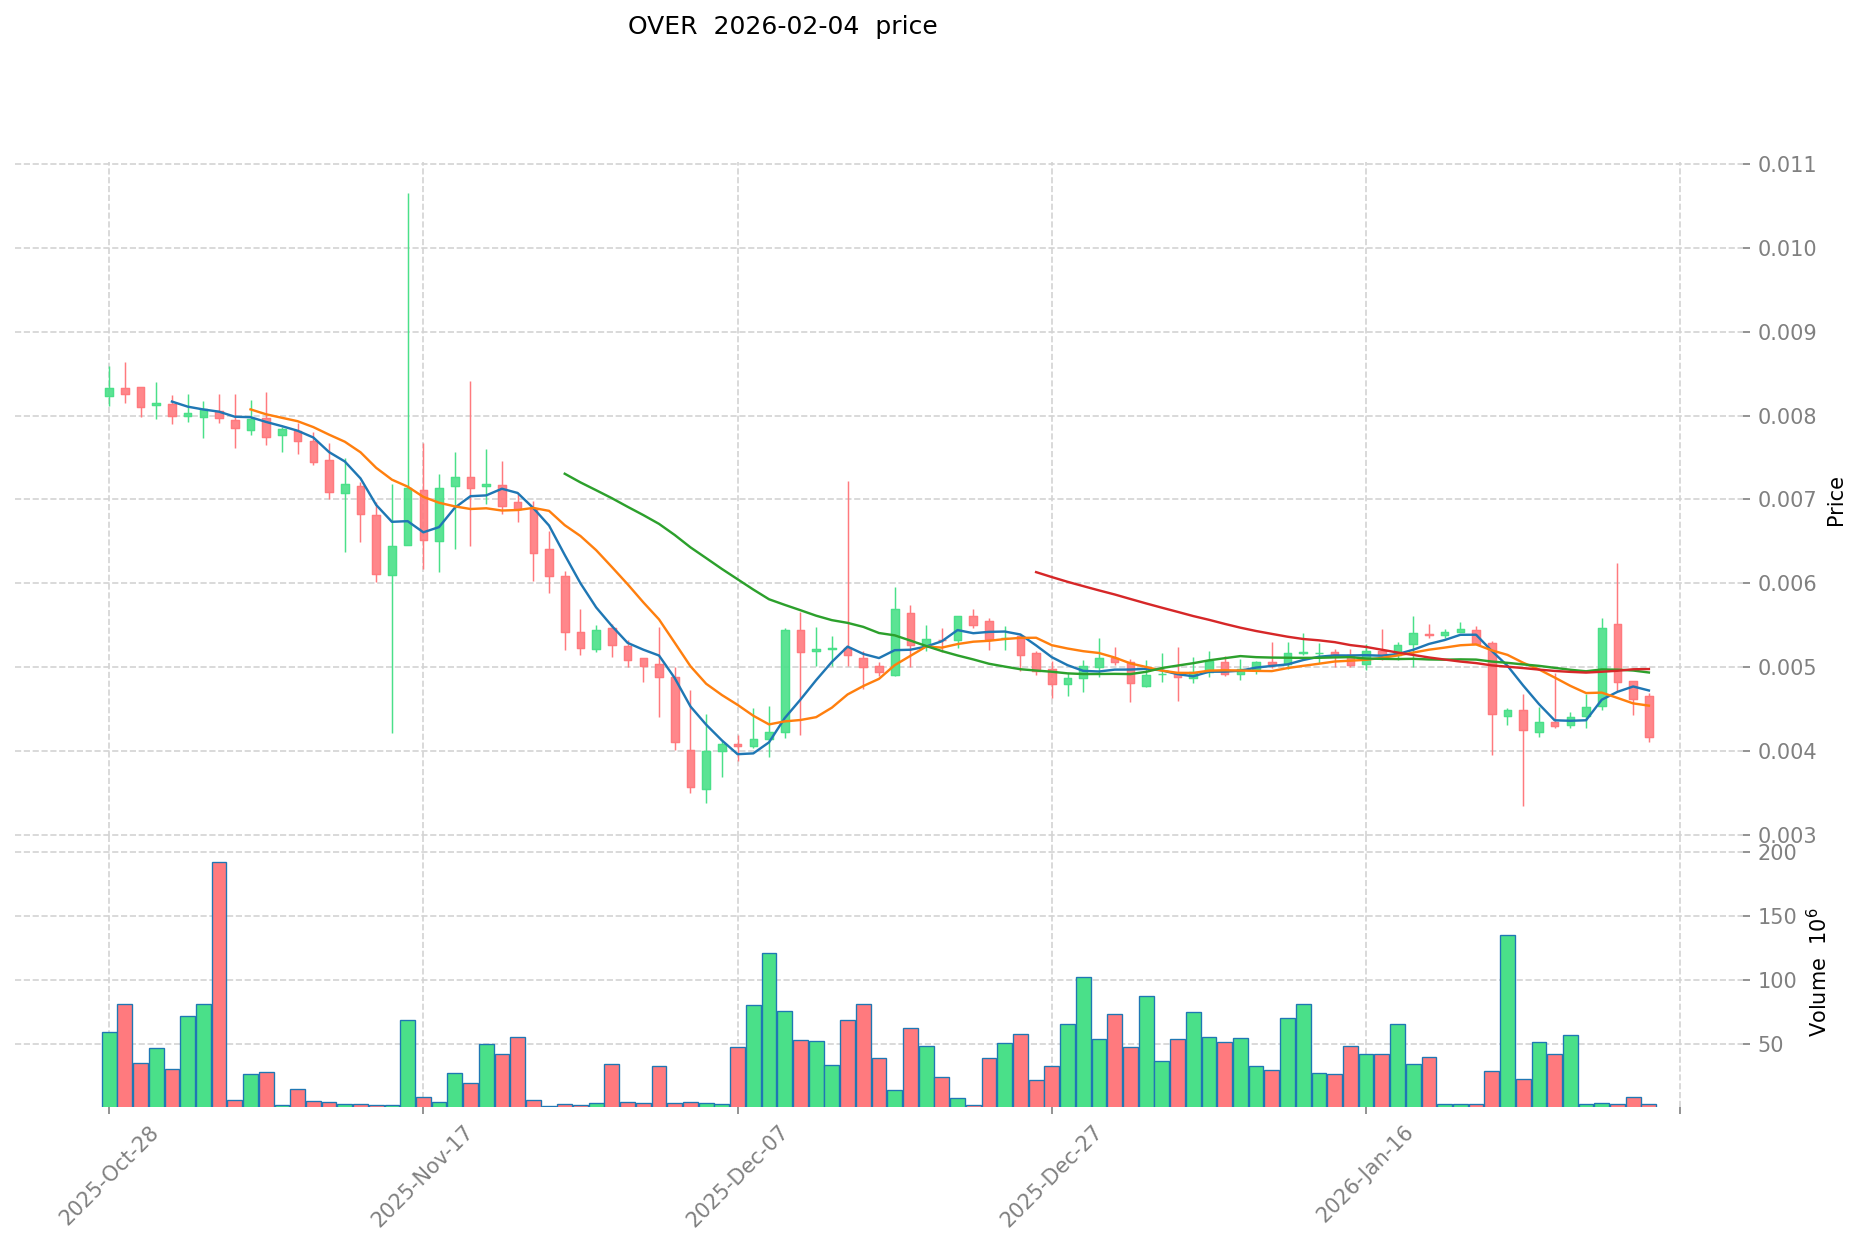
- Comparative Analysis: OVER experienced a decline from its all-time high of $0.4 (December 2024) to a lower level of $0.003338 (January 2026), while THETA showed a pattern of decline from $15.72 (April 2021) to $0.04039979 at a different market phase.
Current Market Landscape (2026-02-04)
- OVER Current Price: $0.004266
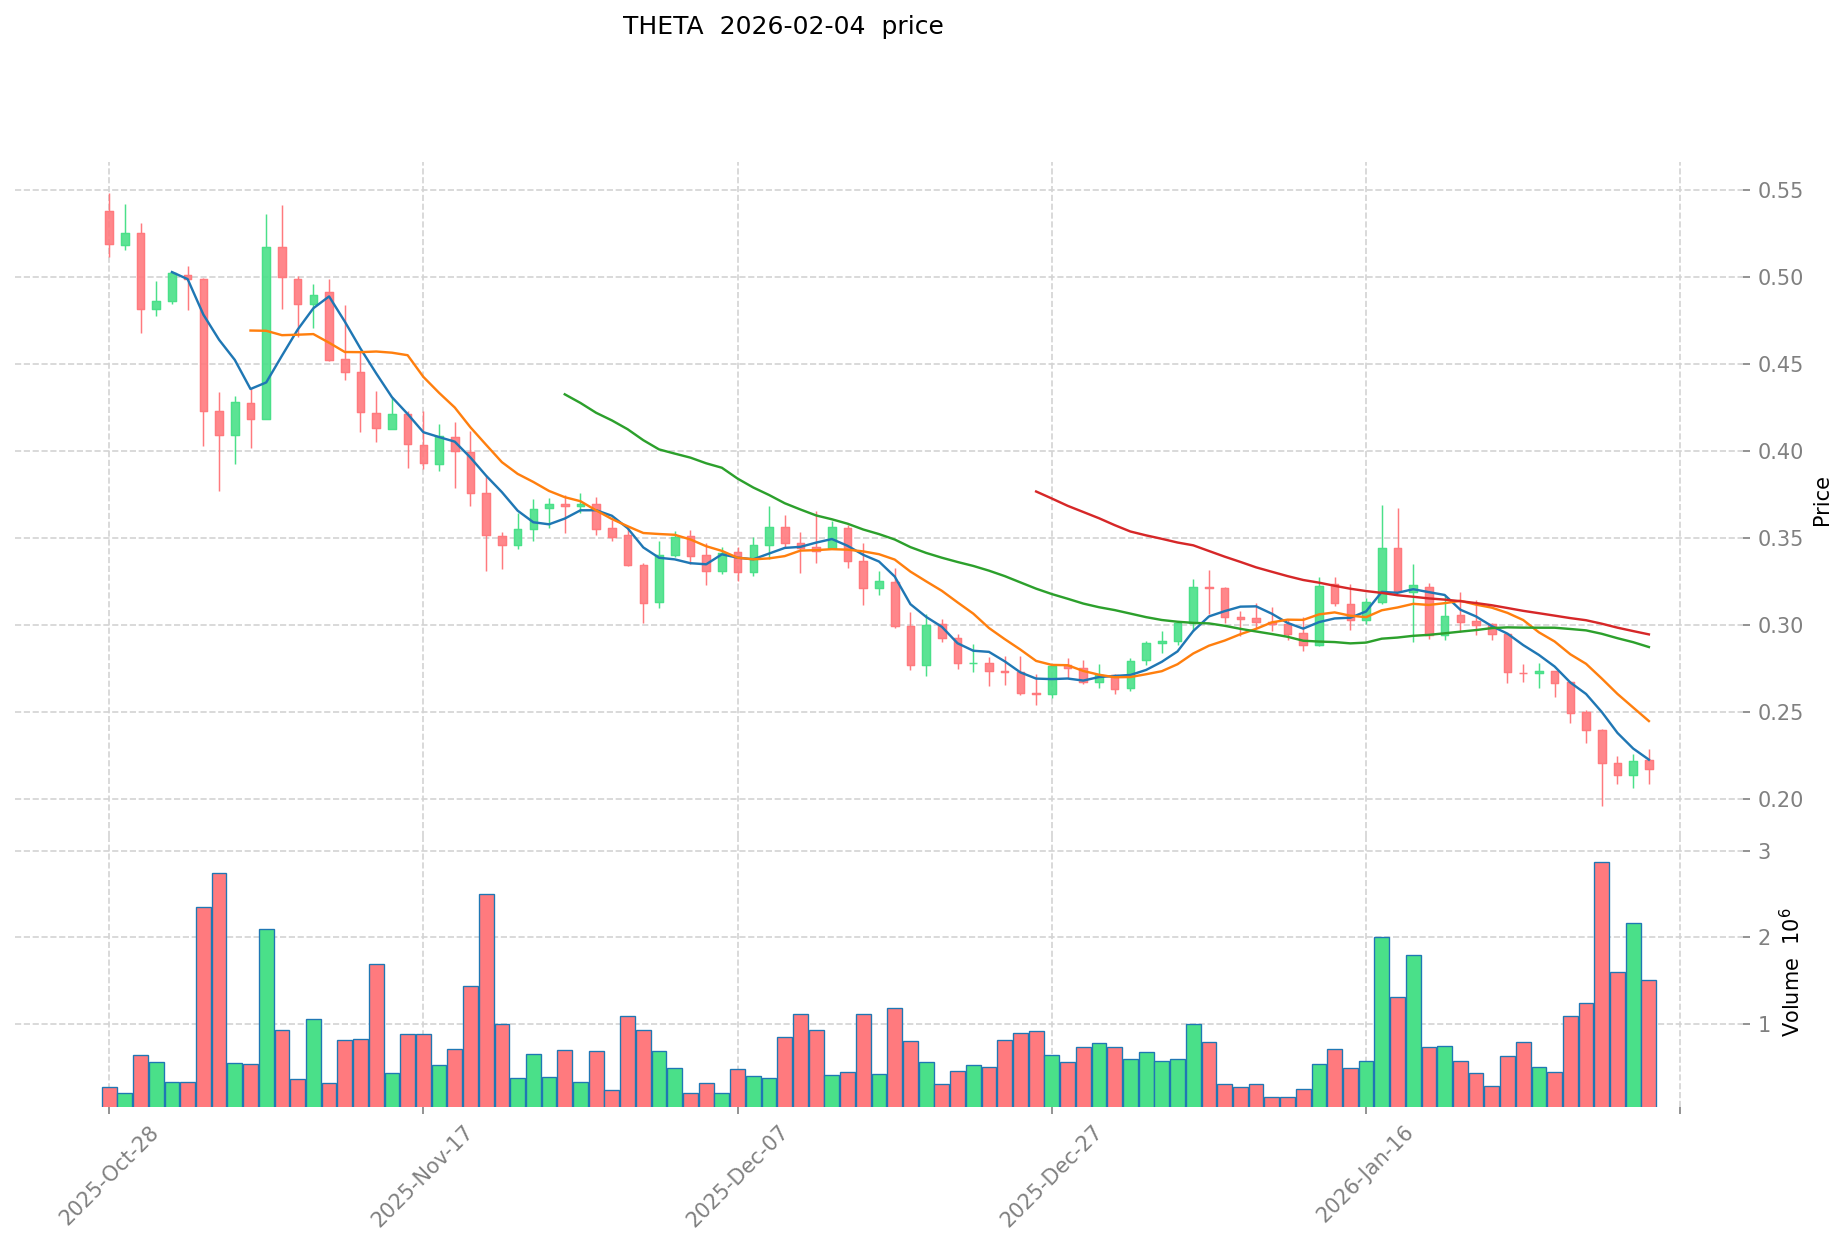
- THETA Current Price: $0.2166
- 24-Hour Trading Volume: OVER $13,916.47 vs THETA $329,752.93
- Market Sentiment Index (Fear & Greed Index): 17 (Extreme Fear)
View Real-Time Prices:
- Check OVER Current Price Market Price
- Check THETA Current Price Market Price
II. Core Factors Influencing OVER vs THETA Investment Value
Supply Mechanism Comparison (Tokenomics)
The fundamental supply mechanics of these assets present distinct characteristics that may influence their long-term value trajectories. Traditional options pricing theory, as reflected in theta metrics, demonstrates that time decay operates as a constant erosive force on option premiums. In contrast, cryptocurrency tokenomics can incorporate various supply adjustment mechanisms.
- OVER: Specific supply mechanism details were not available in the reference materials for detailed analysis.
- THETA: The theta parameter in options pricing represents time value decay, typically expressed as a negative value indicating daily value erosion. For example, an option priced at 7.5 with a theta of 0.02 would decline to 7.48 after one day, and to 7.46 after two days, demonstrating systematic time-based value reduction.
- 📌 Historical Pattern: Time decay acceleration occurs as options approach expiration, with at-the-money options experiencing higher theta values. This decay rate can increase from 0.02 daily in March to 0.06 daily by August for September expiration options, illustrating non-linear value deterioration.
Institutional Adoption and Market Application
- Institutional Holdings: The reference materials did not contain specific comparative data on institutional preference between these assets.
- Enterprise Adoption: Application scenarios in cross-border payments, settlement systems, and investment portfolios were not detailed in the provided materials.
- National Policies: Regulatory approaches across different jurisdictions were not covered in the available reference materials.
Technological Development and Ecosystem Construction
- OVER Technical Upgrades: Specific technical development information was not available in the reference materials.
- THETA Technical Development: In options markets, theta measurement represents sensitivity to time passage, with the metric showing dynamic behavior across different strike prices. At-the-money options exhibit higher theta values, while deep in-the-money or out-of-the-money options display lower time decay rates. As expiration approaches, theta's absolute value increases for at-the-money positions while decreasing for deep positions.
- Ecosystem Comparison: The reference materials discussed options market structure, including analysis of zero-day-to-expiration (0DTE) options and their impact on market stability and volatility mechanisms. However, specific comparisons regarding DeFi, NFT, payment systems, or smart contract implementations were not provided.
Macroeconomic Environment and Market Cycles
- Performance in Inflationary Environments: The materials did not contain specific comparative analysis of inflation-hedging properties.
- Macroeconomic Monetary Policy: Options pricing demonstrates sensitivity to multiple factors including underlying asset price movements and market volatility. The GARCH-MIDAS model framework referenced in the materials analyzes how economic policy uncertainty and investor sentiment affect volatility in commodity markets, suggesting broader macroeconomic factors influence derivative instrument valuations. However, specific impacts of interest rates or dollar index movements on these particular assets were not detailed.
- Geopolitical Factors: Cross-border transaction demand and international situation impacts were not specifically addressed in the reference materials.
III. 2026-2031 Price Prediction: OVER vs THETA
Short-term Forecast (2026)
- OVER: Conservative $0.0036 - $0.0043 | Optimistic $0.0043 - $0.0047
- THETA: Conservative $0.15 - $0.22 | Optimistic $0.22 - $0.29
Mid-term Forecast (2028-2029)
- OVER may enter a gradual growth phase, with estimated price range of $0.0040 - $0.0058
- THETA may enter an expansion phase, with estimated price range of $0.19 - $0.52
- Key drivers: institutional capital inflows, ETF developments, ecosystem growth
Long-term Forecast (2030-2031)
- OVER: Baseline scenario $0.0046 - $0.0078 | Optimistic scenario $0.0064 - $0.0091
- THETA: Baseline scenario $0.35 - $0.51 | Optimistic scenario $0.48 - $0.50
Disclaimer
OVER:
| Year | Predicted High Price | Predicted Average Price | Predicted Low Price | Price Change |
|---|---|---|---|---|
| 2026 | 0.0046926 | 0.004266 | 0.00358344 | 0 |
| 2027 | 0.004792851 | 0.0044793 | 0.003896991 | 5 |
| 2028 | 0.005609651355 | 0.0046360755 | 0.004033385685 | 8 |
| 2029 | 0.005788835673075 | 0.0051228634275 | 0.003637233033525 | 20 |
| 2030 | 0.007801864856911 | 0.005455849550287 | 0.004637472117744 | 27 |
| 2031 | 0.009147822940967 | 0.006628857203599 | 0.006363702915455 | 55 |
THETA:
| Year | Predicted High Price | Predicted Average Price | Predicted Low Price | Price Change |
|---|---|---|---|---|
| 2026 | 0.291718 | 0.2177 | 0.150213 | 0 |
| 2027 | 0.37951641 | 0.254709 | 0.13244868 | 17 |
| 2028 | 0.4503000411 | 0.317112705 | 0.18709649595 | 46 |
| 2029 | 0.521840667348 | 0.38370637305 | 0.3261504170925 | 77 |
| 2030 | 0.50710634262288 | 0.452773520199 | 0.34863561055323 | 109 |
| 2031 | 0.503936927981487 | 0.47993993141094 | 0.31676035473122 | 121 |
IV. Investment Strategy Comparison: OVER vs THETA
Long-term vs Short-term Investment Strategies
- OVER: May appeal to investors focused on emerging Layer 1 infrastructure and decentralized node operation models, with consideration for higher volatility tolerance given its recent market entry and price fluctuation patterns.
- THETA: May suit investors interested in established decentralized content delivery networks and video streaming applications, with a longer operational history since 2017 providing more historical performance data for analysis.
Risk Management and Asset Allocation
- Conservative Investors: OVER 20-30% vs THETA 70-80%, reflecting THETA's longer operational track record and more established market presence.
- Aggressive Investors: OVER 50-60% vs THETA 40-50%, allowing for greater exposure to emerging infrastructure projects while maintaining diversification.
- Hedging Instruments: Stablecoin allocation for liquidity management, options strategies for downside protection, cross-asset portfolio construction to reduce correlation risk.
V. Potential Risk Comparison
Market Risks
- OVER: Limited price history since December 2024 launch creates uncertainty in establishing support and resistance levels; 24-hour trading volume of $13,916.47 suggests relatively lower liquidity compared to more established assets.
- THETA: Historical price decline from April 2021 levels demonstrates susceptibility to broader market cycles; current trading volume of $329,752.93 indicates moderate market activity.
Technical Risks
- OVER: Scalability considerations for personal computer-based full node operations; network stability assessment requires longer operational observation period.
- THETA: Infrastructure dependencies for bandwidth sharing mechanisms; potential challenges in content delivery network coordination and participant incentive alignment.
Regulatory Risks
Global regulatory frameworks continue to evolve regarding blockchain infrastructure and content delivery platforms, with potential differential impacts on node operation requirements versus streaming service classifications across various jurisdictions.
VI. Conclusion: Which Is the Better Buy?
📌 Investment Value Summary:
- OVER Characteristics: Represents emerging Layer 1 blockchain infrastructure with personal computer node operation model; shorter operational history provides limited long-term performance data.
- THETA Characteristics: Established decentralized video streaming platform with operational history since 2017; demonstrates specific use case in content delivery and bandwidth optimization.
✅ Investment Considerations:
- Beginning Investors: Consider starting with smaller position sizes while monitoring market development and price stability patterns; prioritize understanding fundamental project mechanics before allocation decisions.
- Experienced Investors: Evaluate portfolio diversification benefits across different blockchain infrastructure models; assess risk-reward profiles based on historical volatility patterns and trading volume characteristics.
- Institutional Investors: Conduct comprehensive due diligence on operational sustainability, ecosystem development trajectories, and regulatory compliance frameworks before capital deployment.
⚠️ Risk Disclosure: Cryptocurrency markets exhibit high volatility characteristics. This content does not constitute investment advice. Market participants should conduct independent research and consider individual risk tolerance before making allocation decisions.
VII. FAQ
Q1: What is the primary difference between OVER and THETA's core functionality?
OVER operates as a Layer 1 blockchain enabling individuals to run full nodes on personal computers through the OverScape application, focusing on decentralized validation and P2P financial networks. THETA, conversely, functions as a decentralized video streaming platform that incentivizes bandwidth sharing to reduce content distribution costs. The fundamental distinction lies in their application domains—OVER targets blockchain infrastructure accessibility while THETA addresses content delivery optimization through blockchain technology.
Q2: How do the historical price trajectories of OVER and THETA compare?
THETA demonstrates a more established price history, having reached $15.72 in April 2021 before declining to current levels around $0.2166. OVER, launched in December 2024, shows a shorter price history with an initial debut at $0.1, reaching an all-time high of $0.4 before declining to approximately $0.004266. THETA's longer operational period since 2017 provides substantially more historical data for technical analysis compared to OVER's limited trading history.
Q3: What are the key risk differences between investing in OVER versus THETA?
OVER presents higher uncertainty risk due to its recent market entry in December 2024, limited price history, and lower 24-hour trading volume of $13,916.47, which indicates relatively restricted liquidity. THETA carries different risk characteristics including demonstrated susceptibility to broader market cycles (evidenced by its decline from 2021 peaks) and infrastructure dependencies for its bandwidth sharing mechanism, though it benefits from higher trading volume ($329,752.93) and longer operational validation since 2017.
Q4: Which asset demonstrates better short-term price stability?
THETA currently exhibits relatively better short-term price stability with a current price of $0.2166 and higher trading volume, suggesting more established market liquidity. OVER's price of $0.004266, combined with its substantial decline from its December 2024 all-time high and lower trading volume, indicates higher short-term volatility. The extreme fear market sentiment index of 17 affects both assets, though THETA's longer operational history may provide some cushioning against extreme fluctuations.
Q5: How should portfolio allocation between OVER and THETA differ based on risk tolerance?
Conservative investors should consider a 20-30% OVER and 70-80% THETA allocation, reflecting THETA's longer operational track record and more established market presence. Aggressive investors may adopt a 50-60% OVER and 40-50% THETA split, allowing greater exposure to emerging infrastructure projects while maintaining diversification. Both strategies should incorporate hedging instruments such as stablecoin allocation for liquidity management and cross-asset portfolio construction to reduce correlation risk.
Q6: What time horizon is most appropriate for evaluating returns on these investments?
OVER requires a longer evaluation horizon extending to 2028-2031 to assess its infrastructure development and ecosystem maturation, given its recent launch in December 2024. THETA's established operational history since 2017 allows for medium-term evaluation (2026-2028) with clearer historical benchmarks. Short-term trading strategies (under 12 months) face elevated uncertainty for both assets, particularly given the current extreme fear market sentiment and OVER's limited price history.
Q7: How do the technological development trajectories of OVER and THETA differ?
OVER focuses on Layer 1 blockchain infrastructure development with emphasis on accessibility through personal computer-based full node operations, requiring assessment of scalability considerations and network stability over extended operational periods. THETA's technological development centers on decentralized content delivery network coordination, bandwidth optimization mechanisms, and participant incentive alignment. THETA's longer operational history provides more observable technological iteration patterns, while OVER's development trajectory remains in earlier assessment phases.
Q8: What market conditions would favor OVER versus THETA performance?
OVER may demonstrate relative strength during periods of renewed interest in accessible blockchain infrastructure, Layer 1 innovation cycles, and decentralized validation mechanisms. THETA could benefit from increased demand for decentralized content delivery solutions, video streaming platform adoption, and bandwidth optimization requirements. Both assets remain subject to broader cryptocurrency market sentiment, with the current extreme fear index of 17 suggesting challenging conditions for both projects regardless of their specific use cases.
Share
Content
Introduction: Investment Comparison Between OVER and THETA
I. Historical Price Comparison and Current Market Status
II. Core Factors Influencing OVER vs THETA Investment Value
III. 2026-2031 Price Prediction: OVER vs THETA
IV. Investment Strategy Comparison: OVER vs THETA
V. Potential Risk Comparison
VI. Conclusion: Which Is the Better Buy?
VII. FAQ
How to Buy Cryptocurrency


Trending Cryptocurrencies


XZXX: A Comprehensive Guide to the BRC-20 Meme Token in 2025

Survey Note: Detailed Analysis of the Best AI in 2025

Detailed Analysis of the Best 10 GameFi Projects to Play and Earn in 2025

Kaspa’s Journey: From BlockDAG Innovation to Market Buzz

Best Crypto Wallets 2025: How to Choose and Secure Your Digital Assets
Popular GameFi Games in 2025
Understanding NGMI and WAGMI: Key Terms in the Cryptocurrency Industry

2026 SMURFCAT Price Prediction: Expert Analysis and Market Forecast for the Upcoming Year
2026 BST Price Prediction: Expert Analysis and Market Forecast for the Next Bull Run

2026 FIR Price Prediction: Expert Analysis and Market Forecast for the Coming Year

2026 OVL Price Prediction: Expert Analysis and Market Outlook for Overlay Protocol Token