This comprehensive article analyzes Blocksquare (BST), a pioneering real estate tokenization platform, providing professional price forecasts from 2026 to 2031. Currently trading at $0.01734 with extreme market fear conditions, BST presents both opportunities and risks for investors. The analysis covers BST's market position, historical price evolution from its $0.9842 peak in March 2024 to current lows, and key growth factors including supply mechanisms, institutional dynamics, and ecosystem development. Price predictions range from $0.01778 (2026) to $0.02735 (2031) under baseline scenarios, with transformative potential reaching $0.03282. The article offers tailored investment strategies for different investor profiles, comprehensive risk management frameworks, and practical guidance for trading on Gate and other platforms, addressing both opportunities in the RWA sector and market volatility challenges.
Introduction: BST's Market Position and Investment Value
Blocksquare (BST) serves as a pioneering real estate tokenization platform in the blockchain industry. Since its establishment in 2018, it has developed infrastructure supporting over 1,000 marketplaces globally, connecting investors with regional real estate opportunities. As of February 2026, BST maintains a market capitalization of approximately $808,000, with a circulating supply of around 46.61 million tokens, and the price hovering at $0.01734. This asset, recognized as a bridge between traditional real estate and decentralized finance, is playing an increasingly significant role in the real world asset (RWA) tokenization sector.
This article will comprehensively analyze BST's price trajectory from 2026 to 2031, combining historical patterns, market supply-demand dynamics, ecosystem development, and macroeconomic conditions to provide investors with professional price forecasts and practical investment strategies.
I. BST Price History Review and Market Status
BST Historical Price Evolution Trajectory
- 2024: The token experienced significant volatility, reaching a notable price level of $0.9842 on March 30, 2024, marking a key milestone in its trading history
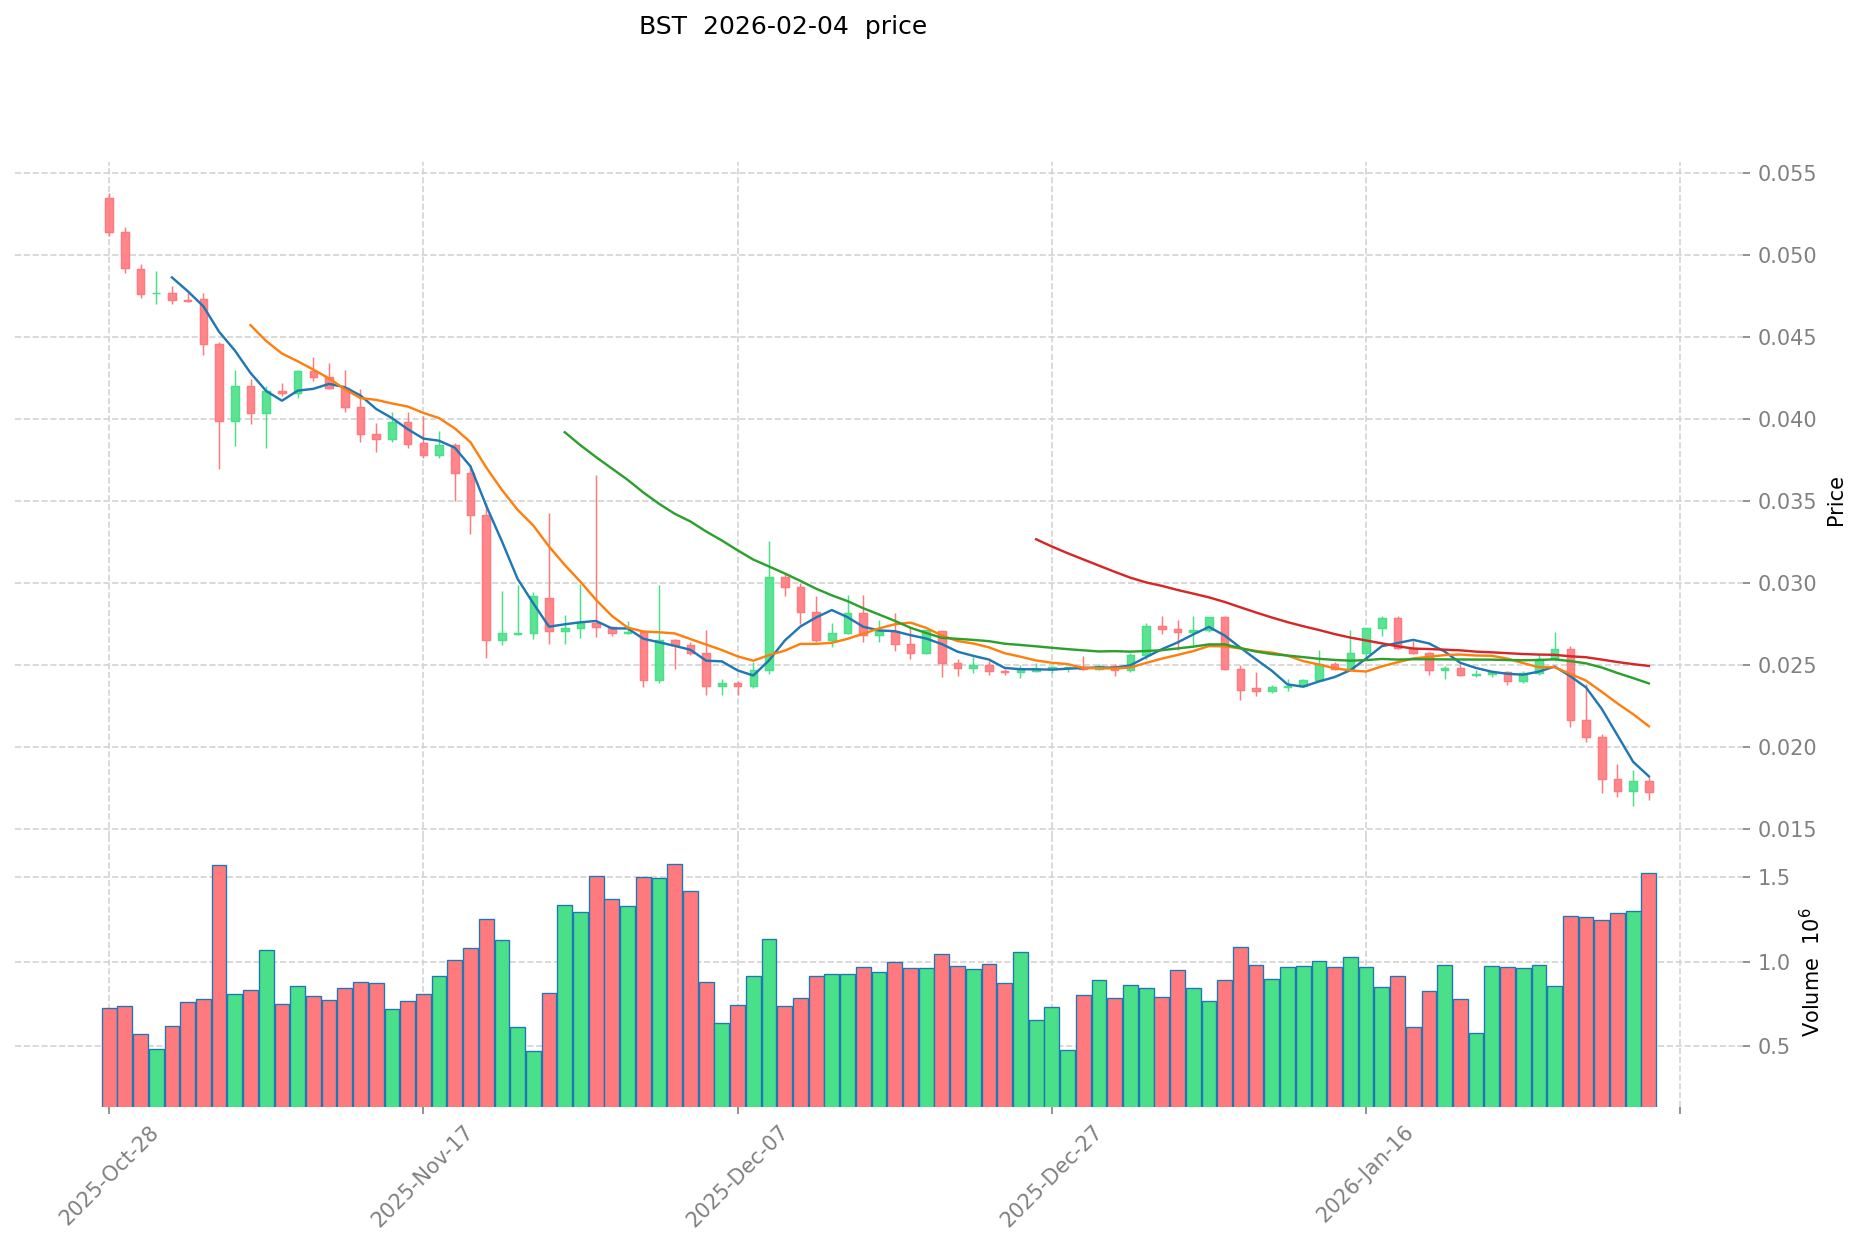
- 2026: Market conditions shifted dramatically, with the price declining to $0.0164 on February 2, 2026, reflecting broader market pressures
- Recent Period: The token has shown a downward trend over multiple timeframes, with price movement from previous highs demonstrating substantial volatility in the real estate tokenization sector
BST Current Market Situation
As of February 4, 2026, Blocksquare (BST) is trading at $0.01734, with a 24-hour trading volume of $26,474.82. The token has experienced a modest decline of 0.5% over the past 24 hours, with an intraday high of $0.01821 and a low of $0.0168.
The market capitalization stands at approximately $808,276.75, with a circulating supply of 46,613,423 BST tokens, representing 46.61% of the maximum supply of 100,000,000 tokens. The fully diluted market cap is calculated at $1,734,000. Market dominance remains at 0.000063%, indicating BST's position as a specialized asset within the broader cryptocurrency ecosystem.
Over extended timeframes, BST has faced considerable headwinds, declining 29.81% over the past week, 35.55% over the past month, and showing a year-over-year decrease of 85.91%. The token is currently trading significantly below its price level recorded on March 30, 2024.
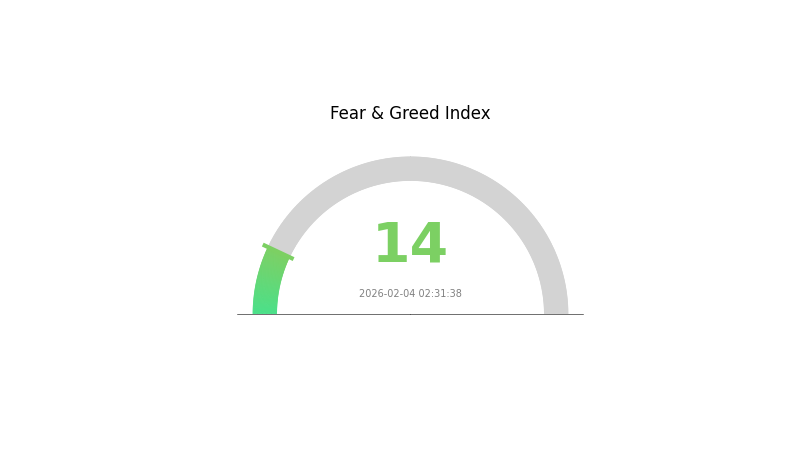
BST operates on the Ethereum blockchain as an ERC-20 token, with a contract address at 0x509a38b7a1cc0dcd83aa9d06214663d9ec7c7f4a. The token is held by approximately 4,533 addresses and is available for trading on 3 exchanges. Market sentiment indicators show a Fear & Greed Index reading of 14, reflecting "Extreme Fear" conditions in the broader market environment.
Click to view current BST market price
BST Market Sentiment Indicator
2026-02-04 Fear and Greed Index: 14 (Extreme Fear)
Click to view the current Fear & Greed Index
The cryptocurrency market is currently experiencing extreme fear, with the Fear and Greed Index hitting 14. This exceptionally low reading indicates intense market pessimism and risk aversion among investors. Such extreme fear levels historically present contrarian opportunities, as panic-driven selling often creates attractive entry points for long-term investors. Market participants should exercise caution while remaining alert to potential rebounds when sentiment stabilizes. Consider your risk tolerance and investment strategy carefully during such volatile periods on Gate.com.
BST Holding Distribution
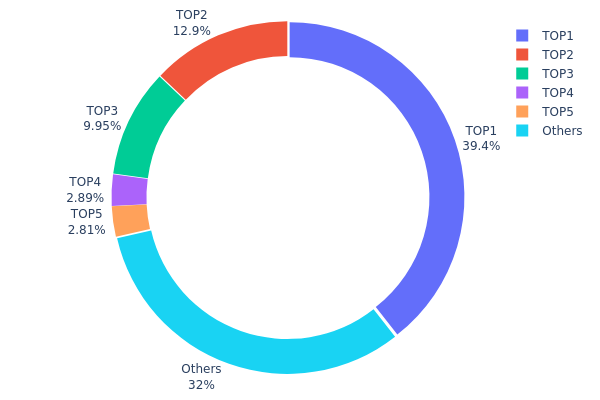
The holding distribution chart illustrates the concentration of token ownership across different wallet addresses, providing insights into the decentralization level and potential market control by major holders. According to the latest on-chain data as of February 4, 2026, BST exhibits a relatively high concentration pattern. The top holder controls approximately 39.43% of the total supply (25.88M tokens), while the second and third largest addresses hold 12.93% and 9.94% respectively. Combined, the top three addresses account for over 62% of the circulating supply, indicating significant centralization in token ownership.
This concentrated distribution structure presents both opportunities and risks for market participants. On one hand, the substantial holdings by top addresses may suggest strong conviction from early investors or strategic partners, potentially providing price stability during market downturns. On the other hand, such concentration creates asymmetric market power, where large holders possess the ability to significantly influence price movements through coordinated selling or buying activities. The remaining 32% held by smaller addresses, while representing broader community participation, may face challenges in counterbalancing decisions made by major stakeholders.
From a market structure perspective, this holding pattern reflects a relatively centralized governance model that could impact long-term protocol development and decision-making processes. The high concentration ratio suggests that BST's on-chain structure remains in an early development stage, with limited token distribution across a wider user base. Market participants should monitor any significant changes in these top addresses, as large-scale transfers or selling pressure from major holders could trigger substantial price volatility and affect overall market sentiment.
Click to view current BST Holding Distribution
| Top |
Address |
Holding Qty |
Holding (%) |
| 1 |
0x6f1e...9f7f8a |
25883.96K |
39.43% |
| 2 |
0x9642...2f5d4e |
8489.21K |
12.93% |
| 3 |
0x0e85...df51a6 |
6530.11K |
9.94% |
| 4 |
0x1802...48daec |
1898.15K |
2.89% |
| 5 |
0x0d07...b492fe |
1847.68K |
2.81% |
| - |
Others |
20988.27K |
32% |
II. Core Factors Influencing BST's Future Price
Supply Mechanism
- Supply Halving Mechanism: BST implements a supply reduction mechanism similar to Bitcoin's halving model, where token issuance decreases at predetermined intervals. This deflationary mechanism is designed to increase scarcity over time.
- Historical Pattern: Supply reduction events in cryptocurrency markets have historically correlated with upward price pressure, as reduced new token supply meets sustained or growing demand.
- Current Impact: The supply halving mechanism continues to shape market expectations, with reduced token availability potentially supporting price appreciation as market demand evolves.
Institutional and Major Holder Dynamics
- Market Participation: BST's price trajectory is influenced by institutional interest in DeFi lending protocols, where participation patterns can significantly affect token demand and liquidity.
- Competitive Landscape: BST operates within the DeFi borrowing and lending sector, where its performance is compared against established protocols, influencing investor allocation decisions.
Macroeconomic Environment
- Regulatory Developments: Changes in cryptocurrency regulations across different jurisdictions can materially impact BST's accessibility and adoption, with policy shifts affecting investor confidence and market participation.
- Geopolitical Factors: Global political events, including economic crises or geopolitical tensions, may drive investors toward or away from cryptocurrency assets like BST, depending on their risk tolerance and market perception.
- Safe-Haven Dynamics: During periods of traditional currency instability or economic uncertainty, cryptocurrencies may attract increased attention from investors seeking alternative value stores, potentially benefiting tokens like BST.
Technical Development and Ecosystem Building
- DeFi Lending Market Performance: BST's value proposition centers on its role within decentralized finance borrowing and lending markets. The protocol's ability to optimize yields and provide efficient lending services directly influences token demand.
- Market Sentiment: Investor sentiment and speculative activity remain significant price drivers in the cryptocurrency market, with BST subject to the same volatility patterns that characterize digital asset trading.
- Competitive Positioning: BST's differentiation from competitors in the DeFi lending space, including protocols like AAVE, affects its market share and investment attractiveness, contributing to price discovery mechanisms.
III. 2026-2031 BST Price Forecast
2026 Outlook
- Conservative Forecast: $0.016 - $0.01778
- Neutral Forecast: $0.01778
- Optimistic Forecast: $0.02169 (contingent upon favorable market conditions and increased adoption)
For 2026, BST is projected to experience modest growth with an average price target of $0.01778. The conservative scenario positions the price floor at $0.016, while the optimistic scenario anticipates potential highs reaching $0.02169, representing approximately 2% growth from current levels. This initial year's performance will likely be influenced by broader cryptocurrency market sentiment and BST's ability to expand its utility and user base.
2027-2029 Mid-term Outlook
- Market Stage Expectation: Consolidation and gradual appreciation phase
- Price Range Forecast:
- 2027: $0.01224 - $0.02112 (average: $0.01974)
- 2028: $0.0143 - $0.02431 (average: $0.02043)
- 2029: $0.01275 - $0.02438 (average: $0.02237)
- Key Catalysts: Sustained ecosystem development, potential partnerships, and increasing market recognition
The mid-term period reflects progressive appreciation with 2027 showing a 13% projected change, followed by 17% in 2028, and 28% in 2029. This trajectory suggests BST may enter a steady growth phase, with average prices gradually climbing from $0.01974 in 2027 to $0.02237 by 2029. The widening price ranges indicate increased market volatility and potential for both consolidation periods and breakthrough moments.
2030-2031 Long-term Outlook
- Baseline Scenario: $0.02127 - $0.02337 (assuming steady market conditions and continued project development)
- Optimistic Scenario: $0.02735 - $0.03132 (contingent upon significant adoption milestones and favorable regulatory environment)
- Transformative Scenario: $0.03282 (under exceptionally favorable conditions including mass adoption and strategic partnerships)
The long-term forecast for 2030-2031 presents increasingly positive projections, with 2030 anticipating a 34% change and 2031 potentially achieving a 57% increase. By 2030, BST's average price could reach $0.02337, potentially climbing to $0.02735 in 2031. The optimistic ceiling of $0.03282 in 2031 represents nearly double the 2026 baseline, though achieving this would require sustained favorable market conditions and significant ecosystem expansion.
- February 4, 2026: BST trading within early-year consolidation range (establishing foundation for projected growth trajectory)
| Year |
Predicted High Price |
Predicted Average Price |
Predicted Low Price |
Price Change |
| 2026 |
0.02169 |
0.01778 |
0.016 |
2 |
| 2027 |
0.02112 |
0.01974 |
0.01224 |
13 |
| 2028 |
0.02431 |
0.02043 |
0.0143 |
17 |
| 2029 |
0.02438 |
0.02237 |
0.01275 |
28 |
| 2030 |
0.03132 |
0.02337 |
0.02127 |
34 |
| 2031 |
0.03282 |
0.02735 |
0.01832 |
57 |
IV. BST Professional Investment Strategy and Risk Management
BST Investment Methodology
(I) Long-term Holding Strategy
- Suitable for: Investors interested in real estate tokenization and RWA sector development
- Operational Recommendations:
- Consider accumulating positions during market downturns, given BST's 30-day decline of 35.55%
- Monitor project developments in Blocksquare's tokenization protocol and marketplace expansion
- Storage Solution: Gate Web3 Wallet offers secure custody options for ERC-20 tokens like BST
(II) Active Trading Strategy
- Technical Analysis Tools:
- Volume Analysis: Current 24-hour trading volume stands at $26,474.82, indicating moderate liquidity levels
- Price Range Indicators: 24-hour high of $0.01821 and low of $0.0168 define short-term trading boundaries
- Swing Trading Considerations:
- Monitor support levels near the all-time low of $0.0164 recorded on February 2, 2026
- Consider resistance levels and volume patterns when planning entry and exit points
BST Risk Management Framework
(I) Asset Allocation Principles
- Conservative Investors: 1-3% of crypto portfolio allocation
- Aggressive Investors: 5-8% of crypto portfolio allocation
- Professional Investors: Up to 10% with active monitoring and hedging strategies
(II) Risk Hedging Solutions
- Diversification Approach: Balance BST holdings with other RWA tokens and mainstream cryptocurrencies
- Position Sizing: Implement gradual accumulation rather than lump-sum investment given current market volatility
(III) Secure Storage Solutions
- Software Wallet Recommendation: Gate Web3 Wallet provides convenient access with multi-layer security features
- Multi-signature Solution: Consider multi-signature wallets for larger BST holdings
- Security Precautions: Never share private keys, enable two-factor authentication, and regularly backup wallet information
V. BST Potential Risks and Challenges
BST Market Risks
- Price Volatility: BST has experienced an 85.91% decline over the past year, demonstrating significant market risk
- Liquidity Concerns: With a market cap of approximately $808,276.75 and limited exchange listings (3 exchanges), liquidity may impact large transactions
- Market Sentiment: Current trading at $0.01734, substantially below the all-time high of $0.9842 recorded in March 2024
BST Regulatory Risks
- Real Estate Tokenization Regulations: Evolving regulatory frameworks for tokenized real estate assets may impact Blocksquare's operations
- Securities Classification: Potential classification of tokenized real estate as securities could affect platform operations and token utility
- Cross-border Compliance: Operating across multiple jurisdictions presents ongoing regulatory challenges for the platform
BST Technical Risks
- Smart Contract Dependencies: As an ERC-20 token, BST relies on Ethereum network security and smart contract integrity
- Platform Development Risk: Project success depends on continued development and adoption of Blocksquare's tokenization infrastructure
- Competition Risk: Growing competition in the real estate tokenization sector may impact market share and token value
VI. Conclusion and Action Recommendations
BST Investment Value Assessment
Blocksquare (BST) represents participation in the real estate tokenization sector, with infrastructure supporting marketplace operations globally. The project's focus on connecting investors with regional real estate opportunities through blockchain technology addresses a specific market need. However, investors should consider the token's performance history, including the substantial year-over-year decline of 85.91% and relatively low market capitalization of approximately $808,276.75. The circulating supply of 46,613,423 BST represents 46.61% of the maximum supply of 100,000,000 tokens. With only 3 exchange listings and moderate trading volume, liquidity considerations remain relevant for investment decisions.
BST Investment Recommendations
✅ Beginners: Start with minimal allocation (1-2% of crypto portfolio) after thorough research into real estate tokenization concepts and market dynamics
✅ Experienced Investors: Consider BST as a speculative position within a diversified RWA sector portfolio, with active monitoring of project developments
✅ Institutional Investors: Evaluate BST within broader real estate tokenization investment thesis, considering regulatory environment and market adoption trends
BST Trading Participation Methods
- Spot Trading: BST is available for spot trading on Gate.com and 2 other exchanges with current price at $0.01734
- DCA Strategy: Implement dollar-cost averaging to manage volatility risk given current market conditions
- Portfolio Integration: Include BST as part of a diversified cryptocurrency portfolio focused on RWA and real estate technology sectors
Cryptocurrency investment carries extremely high risks, and this article does not constitute investment advice. Investors should make prudent decisions based on their own risk tolerance and are advised to consult professional financial advisors. Never invest more than you can afford to lose.
FAQ
What is BST? What are its uses and value?
BST is a blockchain-based utility token designed for decentralized applications and DeFi protocols. It provides governance rights, transaction fees reduction, and staking rewards. As Web3 adoption accelerates, BST's value is expected to grow significantly through increasing platform utility and ecosystem expansion.
BST的历史价格走势如何?
BST reached its historical peak of 4.150 CAD on November 25, 2010, with a low of 0.020 CAD recorded in May 2022. Price movements reflect market dynamics; current rates require real-time data verification.
How to predict BST's future price movement?
Analyze BST's on-chain metrics, trading volume, market capitalization trends, and developer activity. Monitor blockchain developments and market sentiment. Consider historical price patterns and overall crypto market conditions for comprehensive price prediction insights.
What are the main factors affecting BST price?
BST price is mainly influenced by supply mechanisms, institutional holdings, macroeconomic conditions, real estate tokenization technology progress, market demand, and scarcity. These factors collectively determine price movements and market dynamics.
Common technical analysis tools for BST price prediction include Moving Averages, RSI (Relative Strength Index), MACD, Bollinger Bands, Fibonacci Retracement, Support and Resistance levels, and Volume analysis. These indicators help traders identify trends and potential price movements.
What risks should I pay attention to when investing in BST?
BST investment carries market volatility risk as prices can fluctuate significantly. Investors should understand crypto's high-risk nature and platform security concerns. Conduct thorough research before investing.
What are the advantages or disadvantages of BST compared to similar tokens?
BST offers high liquidity with 24/7 trading, unrestricted by traditional market hours. This provides significant advantages over conventional assets. Further evaluation of specific disadvantages requires detailed market analysis.
What are professional analysts' price predictions for BST?
Professional analysts predict BST's maximum price at 2.00 EUR and minimum price at 1.90 EUR, based on Banca Sistema S.p.A.'s future performance outlook.
* The information is not intended to be and does not constitute financial advice or any other recommendation of any sort offered or endorsed by Gate.