QTC vs DOT: A Comprehensive Comparison of Two Leading Blockchain Networks

Introduction: QTC vs DOT Investment Comparison
In the cryptocurrency market, the comparison between QTC vs DOT has always been a topic that investors cannot avoid. The two not only show significant differences in market capitalization ranking, application scenarios, and price performance, but also represent different crypto asset positioning. QTC (Qitcoin): Since its launch in 2020, it has gained market recognition with its positioning as a distributed search engine for blockchain networks, aiming to provide efficient storage and retrieval services. DOT (Polkadot): Since its inception in 2019, it has been regarded as a blockchain interoperability platform, connecting various chains through relay chain technology, and is one of the globally recognized public chain projects with substantial trading volume and market presence. This article will comprehensively analyze the investment value comparison between QTC vs DOT around historical price trends, supply mechanisms, institutional adoption, technical ecosystems, and future forecasts, and attempt to answer the question that investors are most concerned about:
"Which is the better buy right now?"
I. Historical Price Comparison and Current Market Status
QTC and DOT Historical Price Trends
- 2022: QTC reached a notable price level of $11.31 on March 3, 2022, representing a significant milestone in its early trading history.
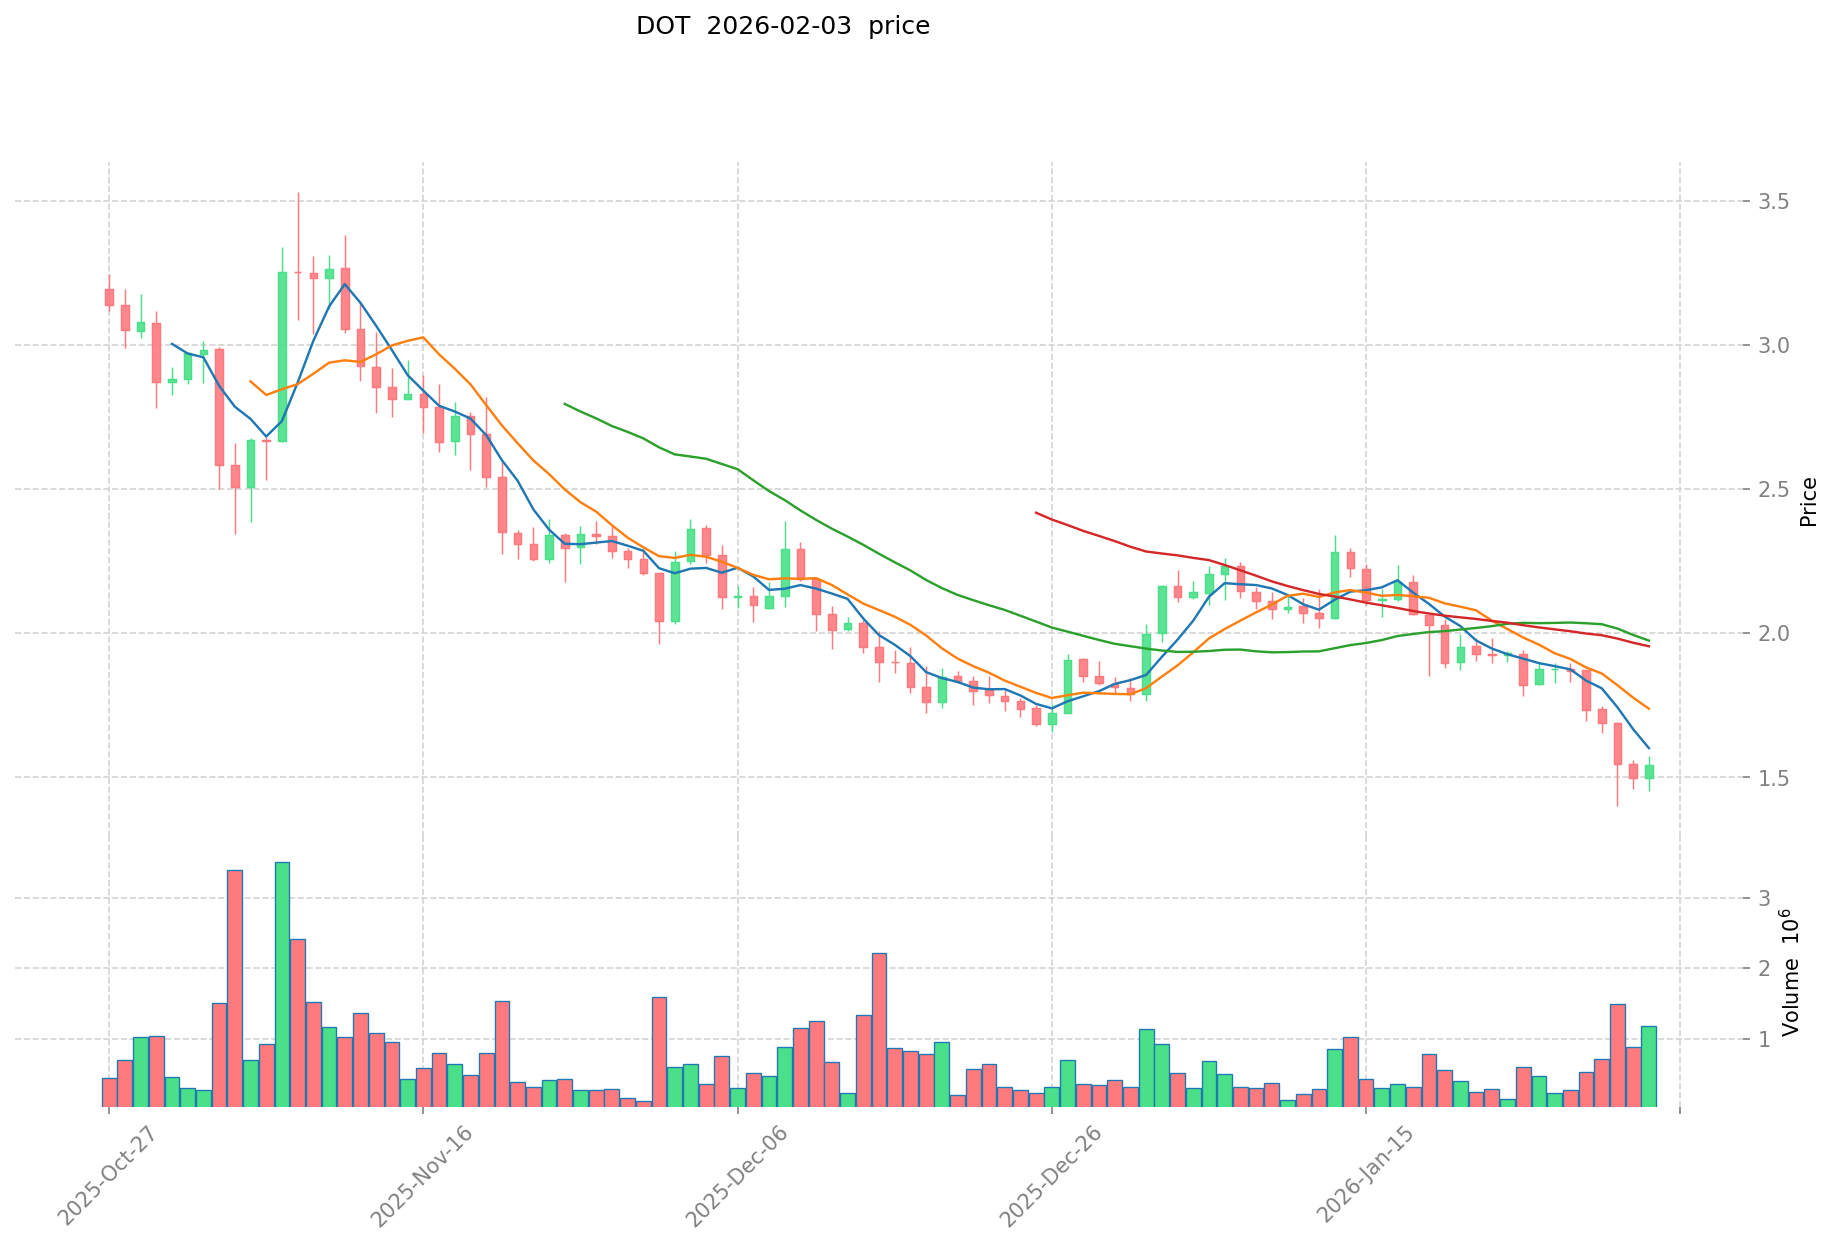
- 2021: DOT experienced substantial growth during the 2021 market cycle, reaching $54.98 on November 4, 2021, reflecting strong market demand during that period.
- Comparative Analysis: During recent market cycles, QTC has declined from its peak of $11.31 to current levels around $0.02011, while DOT has similarly declined from $54.98 to approximately $1.538, showing parallel downward trends across both assets.
Current Market Status (2026-02-03)
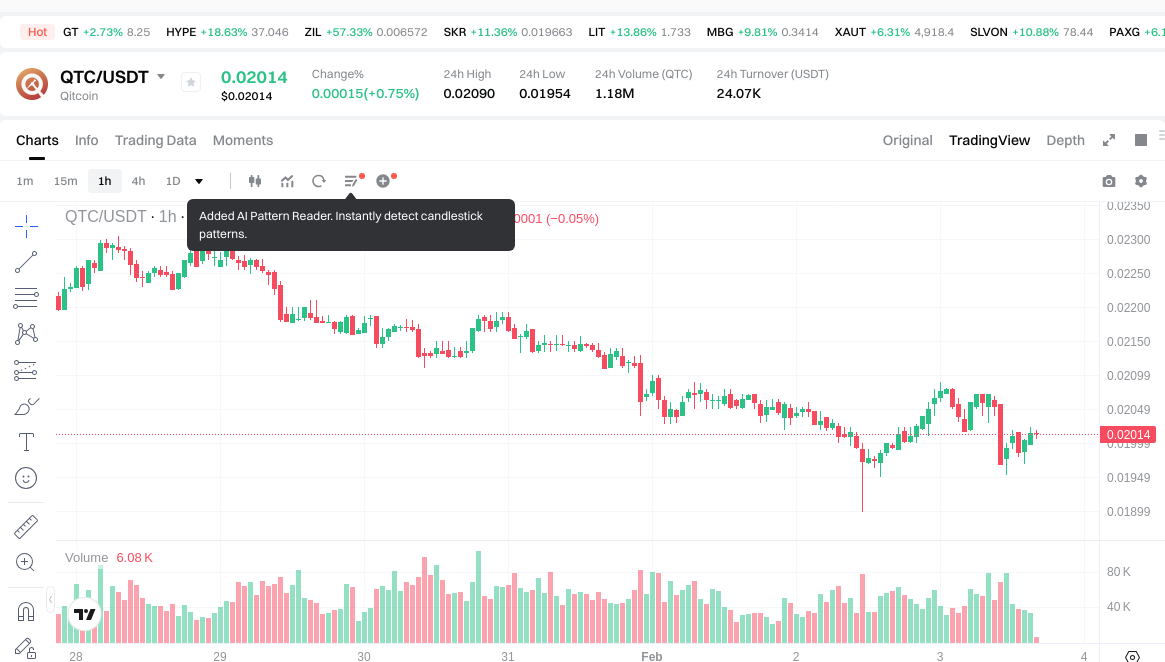
- QTC Current Price: $0.02011
- DOT Current Price: $1.538
- 24-Hour Trading Volume: QTC recorded $24,155.34 compared to DOT's $837,936.14
- Market Sentiment Index (Fear & Greed Index): 17 (Extreme Fear)
View real-time prices:
- View QTC Current Price Market Price
- View DOT Current Price Market Price
II. Core Factors Influencing QTC vs DOT Investment Value
Supply Mechanism Comparison (Tokenomics)
- QTC: The specific supply mechanism for QTC is not detailed in available materials, making it difficult to assess whether it follows a fixed supply, inflationary, or deflationary model.
- DOT: Polkadot employs an inflationary model with a targeted annual inflation rate that adjusts based on staking participation. The network aims to incentivize staking while maintaining network security through its Nominated Proof-of-Stake (NPoS) consensus mechanism.
- 📌 Historical Pattern: Supply mechanisms play a significant role in price cycle dynamics. Tokens with deflationary characteristics or predictable supply schedules tend to attract long-term holders, while inflationary models may create selling pressure unless balanced by strong demand drivers such as staking rewards or ecosystem growth.
Institutional Adoption and Market Application
- Institutional Holdings: DOT has gained relatively more attention from institutional investors due to its focus on blockchain interoperability and its role in the Web3 ecosystem. QTC's institutional adoption status remains unclear based on available information.
- Enterprise Adoption: DOT is utilized in cross-chain communication, decentralized finance (DeFi) applications, and as a bridge for interoperability between different blockchain networks. QTC's enterprise use cases are not well-documented in the provided materials.
- National Policies: Regulatory attitudes toward DOT vary by jurisdiction, with some countries embracing its technology for innovation while others maintain cautious oversight. QTC's regulatory standing is not clearly outlined in available sources.
Technological Development and Ecosystem Building
- QTC Technological Upgrades: Specific technological developments for QTC are not available in the reference materials, making it challenging to evaluate its innovation trajectory or potential impact on investment value.
- DOT Technological Development: Polkadot continues to advance its parachain functionality, enabling specialized blockchains to connect and communicate seamlessly. Ongoing upgrades focus on scalability, security, and governance improvements, enhancing its position as an interoperability leader.
- Ecosystem Comparison: DOT has a robust ecosystem encompassing DeFi protocols, NFT platforms, cross-chain bridges, and smart contract deployment through parachains. QTC's ecosystem development and application scenarios are not sufficiently documented in the provided materials.
Macroeconomic Environment and Market Cycles
- Performance in Inflationary Environments: Assets with strong technological foundations and real-world use cases, such as DOT, may demonstrate resilience during inflationary periods by attracting capital seeking innovation-driven growth. QTC's behavior in such conditions is not well-established.
- Macroeconomic Monetary Policy: Interest rate changes and U.S. dollar index fluctuations influence both assets, though tokens with stronger institutional backing and ecosystem utility may show more stability. DOT's established presence may provide relative advantages, while QTC's response remains uncertain.
- Geopolitical Factors: Cross-border transaction demand and international developments can impact both tokens. DOT's interoperability features position it favorably for cross-chain solutions in a fragmented global landscape, whereas QTC's relevance in this context is unclear.
III. 2026-2031 Price Forecast: QTC vs DOT
Short-term Forecast (2026)
- QTC: Conservative $0.0153-$0.0201 | Optimistic $0.0201-$0.0294
- DOT: Conservative $1.14-$1.54 | Optimistic $1.54-$2.23
Mid-term Forecast (2028-2029)
- QTC may enter a gradual growth phase, with estimated price range of $0.0164-$0.0414
- DOT may enter a consolidation and expansion phase, with estimated price range of $2.01-$3.08
- Key drivers: institutional capital inflows, ETF developments, ecosystem expansion
Long-term Forecast (2030-2031)
- QTC: Baseline scenario $0.0242-$0.0367 | Optimistic scenario $0.0367-$0.0481
- DOT: Baseline scenario $2.36-$3.33 | Optimistic scenario $3.33-$4.06
Disclaimer
QTC:
| Year | Predicted High Price | Predicted Average Price | Predicted Low Price | Price Change |
|---|---|---|---|---|
| 2026 | 0.0294044 | 0.02014 | 0.0153064 | 0 |
| 2027 | 0.028983474 | 0.0247722 | 0.021551814 | 23 |
| 2028 | 0.0349411881 | 0.026877837 | 0.01639548057 | 33 |
| 2029 | 0.041418746817 | 0.03090951255 | 0.023491229538 | 53 |
| 2030 | 0.037249053574005 | 0.0361641296835 | 0.033632640605655 | 79 |
| 2031 | 0.048085635033665 | 0.036706591628752 | 0.024226350474976 | 82 |
DOT:
| Year | Predicted High Price | Predicted Average Price | Predicted Low Price | Price Change |
|---|---|---|---|---|
| 2026 | 2.2272 | 1.536 | 1.13664 | 0 |
| 2027 | 2.747136 | 1.8816 | 1.50528 | 22 |
| 2028 | 3.07810944 | 2.314368 | 2.01350016 | 50 |
| 2029 | 2.8040882688 | 2.69623872 | 1.9143294912 | 75 |
| 2030 | 3.905232162048 | 2.7501634944 | 2.420143875072 | 78 |
| 2031 | 4.05979135043328 | 3.327697828224 | 2.36266545803904 | 116 |
IV. Investment Strategy Comparison: QTC vs DOT
Long-term vs Short-term Investment Strategies
-
QTC: May appeal to investors seeking exposure to emerging blockchain infrastructure projects with higher risk tolerance. The token's positioning in distributed search and storage solutions represents a niche within the broader blockchain ecosystem, though its current market capitalization and trading volume suggest limited liquidity for large-scale positions.
-
DOT: Suits investors focused on established interoperability platforms with demonstrated ecosystem development. Polkadot's parachain architecture and cross-chain capabilities position it for participants interested in Web3 infrastructure and those seeking exposure to blockchain interoperability trends with relatively more institutional recognition.
Risk Management and Asset Allocation
- Conservative Investors: QTC 5-10% vs DOT 15-25% (within overall crypto portfolio allocation)
- Aggressive Investors: QTC 15-20% vs DOT 30-40% (within overall crypto portfolio allocation)
- Hedging Tools: Stablecoin reserves for liquidity management, options strategies for downside protection, cross-asset diversification across different blockchain infrastructure categories
V. Potential Risk Comparison
Market Risk
-
QTC: Faces significant liquidity constraints with 24-hour trading volume of $24,155.34, which may result in price volatility during entry or exit. The substantial decline from $11.31 to current levels around $0.02011 reflects market sentiment challenges and limited trading depth that could amplify price fluctuations.
-
DOT: Experiences market cycle volatility common to Layer 1 protocols, having declined from $54.98 to approximately $1.538. While trading volume of $837,936.14 provides better liquidity than QTC, the token remains subject to broader crypto market sentiment shifts and competition from alternative interoperability solutions.
Technical Risk
-
QTC: Technical development details and network performance metrics are not sufficiently documented in available materials, creating uncertainty around scalability capabilities, network stability, and ongoing innovation trajectory.
-
DOT: Parachain auction mechanisms and relay chain architecture introduce complexity in network coordination. Potential technical considerations include parachain slot competition, cross-chain message verification latency, and governance mechanism effectiveness as the ecosystem expands.
Regulatory Risk
- Global regulatory frameworks continue evolving for blockchain infrastructure projects. DOT's higher profile and institutional adoption may attract greater regulatory scrutiny in certain jurisdictions, while QTC's lower market presence may result in less immediate regulatory attention but also reduced clarity on compliance pathways. Both assets remain subject to changing international policies regarding crypto asset classification, taxation, and cross-border transaction requirements.
VI. Conclusion: Which Is the Better Buy?
📌 Investment Value Summary:
-
QTC Characteristics: Represents exposure to blockchain search and storage infrastructure with early-stage project risk profile. Current market positioning suggests limited institutional adoption and ecosystem development visibility, with price performance reflecting broader market challenges.
-
DOT Characteristics: Offers participation in established interoperability infrastructure with documented parachain ecosystem, cross-chain functionality, and relatively stronger institutional recognition. Technical development roadmap and governance mechanisms provide more transparent evaluation frameworks.
✅ Investment Considerations:
-
Novice Investors: Consider prioritizing assets with stronger liquidity, clearer use cases, and more accessible educational resources. DOT may offer more straightforward evaluation criteria compared to QTC's less documented development trajectory.
-
Experienced Investors: May evaluate both assets within diversified blockchain infrastructure portfolios, weighing QTC's higher risk-return potential against DOT's relatively more established market position and ecosystem depth.
-
Institutional Investors: Assessment should incorporate due diligence on tokenomics transparency, ecosystem sustainability metrics, regulatory compliance frameworks, and liquidity depth for position sizing requirements.
⚠️ Risk Disclosure: Cryptocurrency markets exhibit high volatility and substantial risk of capital loss. This content does not constitute investment advice, financial guidance, or recommendations for specific investment actions. Investors should conduct independent research, assess personal risk tolerance, and consult qualified financial professionals before making investment decisions.
VII. FAQ
Q1: What are the main differences between QTC and DOT in terms of market positioning and use cases?
DOT (Polkadot) is an established blockchain interoperability platform focusing on cross-chain communication through its parachain architecture, while QTC (Qitcoin) positions itself as a distributed search engine for blockchain networks aimed at storage and retrieval services. The fundamental difference lies in their ecosystem maturity: DOT has demonstrated substantial adoption in DeFi, NFT platforms, and cross-chain applications with a 24-hour trading volume of $837,936.14, whereas QTC represents an earlier-stage project with significantly lower liquidity at $24,155.34 in daily trading volume and limited documented enterprise adoption.
Q2: How do the supply mechanisms of QTC and DOT affect their long-term investment value?
DOT employs a transparent inflationary model with an adjustable annual inflation rate tied to staking participation through its Nominated Proof-of-Stake (NPoS) consensus mechanism, which incentivizes network security while creating predictable tokenomics. In contrast, QTC's supply mechanism remains undocumented in available materials, making it difficult for investors to assess whether it follows fixed supply, inflationary, or deflationary characteristics. Historical patterns suggest that tokens with clear, predictable supply schedules tend to attract long-term institutional holders, giving DOT a relative advantage in this regard for investors seeking transparency in tokenomics evaluation.
Q3: Which asset offers better liquidity for investors looking to enter or exit positions?
DOT provides substantially better liquidity with a 24-hour trading volume of $837,936.14 compared to QTC's $24,155.34, representing approximately 35 times greater trading activity. This liquidity differential becomes critical during market volatility, as QTC's limited trading depth may result in significant slippage when executing larger orders. For investors requiring the ability to adjust positions efficiently—particularly institutional participants or those implementing active trading strategies—DOT's superior liquidity profile reduces execution risk and provides more favorable entry and exit conditions across various market conditions.
Q4: What are the price forecast ranges for QTC vs DOT through 2031?
According to predictive analysis, QTC's conservative 2026 forecast ranges from $0.0153 to $0.0201, potentially reaching $0.0242 to $0.0367 by 2030-2031 under baseline scenarios. DOT's conservative 2026 forecast spans $1.14 to $1.54, with long-term 2030-2031 baseline projections of $2.36 to $3.33. The optimistic scenarios suggest QTC could reach $0.0294 to $0.0481 and DOT could achieve $2.23 to $4.06 by 2031. However, these forecasts assume varying degrees of ecosystem development, institutional adoption, and favorable macroeconomic conditions—factors that present greater uncertainty for QTC given its limited current market presence compared to DOT's established infrastructure position.
Q5: How should different investor profiles approach QTC vs DOT allocation?
Conservative investors are recommended to allocate 5-10% to QTC versus 15-25% to DOT within their overall crypto portfolio, reflecting DOT's relatively more established market position and QTC's higher risk profile. Aggressive investors might consider 15-20% QTC allocation versus 30-40% DOT exposure, accepting greater volatility potential in exchange for possible higher returns. This differentiation stems from fundamental risk factors: QTC's limited liquidity, undocumented technical development trajectory, and minimal institutional adoption create early-stage project risks, while DOT's demonstrated ecosystem, parachain functionality, and stronger institutional recognition provide more transparent evaluation frameworks despite remaining subject to broader market cycle volatility.
Q6: What are the primary technical risks investors should consider for each asset?
QTC faces technical uncertainty due to insufficient documentation regarding network performance metrics, scalability capabilities, and ongoing development roadmap, creating challenges for investors attempting to evaluate long-term technological competitiveness. DOT's technical considerations center on parachain architecture complexity, including parachain slot auction competition, cross-chain message verification latency, and governance mechanism effectiveness as the ecosystem scales. While DOT's technical challenges are well-documented and addressable through transparent development processes, QTC's lack of visible technical disclosure creates evaluation difficulties that may deter institutional participation and limit investor confidence in its technological sustainability.
Q7: How does the current market sentiment affect QTC and DOT investment decisions?
The current Fear & Greed Index reading of 17 (Extreme Fear) reflects broader crypto market pessimism that impacts both assets, though with different implications. DOT's established ecosystem and institutional recognition may provide relative resilience during fear-driven market conditions, as long-term infrastructure investors often view such periods as accumulation opportunities. QTC's early-stage profile and limited liquidity make it more vulnerable to extreme fear sentiment, potentially experiencing sharper price declines and slower recovery patterns. Both assets have declined significantly from historical peaks—QTC from $11.31 to $0.02011 and DOT from $54.98 to $1.538—indicating that current market conditions favor projects with stronger fundamental support and clearer value propositions during recovery phases.
Q8: What regulatory considerations should investors evaluate when comparing QTC and DOT?
Both assets face evolving global regulatory frameworks for blockchain infrastructure projects, though with differing risk profiles. DOT's higher market profile and institutional adoption may attract greater regulatory scrutiny in certain jurisdictions, requiring ongoing compliance adaptation as international policies develop regarding crypto asset classification, taxation, and cross-border transactions. Conversely, QTC's lower market presence may result in less immediate regulatory attention but also reduced clarity on compliance pathways and institutional acceptance standards. Investors should monitor jurisdiction-specific developments affecting blockchain interoperability platforms (impacting DOT) and distributed storage solutions (impacting QTC), recognizing that regulatory clarity typically favors assets with stronger institutional engagement and transparent governance structures.
Share
Content
Introduction: QTC vs DOT Investment Comparison
I. Historical Price Comparison and Current Market Status
II. Core Factors Influencing QTC vs DOT Investment Value
III. 2026-2031 Price Forecast: QTC vs DOT
IV. Investment Strategy Comparison: QTC vs DOT
V. Potential Risk Comparison
VI. Conclusion: Which Is the Better Buy?
VII. FAQ
How to Buy Cryptocurrency


Trending Cryptocurrencies


2025 SUI coin: price, buying guide, and Staking rewards

How to Buy Crypto: A Step-by-Step Guide with Gate.com

HNT Price in 2025: Helium Network Token Value and Market Analysis
What is SwissCheese (SWCH) and How Does It Democratize Investment?

Cardano (ADA) Price Analysis and Outlook for 2025

How to Invest in Metaverse Crypto
How to Choose and Set Up the Best Cryptocurrency Wallet in Recent Years
How to Create an NFT Token for Free and Sell It on NFT Marketplaces: Complete Guide
How to Exchange USDT for Japanese Yen | Complete Guide to Payment Services Act Compliance

Who Is Coffeezilla, the YouTube Detective Exposing Crypto Scams?
Top 13 Low-Cost Cryptocurrencies to Invest In