SKYA vs DOT: A Comprehensive Comparison of Two Leading Blockchain Platforms


Introduction: Investment Comparison Between SKYA and DOT
In the cryptocurrency market, the comparison between SKYA vs DOT has become a topic of interest for investors. Both assets differ significantly in market cap ranking, application scenarios, and price performance, representing distinct positioning within the crypto asset landscape.
Sekuya (SKYA): Launched in May 2024, this gaming-focused token positions itself as a community-driven video game project centered on an anime epic fantasy universe.
Polkadot (DOT): Introduced in May 2019, this blockchain infrastructure project facilitates interoperability between independent blockchains through its relay chain technology, establishing itself as a foundational layer for decentralized applications and services.
This article will provide a comprehensive analysis of SKYA vs DOT investment value comparison, examining historical price trends, supply mechanisms, institutional adoption, technological ecosystems, and future projections, while addressing the question investors care about most:
"Which is the better buy right now?"
I. Historical Price Comparison and Current Market Status
SKYA and DOT Historical Price Trends
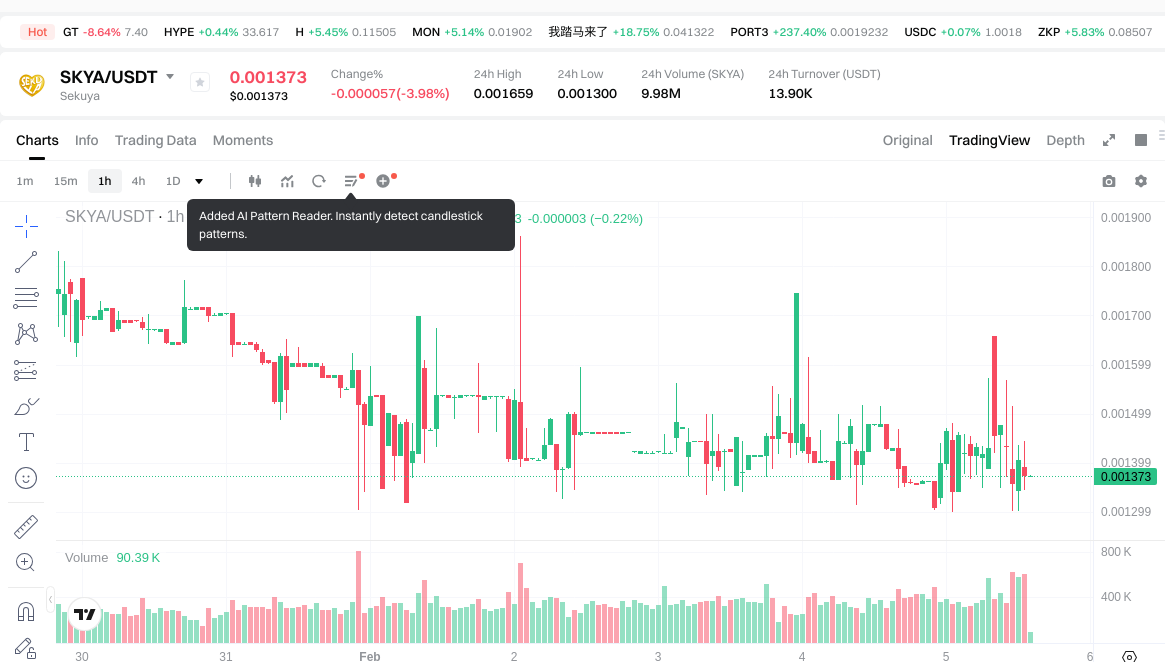
- 2024: SKYA reached its all-time high of $0.085964 in December, representing a significant milestone following its launch in May 2024 at $0.02.
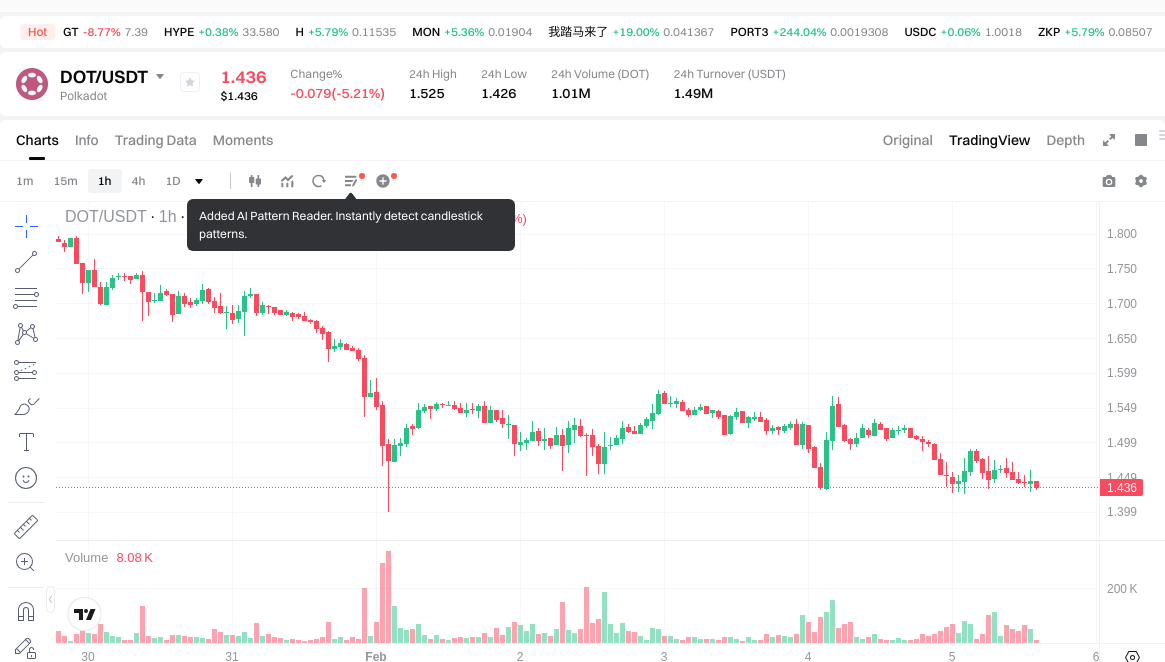
- 2021: DOT achieved its all-time high of $54.98 in November, driven by strong market momentum and ecosystem development during the broader crypto bull market.
- Comparative Analysis: During the 2024-2026 market cycle, SKYA declined from its peak of $0.085964 to $0.0013, while DOT experienced a substantial correction from $54.98 to current levels around $1.44, reflecting broader market weakness and the decline in Layer-0 protocol valuations.
Current Market Status (2026-02-05)
- SKYA Current Price: $0.001373
- DOT Current Price: $1.441
- 24-Hour Trading Volume: SKYA $13,881.51 vs DOT $1,482,524.40
- Market Sentiment Index (Fear & Greed Index): 12 (Extreme Fear)
View real-time prices:
- Check SKYA current price Market Price
- Check DOT current price Market Price
II. Core Factors Influencing SKYA vs DOT Investment Value
Supply Mechanism Comparison (Tokenomics)
The investment value of crypto assets is significantly influenced by their underlying supply mechanisms, which shape price dynamics and market behavior over time.
- SKYA: The reference materials do not provide specific information about SKYA's supply mechanism or tokenomics structure.
- DOT: The reference materials do not provide specific information about DOT's supply mechanism or tokenomics structure.
- 📌 Historical patterns: Supply mechanisms play a role in driving price cycle variations, though specific mechanisms vary across different crypto assets. Market demand, adoption trends, and institutional participation interact with supply dynamics to influence valuation.
Institutional Adoption and Market Applications
Institutional engagement and real-world applications represent critical factors in assessing crypto asset investment value.
- Institutional holdings: The reference materials indicate that market potential and institutional participation affect crypto asset pricing, though specific comparative data between SKYA and DOT is not provided.
- Enterprise adoption: The materials do not contain specific information comparing SKYA and DOT usage in cross-border payments, settlements, or investment portfolios.
- National policies: Regulatory attitudes vary across jurisdictions and can significantly impact asset valuations. The materials note that regulatory actions and policy changes influence market dynamics, though specific policy stances toward SKYA and DOT are not detailed.
Technology Development and Ecosystem Building
- SKYA technology upgrades: The reference materials do not provide specific information about SKYA's technical development roadmap or recent upgrades.
- DOT technology development: The reference materials do not provide specific information about DOT's technical development roadmap or recent upgrades.
- Ecosystem comparison: When evaluating crypto assets, technical innovation and ecosystem strength matter. The materials mention that technical foundations and innovation represent key investment considerations, though specific comparisons of DeFi, NFT, payment solutions, and smart contract implementations between SKYA and DOT are not available in the provided sources.
Macroeconomic Factors and Market Cycles
- Performance under inflationary environments: The reference materials indicate that broader economic factors influence crypto asset pricing, though specific comparative analysis of inflation-hedging properties between SKYA and DOT is not provided.
- Macroeconomic monetary policy: Interest rates and currency index movements affect crypto asset markets. The materials note that global news, economic factors, and market sentiment drive frequent price fluctuations.
- Geopolitical factors: Cross-border transaction demand and international developments can impact crypto asset valuations. The materials reference supply-demand relationships and market activity as influencing factors, though specific geopolitical impacts on SKYA versus DOT are not detailed in the provided sources.
III. 2026-2031 Price Forecast: SKYA vs DOT
Short-term Forecast (2026)
- SKYA: Conservative $0.00085126 - $0.001373 | Optimistic $0.001373 - $0.00142792
- DOT: Conservative $1.30676 - $1.436 | Optimistic $1.436 - $1.8668
Mid-term Forecast (2028-2029)
- SKYA may enter a gradual growth phase, with estimated price range of $0.001446 - $0.00251
- DOT may enter a moderate expansion phase, with estimated price range of $1.813 - $2.638
- Key drivers: institutional capital inflows, ETF developments, ecosystem expansion
Long-term Forecast (2030-2031)
- SKYA: Baseline scenario $0.002142 - $0.002221 | Optimistic scenario $0.00252 - $0.002821
- DOT: Baseline scenario $2.169 - $2.754 | Optimistic scenario $2.644 - $3.829
Disclaimer
SKYA:
| Year | Predicted High Price | Predicted Average Price | Predicted Low Price | Price Change |
|---|---|---|---|---|
| 2026 | 0.00142792 | 0.001373 | 0.00085126 | 0 |
| 2027 | 0.0020026578 | 0.00140046 | 0.0010923588 | 2 |
| 2028 | 0.002160979803 | 0.0017015589 | 0.001446325065 | 23 |
| 2029 | 0.00251065015695 | 0.0019312693515 | 0.00131326315902 | 40 |
| 2030 | 0.002820618887865 | 0.002220959754225 | 0.002154330961598 | 61 |
| 2031 | 0.002672036680308 | 0.002520789321045 | 0.002142670922888 | 83 |
DOT:
| Year | Predicted High Price | Predicted Average Price | Predicted Low Price | Price Change |
|---|---|---|---|---|
| 2026 | 1.8668 | 1.436 | 1.30676 | 0 |
| 2027 | 2.378016 | 1.6514 | 1.502774 | 14 |
| 2028 | 2.45794376 | 2.014708 | 1.8132372 | 39 |
| 2029 | 2.6388645384 | 2.23632588 | 2.0797830684 | 55 |
| 2030 | 3.071369963592 | 2.4375952092 | 2.169459736188 | 69 |
| 2031 | 3.82873079509044 | 2.754482586396 | 2.64430328294016 | 91 |
IV. Investment Strategy Comparison: SKYA vs DOT
Long-term vs Short-term Investment Strategies
- SKYA: May suit investors focused on gaming sector exposure and community-driven project potential, with consideration for higher volatility profiles typical of newer market entrants
- DOT: May suit investors seeking exposure to blockchain infrastructure and interoperability solutions, with consideration for established market positioning in the Layer-0 protocol category
Risk Management and Asset Allocation
- Conservative investors: SKYA 10-20% vs DOT 30-40%, with remaining allocation in stablecoins and established large-cap assets
- Aggressive investors: SKYA 30-40% vs DOT 40-50%, with tactical allocation adjustments based on market cycle positioning
- Hedging tools: stablecoin reserves for liquidity management, options strategies for downside protection, cross-asset diversification across multiple crypto categories
V. Potential Risk Comparison
Market Risks
- SKYA: Limited trading volume of $13,881.51 suggests lower liquidity conditions, with wider bid-ask spreads potentially impacting execution; recent decline from peak levels indicates elevated volatility exposure
- DOT: Current trading volume of $1,482,524.40 provides relatively deeper market liquidity; substantial correction from previous highs reflects sensitivity to broader market sentiment shifts and Layer-0 protocol sector dynamics
Technical Risks
- SKYA: Newer project status may involve evolving technical infrastructure considerations; information regarding network stability and scalability characteristics not detailed in available materials
- DOT: Established technical framework presents considerations around network decentralization and ongoing development priorities; specific technical risk factors not comprehensively detailed in provided sources
Regulatory Risks
- Global regulatory frameworks continue evolving, with varying approaches across jurisdictions potentially impacting both gaming-focused tokens and blockchain infrastructure protocols differently; compliance requirements and policy shifts represent ongoing considerations for both asset categories
VI. Conclusion: Which Is the Better Buy?
📌 Investment Value Summary:
- SKYA strengths: Gaming sector positioning, community-driven development approach, lower entry price point providing potential upside leverage in favorable market conditions
- DOT strengths: Established blockchain infrastructure role, interoperability technology foundation, relatively higher trading liquidity supporting position management flexibility
✅ Investment Recommendations:
- Beginner investors: Consider starting with DOT for established market presence and infrastructure positioning, maintaining conservative position sizing with stablecoin reserves for risk management
- Experienced investors: May evaluate portfolio allocation between both assets based on sector exposure preferences, risk tolerance levels, and market cycle assessment, employing appropriate hedging strategies
- Institutional investors: Assessment should incorporate due diligence on technical frameworks, ecosystem development trajectories, liquidity profiles, and regulatory landscape considerations across both gaming-focused and infrastructure protocol categories
⚠️ Risk Warning: The cryptocurrency market exhibits significant volatility. This content does not constitute investment advice. Investors should conduct independent research and consult qualified financial professionals before making investment decisions.
VII. FAQ
Q1: What is the main difference between SKYA and DOT in terms of use cases?
SKYA is a gaming-focused token centered on a community-driven video game project within an anime epic fantasy universe, while DOT serves as a blockchain infrastructure protocol enabling interoperability between independent blockchains through relay chain technology. SKYA targets the gaming and entertainment sector with community engagement as its primary value driver, launched in May 2024. In contrast, DOT, introduced in May 2019, functions as a foundational layer for decentralized applications and services, providing technical infrastructure for cross-chain communication and ecosystem development across the broader blockchain landscape.
Q2: Which asset has better liquidity for trading purposes?
DOT demonstrates significantly superior liquidity with a 24-hour trading volume of $1,482,524.40, approximately 107 times higher than SKYA's $13,881.51. This substantial liquidity difference means DOT traders can execute larger positions with tighter bid-ask spreads and reduced slippage risk. The limited trading volume for SKYA suggests wider spreads and potentially challenging execution for larger orders, making it more suitable for smaller position sizes and investors comfortable with lower liquidity conditions typical of newer market entrants.
Q3: How have SKYA and DOT performed since their respective launches?
SKYA launched in May 2024 at $0.02, reached an all-time high of $0.085964 in December 2024, then declined to current levels around $0.001373, representing an 84% drop from its peak. DOT achieved its all-time high of $54.98 in November 2021 and has corrected to approximately $1.44, marking a 97% decline from peak levels. Both assets reflect substantial corrections from their respective highs, with DOT's longer market history showing deeper cyclical volatility, while SKYA's shorter track record demonstrates rapid initial growth followed by significant retracement during the broader market downturn.
Q4: What are the projected price ranges for SKYA and DOT through 2031?
For SKYA, short-term 2026 projections range from $0.00085126-$0.00142792, expanding to $0.002142-$0.002821 by 2031 under baseline scenarios. DOT's projections show $1.30676-$1.8668 for 2026, potentially reaching $2.169-$3.829 by 2031. These forecasts suggest both assets may experience gradual appreciation over the five-year horizon, with DOT maintaining absolute higher price levels while SKYA shows potential percentage growth from a significantly lower base. Key drivers include institutional capital flows, ETF developments, ecosystem expansion, and broader market cycle dynamics influencing adoption trajectories.
Q5: Which asset carries higher risk for investors?
SKYA presents higher risk due to limited trading volume, newer market presence, shorter operational history, and gaming sector concentration, exposing investors to elevated volatility and liquidity constraints. DOT carries moderate risk stemming from substantial correction from previous highs, Layer-0 protocol sector dynamics, and technical infrastructure evolution requirements. Conservative investors may favor DOT's established positioning and deeper liquidity, while risk-tolerant investors comfortable with higher volatility profiles might allocate to SKYA for gaming sector exposure and potential upside leverage from lower entry prices.
Q6: How should different investor types approach SKYA vs DOT allocation?
Beginner investors should consider DOT for established infrastructure positioning, maintaining conservative allocations of 30-40% with remaining assets in stablecoins and large-cap holdings. Experienced investors may allocate 30-40% to SKYA and 40-50% to DOT for aggressive strategies, or 10-20% SKYA and 30-40% DOT for conservative approaches, adjusting based on market cycles. Institutional investors require comprehensive due diligence on technical frameworks, liquidity profiles, regulatory landscapes, and ecosystem development trajectories before establishing positions in either gaming-focused tokens or infrastructure protocols.
Q7: What market conditions favor SKYA versus DOT performance?
SKYA may outperform during gaming sector rallies, community-driven narrative cycles, and risk-on market environments favoring newer, higher-beta assets with lower market capitalizations. DOT may show relative strength during infrastructure buildout phases, institutional adoption waves, interoperability narrative cycles, and flight-to-quality periods when investors favor established protocols with proven technical foundations. Both assets remain sensitive to broader crypto market sentiment, with the current Fear & Greed Index at 12 (Extreme Fear) suggesting cautious positioning and risk management remain priorities regardless of individual asset preferences.
Q8: What regulatory considerations affect SKYA and DOT differently?
Gaming-focused tokens like SKYA face regulatory scrutiny around gaming mechanics, token utility classification, and potential gambling-related frameworks depending on implementation details and jurisdictional interpretations. Infrastructure protocols like DOT encounter regulatory considerations around network decentralization standards, validator requirements, and cross-chain transaction oversight as authorities develop frameworks for blockchain interoperability solutions. Both asset categories navigate evolving global regulatory landscapes with varying approaches across jurisdictions, requiring investors to monitor compliance developments, policy shifts, and jurisdictional differences that may impact operations, adoption trajectories, and market accessibility over time.
Share
Content
Introduction: Investment Comparison Between SKYA and DOT
I. Historical Price Comparison and Current Market Status
II. Core Factors Influencing SKYA vs DOT Investment Value
III. 2026-2031 Price Forecast: SKYA vs DOT
IV. Investment Strategy Comparison: SKYA vs DOT
V. Potential Risk Comparison
VI. Conclusion: Which Is the Better Buy?
VII. FAQ
How to Buy Cryptocurrency


Trending Cryptocurrencies


2025 Vertus daily combo code: Web3 gamers rewards guide

Today's Vertus Daily Combo Code: Boost Your Web3 Gaming Rewards (April 29, 2025)

GALA Coin (GALA) – Web3 Gaming Token Overview, Price Prediction & Trading on Gate.com

What is Gaming Crypto?How Gaming Crypto Works?

Detailed analysis of the top ten encryption game coins to be launched in 2025

Top 6 Best Gaming Currencies

How does Fed monetary policy and inflation data impact crypto prices in 2026

What is Monad (MON): whitepaper logic, use cases, technical innovation, and team background analysis

How does Federal Reserve policy and inflation impact MON token price in 2026
2026 TRVL Price Prediction: Expert Analysis and Future Outlook for Travel Tokens in the Cryptocurrency Market

What is token economics model: inflation, deflation, burn mechanisms, and governance utility explained