SOPHIA vs KAVA: A Comprehensive Comparison of Two Leading Blockchain Platforms

Introduction: SOPHIA vs KAVA Investment Comparison
In the cryptocurrency market, the comparison between SOPHIA vs KAVA has consistently been a focal point for investors. The two differ significantly in market cap ranking, application scenarios, and price performance, representing distinct positioning within the crypto asset landscape. SOPHIA (SOPHIA): Launched in 2023, it positions itself as a decentralized open-source AGI superconscious encryption challenge, integrating gamified development with advanced cognitive AI technology and robotics models. KAVA (KAVA): Since its launch in 2019, KAVA has been recognized as a cross-chain decentralized financial platform, providing collateral lending and stablecoin services for mainstream digital assets while serving as a Layer 1 hub supporting DeFi applications. This article will comprehensively analyze the investment value comparison between SOPHIA vs KAVA through historical price trends, supply mechanisms, institutional adoption, technological ecosystems, and future forecasts, attempting to address the question investors care about most:
"Which is the better buy right now?"
I. Historical Price Comparison and Current Market Status
Historical Price Trends of SOPHIA (Coin A) and KAVA (Coin B)
- 2023: SOPHIA reached its all-time high of $0.2715 on July 28, 2023, following its initial launch period. The token experienced significant early momentum during the project's gamified development phase.
- 2019-2020: KAVA launched its token in 2019 and released its platform in 2020, establishing itself as a DeFi lending platform. The token reached its historical peak of $9.12 on August 30, 2021.
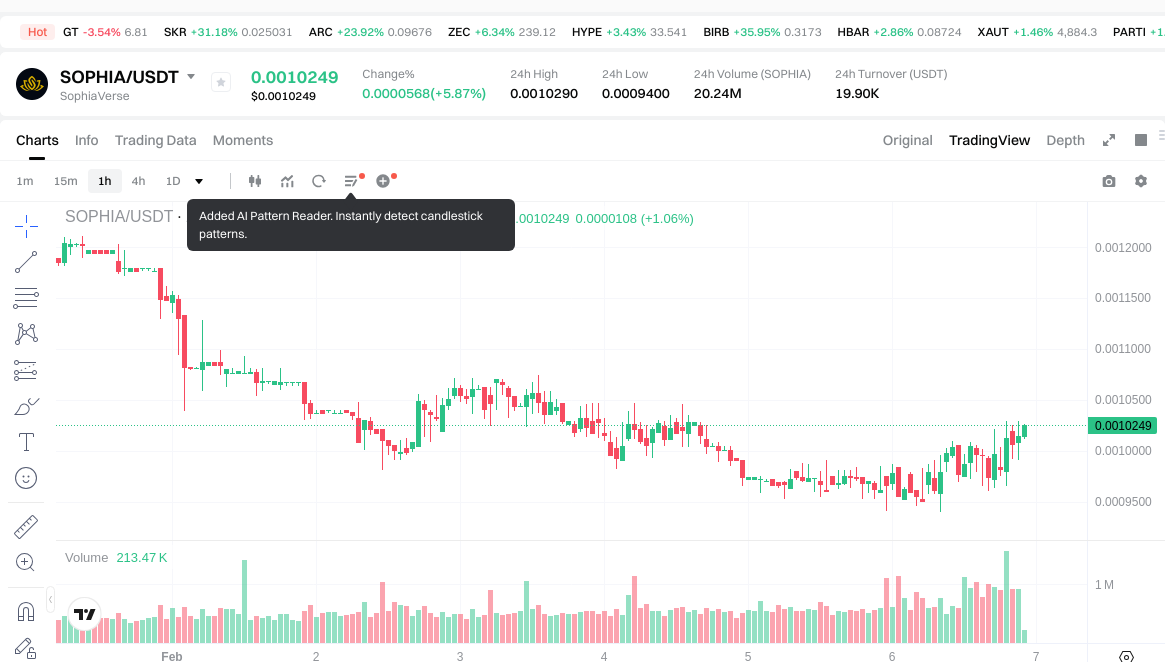
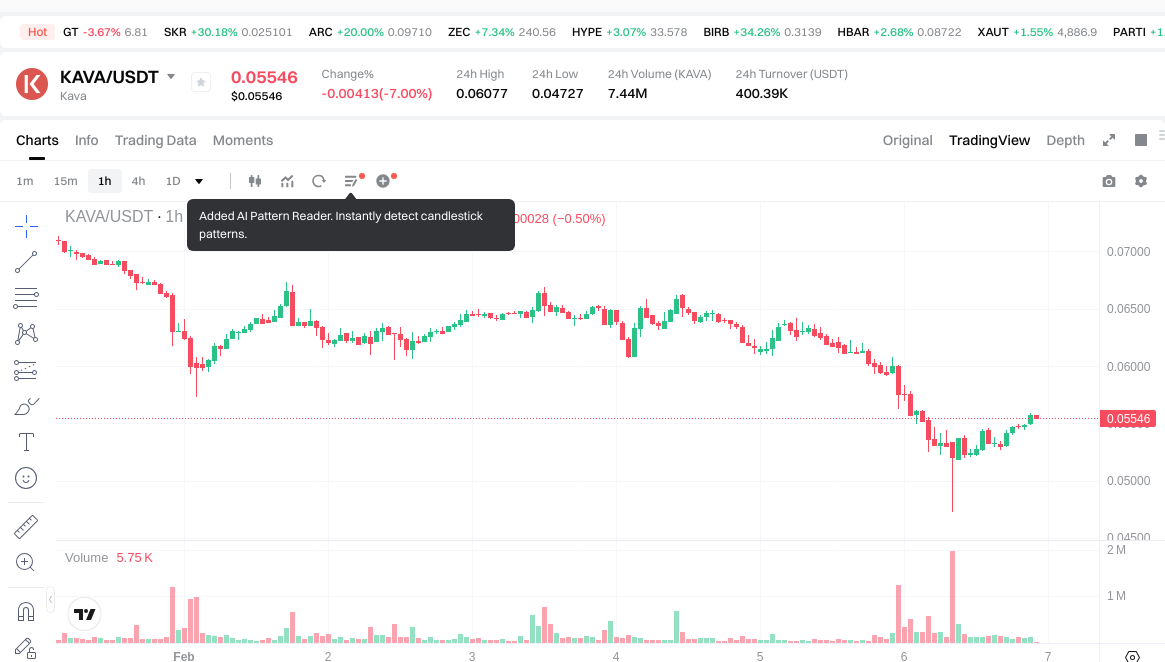
- Comparative Analysis: During recent market cycles, SOPHIA has declined from its peak of $0.2715 to current levels near $0.0010141, representing substantial downward pressure. Meanwhile, KAVA has experienced a similar trajectory, falling from $9.12 to approximately $0.05574, reflecting broader market corrections in the DeFi sector.
Current Market Status (February 6, 2026)
- SOPHIA Current Price: $0.0010141
- KAVA Current Price: $0.05574
- 24-Hour Trading Volume: SOPHIA $19,767.64 vs KAVA $403,706.99
- Market Sentiment Index (Fear & Greed Index): 9 (Extreme Fear)
View real-time prices:
- Check SOPHIA current price Market Price
- Check KAVA current price Market Price
II. Core Factors Affecting SOPHIA vs KAVA Investment Value
Supply Mechanism Comparison (Tokenomics)
Due to insufficient reference materials, detailed supply mechanism information for SOPHIA and KAVA cannot be provided at this time. Supply mechanisms typically include factors such as total supply caps, emission schedules, and deflationary features that may influence long-term price dynamics.
Institutional Adoption and Market Applications
Without available data on institutional holdings, enterprise adoption patterns, or regulatory attitudes across different jurisdictions, a comprehensive comparison between SOPHIA and KAVA in terms of cross-border payments, settlement systems, and investment portfolio integration cannot be established.
Technical Development and Ecosystem Building
Technical upgrade information for both SOPHIA and KAVA is not available in the provided materials. Ecosystem comparisons regarding DeFi integration, NFT support, payment infrastructure, and smart contract deployment remain unclear without supporting data.
Macroeconomic Factors and Market Cycles
The comparative performance of SOPHIA and KAVA under different macroeconomic conditions, including inflation environments, monetary policy shifts, interest rate fluctuations, and geopolitical factors, cannot be assessed due to lack of relevant data in the reference materials.
III. 2026-2031 Price Forecast: SOPHIA vs KAVA
Short-term Forecast (2026)
- SOPHIA: Conservative $0.000996 - $0.001027 | Optimistic $0.001027 - $0.001099
- KAVA: Conservative $0.05267 - $0.05544 | Optimistic $0.05544 - $0.05877
Mid-term Forecast (2028-2029)
- SOPHIA may enter a consolidation phase, with estimated price range of $0.000569 - $0.001390 in 2028, expanding to $0.000658 - $0.001317 in 2029
- KAVA may enter a growth phase, with estimated price range of $0.04597 - $0.07224 in 2028, potentially reaching $0.06068 - $0.09446 in 2029
- Key drivers: institutional capital inflows, ETF developments, ecosystem expansion
Long-term Forecast (2030-2031)
- SOPHIA: Baseline scenario $0.000832 - $0.001280 (2030) | Optimistic scenario $0.000986 - $0.001957 (2031)
- KAVA: Baseline scenario $0.06945 - $0.08171 (2030) | Optimistic scenario $0.05260 - $0.10611 (2031)
Disclaimer: Price forecasts are based on historical data analysis and market trend projections. Cryptocurrency markets are highly volatile and subject to numerous unpredictable factors. These predictions should not be considered as investment advice. Users should conduct independent research and consult with financial professionals before making any investment decisions.
SOPHIA:
| Year | Predicted High Price | Predicted Average Price | Predicted Low Price | Price Change |
|---|---|---|---|---|
| 2026 | 0.001098676 | 0.0010268 | 0.000995996 | 1 |
| 2027 | 0.00112650228 | 0.001062738 | 0.00099897372 | 4 |
| 2028 | 0.0013901675778 | 0.00109462014 | 0.0005692024728 | 7 |
| 2029 | 0.001316937490434 | 0.0012423938589 | 0.000658468745217 | 22 |
| 2030 | 0.001753141974293 | 0.001279665674667 | 0.000831782688533 | 26 |
| 2031 | 0.001956160933579 | 0.00151640382448 | 0.000985662485912 | 49 |
KAVA:
| Year | Predicted High Price | Predicted Average Price | Predicted Low Price | Price Change |
|---|---|---|---|---|
| 2026 | 0.0587664 | 0.05544 | 0.052668 | 0 |
| 2027 | 0.07423416 | 0.0571032 | 0.047966688 | 2 |
| 2028 | 0.072235548 | 0.06566868 | 0.045968076 | 17 |
| 2029 | 0.09446439618 | 0.068952114 | 0.06067786032 | 23 |
| 2030 | 0.0996840712098 | 0.08170825509 | 0.0694520168265 | 46 |
| 2031 | 0.106114510885383 | 0.0906961631499 | 0.052603774626942 | 62 |
IV. Investment Strategy Comparison: SOPHIA vs KAVA
Long-term vs Short-term Investment Strategies
- SOPHIA: May appeal to investors interested in emerging AGI and gamified development technologies, though the token has experienced considerable price decline from its 2023 peak. The speculative nature and lower liquidity suggest suitability primarily for risk-tolerant traders focused on short-term opportunities.
- KAVA: May attract investors seeking exposure to established DeFi infrastructure and cross-chain lending platforms. The token's longer operational history since 2019 and higher trading volumes indicate potential suitability for medium to long-term positions in decentralized finance ecosystems.
Risk Management and Asset Allocation
- Conservative Investors: SOPHIA 10-15% vs KAVA 85-90%
- Aggressive Investors: SOPHIA 30-40% vs KAVA 60-70%
- Hedging Tools: Stablecoin allocations, options contracts, cross-asset portfolio diversification strategies
V. Potential Risk Comparison
Market Risk
- SOPHIA: The token demonstrates extreme price volatility with a decline exceeding 99% from its peak of $0.2715 to current levels near $0.0010141. Limited trading volume of $19,767.64 suggests low liquidity and potential difficulty in executing large orders without significant price impact.
- KAVA: Price depreciation from $9.12 to approximately $0.05574 reflects substantial correction aligned with broader DeFi sector challenges. Trading volume of $403,706.99 indicates moderate market activity, though still subject to sector-wide volatility and market sentiment fluctuations.
Technical Risk
- SOPHIA: Scalability challenges and network stability concerns remain unclear due to limited operational data. The early-stage nature of the project introduces uncertainties regarding technical infrastructure maturity.
- KAVA: As a Layer 1 platform supporting DeFi applications, potential risks include network congestion during high-demand periods, smart contract vulnerabilities, and cross-chain bridge security considerations.
Regulatory Risk
Global regulatory developments may impact both assets differently. DeFi platforms like KAVA face increasing scrutiny regarding lending protocols, collateral requirements, and cross-border financial services compliance. Emerging technologies in the AGI and gamified development space, such as SOPHIA, may encounter regulatory uncertainty as jurisdictions develop frameworks for novel blockchain applications.
VI. Conclusion: Which Is the Better Buy?
📌 Investment Value Summary:
- SOPHIA Advantages: Exposure to emerging AGI and gamified development concepts; potential for recovery from oversold conditions if project development progresses favorably.
- KAVA Advantages: Established DeFi infrastructure since 2019; cross-chain capabilities supporting multiple digital assets; higher liquidity compared to SOPHIA; functioning ecosystem with collateral lending and stablecoin services.
✅ Investment Recommendations:
- Novice Investors: Consider prioritizing assets with longer operational histories and higher liquidity. If allocating to either asset, KAVA may present relatively lower entry barriers due to established market presence, though significant caution remains warranted.
- Experienced Investors: May evaluate SOPHIA for speculative positions within diversified portfolios, acknowledging extreme volatility and limited data. KAVA could serve as a DeFi sector exposure vehicle, subject to thorough due diligence on platform fundamentals and competitive positioning.
- Institutional Investors: Conduct comprehensive risk assessments including liquidity analysis, custody solutions, regulatory compliance frameworks, and counterparty risks. Consider position sizing aligned with institutional risk parameters and portfolio mandate constraints.
⚠️ Risk Disclosure: Cryptocurrency markets exhibit extreme volatility and unpredictability. This analysis does not constitute investment advice, financial guidance, or recommendations to buy, sell, or hold any digital assets. Market conditions as of February 6, 2026 show an Extreme Fear sentiment index of 9, indicating heightened market uncertainty. Investors should conduct independent research, consult qualified financial advisors, and only allocate capital they can afford to lose entirely.
VII. FAQ
Q1: What are the main differences between SOPHIA and KAVA in terms of their core functionality?
SOPHIA is a decentralized AGI superconscious project launched in 2023, focusing on gamified development with advanced cognitive AI technology, while KAVA is an established cross-chain DeFi platform since 2019, providing collateral lending and stablecoin services. SOPHIA represents an emerging experimental technology in the AGI and gamification space with limited operational history, whereas KAVA operates as a Layer 1 blockchain hub supporting decentralized financial applications across multiple digital assets. The fundamental distinction lies in their market positioning: SOPHIA targets speculative interest in next-generation AI integration, while KAVA serves practical DeFi infrastructure needs with proven use cases in lending protocols and cross-chain asset management.
Q2: Which asset shows better liquidity and trading activity?
KAVA demonstrates significantly superior liquidity with 24-hour trading volume of $403,706.99 compared to SOPHIA's $19,767.64 as of February 6, 2026. This 20-fold difference in trading volume indicates that KAVA offers substantially easier entry and exit opportunities for investors, with reduced slippage risk when executing orders. SOPHIA's limited liquidity presents challenges for position sizing and may result in significant price impact when trading larger amounts. For investors prioritizing capital efficiency and the ability to adjust positions without material market disruption, KAVA's higher trading activity provides a distinct advantage, though both assets remain subject to considerable volatility inherent in cryptocurrency markets.
Q3: How have SOPHIA and KAVA performed relative to their historical peaks?
Both assets have experienced severe depreciation from their all-time highs, though with different magnitudes. SOPHIA has declined approximately 99.6% from its peak of $0.2715 (July 28, 2023) to current levels near $0.0010141, representing extreme downward pressure within a relatively short timeframe. KAVA has fallen approximately 99.4% from its historical high of $9.12 (August 30, 2021) to approximately $0.05574, reflecting a broader multi-year correction cycle aligned with DeFi sector challenges. The substantial drawdowns in both assets underscore the high-risk nature of cryptocurrency investments and highlight the importance of understanding that historical peaks may not serve as reliable indicators of future price recovery potential.
Q4: What are the price forecasts for SOPHIA and KAVA through 2031?
Short-term forecasts for 2026 suggest SOPHIA may trade between $0.000996 - $0.001099, while KAVA is projected in the $0.05267 - $0.05877 range. By 2031, optimistic scenarios place SOPHIA between $0.000986 - $0.001957 and KAVA between $0.05260 - $0.10611. These projections indicate that KAVA maintains a significantly higher absolute price level throughout the forecast period, though both assets show potential for price expansion under favorable market conditions. However, these predictions are based on historical data analysis and trend extrapolations, making them inherently uncertain given cryptocurrency market volatility. Investors should recognize that actual outcomes may differ substantially from forecast ranges due to unpredictable factors including technological developments, regulatory changes, competitive dynamics, and macroeconomic shifts.
Q5: What risk management strategies should investors consider when allocating between SOPHIA and KAVA?
Conservative investors should consider limiting exposure with allocation ratios of 10-15% SOPHIA versus 85-90% KAVA if choosing to invest in either asset, prioritizing the more established DeFi platform. Aggressive investors might consider 30-40% SOPHIA versus 60-70% KAVA allocations, accepting higher volatility in exchange for potential upside from emerging AGI technology exposure. Regardless of strategy, implementing hedging tools such as stablecoin reserves, options contracts for downside protection, and cross-asset portfolio diversification remains essential. Position sizing should account for each investor's risk tolerance, investment timeline, and ability to withstand potential total capital loss. Given the extreme fear sentiment (index level 9) prevailing as of February 6, 2026, maintaining adequate liquidity reserves and avoiding over-concentration in either asset is particularly prudent.
Q6: Which regulatory risks differ between SOPHIA and KAVA?
KAVA faces regulatory scrutiny primarily related to DeFi lending protocols, collateral management frameworks, and cross-border financial services compliance as jurisdictions develop oversight mechanisms for decentralized finance platforms. As an established DeFi infrastructure provider since 2019, KAVA must navigate evolving requirements for transparency, user protection, and potential licensing obligations. SOPHIA encounters regulatory uncertainty stemming from its positioning in the emerging AGI and gamified development space, where regulatory frameworks remain largely undefined. Authorities may impose restrictions on AI-integrated blockchain applications, data privacy requirements, or novel technology deployment standards as these sectors mature. Both assets face jurisdiction-specific risks, with potential for divergent regulatory treatment based on their distinct use cases and technological architectures.
Q7: What factors should novice investors prioritize when choosing between SOPHIA and KAVA?
Novice investors should prioritize operational track record, liquidity metrics, and ecosystem maturity when evaluating these assets. KAVA's longer operational history since 2019, higher trading volume, and established DeFi infrastructure provide more reference points for assessment compared to SOPHIA's limited operational data since 2023. Understanding the fundamental purpose of each project—KAVA's practical DeFi lending services versus SOPHIA's experimental AGI integration—helps align investment choices with risk tolerance. Beginners should also consider starting with smaller position sizes to gain market exposure while limiting potential losses, recognizing that both assets have experienced extreme price declines exceeding 99% from historical peaks. Consulting qualified financial advisors, conducting thorough independent research, and only allocating capital one can afford to lose entirely remain essential principles for novice cryptocurrency investors regardless of specific asset selection.
Q8: How does current market sentiment affect investment decisions for SOPHIA versus KAVA?
The current market sentiment index of 9 (Extreme Fear) as of February 6, 2026, indicates heightened uncertainty and risk aversion across cryptocurrency markets, historically correlating with potential capitulation periods that may precede market bottoms. Under extreme fear conditions, both SOPHIA and KAVA face increased selling pressure and volatility, though assets with stronger fundamentals and higher liquidity like KAVA may demonstrate relatively better resilience. Investors considering entry during extreme fear periods should recognize that while historical patterns suggest potential value opportunities, sentiment can remain depressed for extended periods, requiring patience and tolerance for unrealized losses. Dollar-cost averaging strategies, which involve systematic purchases over time rather than lump-sum investments, may help mitigate timing risk when entering positions during periods of extreme market pessimism for either asset.
Share
Content
Introduction: SOPHIA vs KAVA Investment Comparison
I. Historical Price Comparison and Current Market Status
II. Core Factors Affecting SOPHIA vs KAVA Investment Value
III. 2026-2031 Price Forecast: SOPHIA vs KAVA
IV. Investment Strategy Comparison: SOPHIA vs KAVA
V. Potential Risk Comparison
VI. Conclusion: Which Is the Better Buy?
VII. FAQ
How to Buy Cryptocurrency


Trending Cryptocurrencies


What will be the market capitalization of USDC in 2025? Analysis of the stablecoin market landscape.

How is DeFi different from Bitcoin?

What is DeFi: Understanding Decentralized Finance in 2025
USDC stablecoin 2025 Latest Analysis: Principles, Advantages, and Web3 Eco-Applications

Development of Decentralized Finance Ecosystem in 2025: Integration of Decentralized Finance Applications with Web3

2025 USDT USD Complete Guide: A Must-Read for Newbie Investors

What is MASA: A Comprehensive Guide to the Multi-Agent System Architecture

What is WBAI: A Comprehensive Guide to Understanding Weighted Bias and Artificial Intelligence Applications

What is HARD: Understanding the Challenges of Achieving Excellence in Modern Work Environments

What is NC: A Comprehensive Guide to Numerical Control Technology in Modern Manufacturing
What is ANLOG: A Comprehensive Guide to Analog Signal Processing and Its Modern Applications