TLOS vs RUNE: A Comprehensive Comparison of Two Blockchain Ecosystems and Their Investment Potential

Introduction: Investment Comparison Between TLOS and RUNE
In the cryptocurrency market, the comparison between TLOS vs RUNE has consistently been a topic that investors cannot overlook. The two assets exhibit notable differences in market cap rankings, application scenarios, and price performance, representing distinct positioning within the crypto asset landscape.
TLOS (Telos): Launched in December 2018, it has gained market recognition through its positioning as a powerful enterprise-grade blockchain platform designed for hosting distributed applications with fast transaction capabilities.
RUNE (THORChain): Since its inception in July 2019, it has been recognized for its role in facilitating cross-chain transactions and liquidity provision through a highly optimized multi-chain architecture.
This article will comprehensively analyze the investment value comparison between TLOS vs RUNE, focusing on historical price trends, supply mechanisms, institutional adoption, technological ecosystems, and future predictions, attempting to answer the question that concerns investors most:
"Which is the better buy right now?"
I. Historical Price Comparison and Current Market Status
TLOS (Telos) and RUNE (THORChain) Historical Price Trends
- 2021: RUNE experienced significant volatility, reaching an all-time high of $20.87 on May 19, 2021, driven by increased adoption of cross-chain liquidity protocols.
- 2024: TLOS recorded its all-time high of $0.622416 on February 29, 2024, reflecting growing interest in enterprise-grade blockchain solutions.
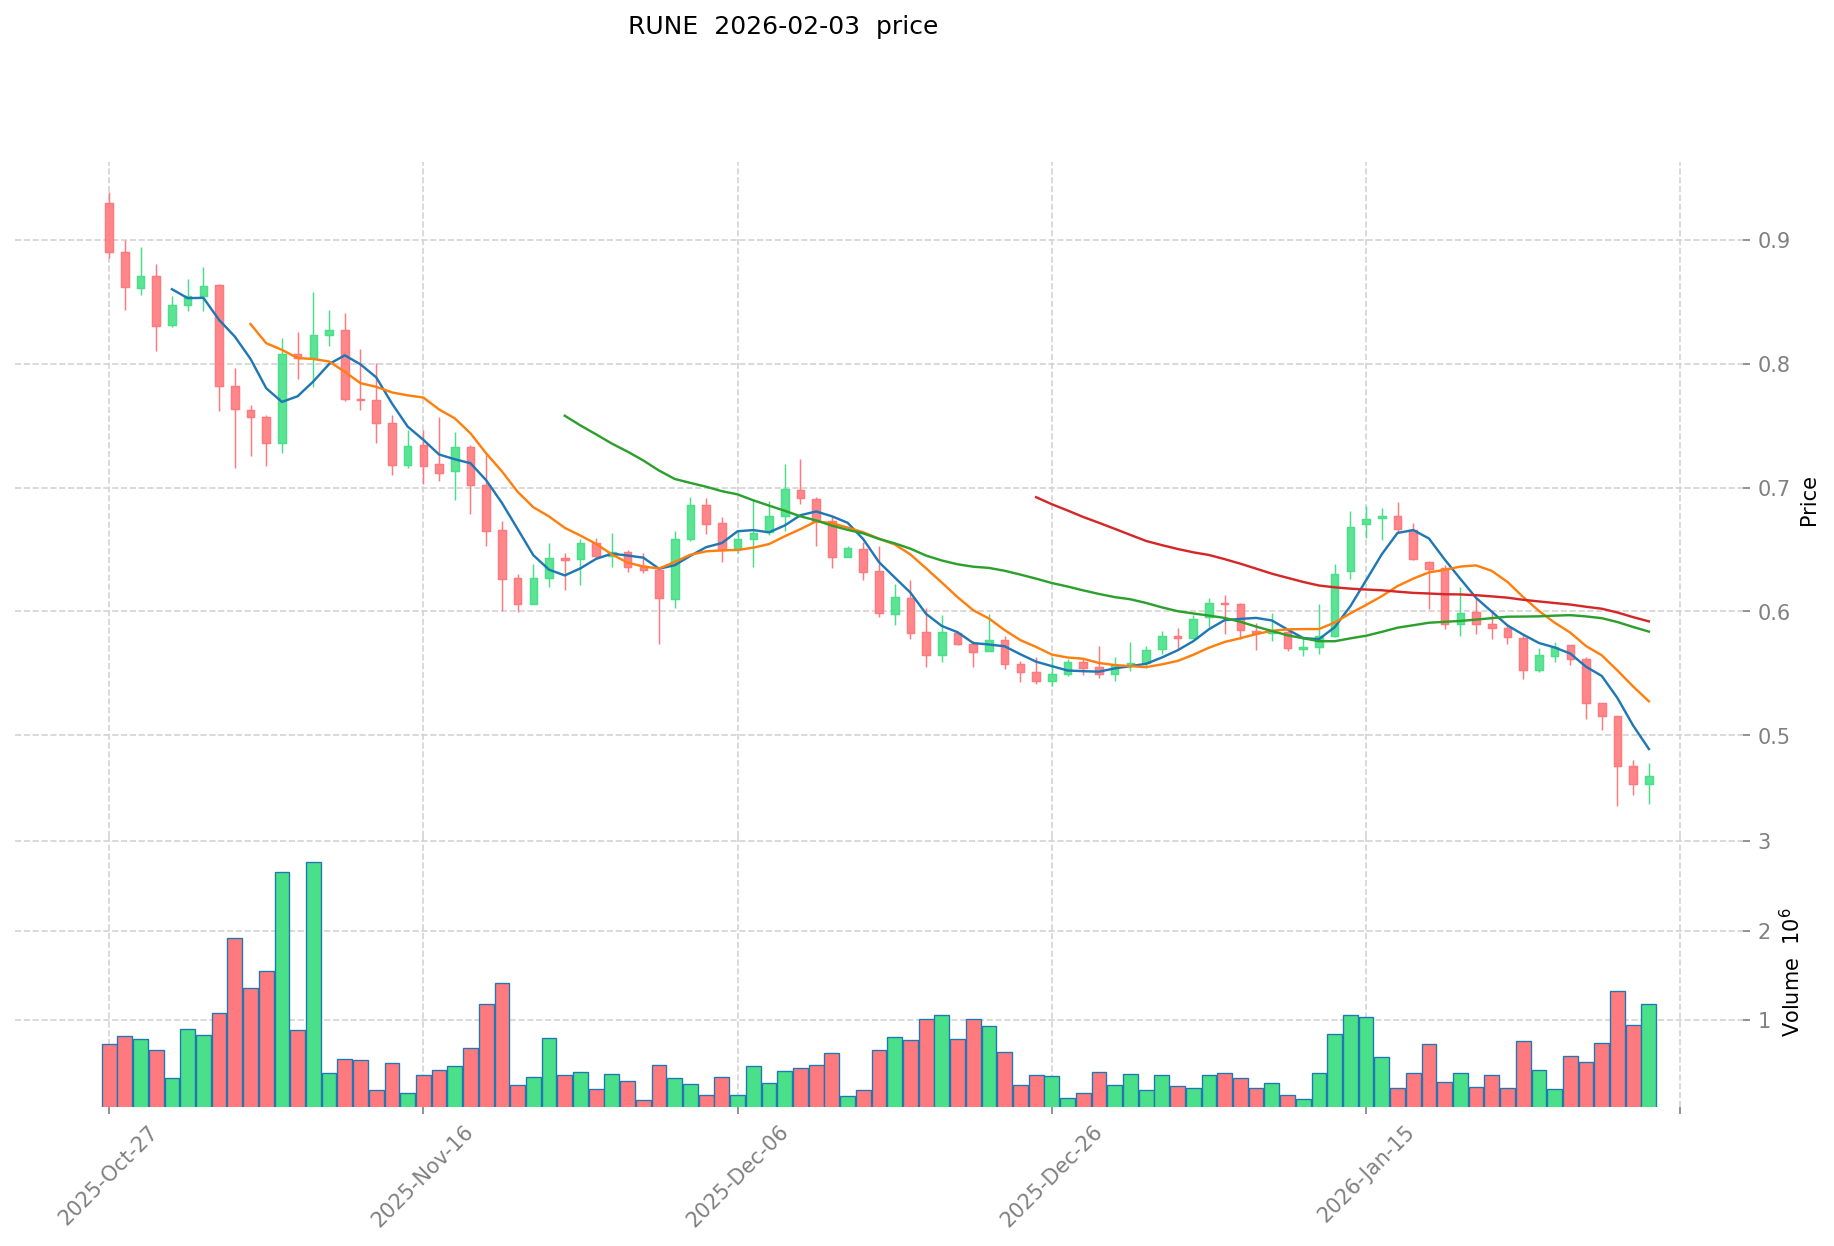
- Comparative Analysis: During the broader market correction cycle, TLOS declined from $0.622416 to its all-time low of $0.01681521 (recorded on February 3, 2026), while RUNE experienced a more pronounced drawdown from $20.87 to $0.00851264 (recorded on September 28, 2019).
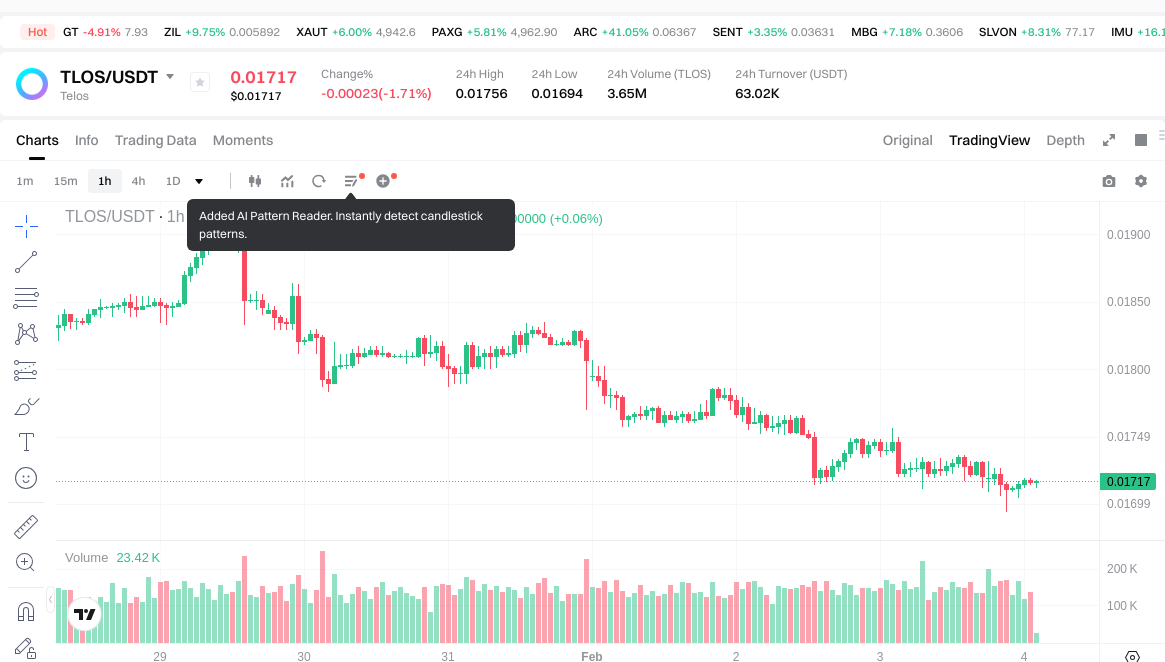
Current Market Status (February 4, 2026)
- TLOS current price: $0.01717
- RUNE current price: $0.4449
- 24-hour trading volume: TLOS at $62,900.02 vs RUNE at $330,156.95
- Market Sentiment Index (Fear & Greed Index): 17 (Extreme Fear)
Click to view real-time prices:
- View TLOS current price Market Price
- View RUNE current price Market Price
II. Core Factors Affecting TLOS vs RUNE Investment Value
Tokenomics Comparison
-
RUNE: The token operates within the THORChain ecosystem with a mechanism designed to facilitate cross-chain liquidity. Its supply dynamics are tied to network liquidity depth and validator operations, creating a relationship between token value and protocol usage.
-
TLOS: Information regarding specific supply mechanisms, inflation models, or burn schedules was not available in the provided materials.
-
📌 Historical Pattern: Supply mechanism designs can influence price cycles through their interaction with network demand and utility expansion.
Institutional Adoption and Market Application
-
Institutional Holdings: Available materials do not provide specific data comparing institutional preference between TLOS and RUNE.
-
Enterprise Adoption: The materials mention RUNE's association with THORChain's liquidity solutions and cross-chain swap functionality, which may have implications for decentralized exchange applications. Specific enterprise use cases for cross-border payments, settlements, or institutional portfolios were not detailed for either asset.
-
National Policy: Materials reference general regulatory developments in regions such as Hong Kong regarding cryptocurrency trading rules, but specific policy positions toward TLOS or RUNE were not provided.
Technical Development and Ecosystem Building
-
RUNE Technical Upgrades: Materials mention the introduction of streaming swaps on THORChain, which provides improved pricing for traders through sub-swaps. THORChain has expanded to support multiple blockchain ecosystems including Cosmos.
-
TLOS Technical Development: Specific technical upgrades, roadmap items, or protocol improvements for TLOS were not detailed in the available materials.
-
Ecosystem Comparison: RUNE operates within the THORChain DeFi ecosystem focused on cross-chain liquidity provision. Materials do not provide detailed comparisons of DeFi integration, NFT ecosystem presence, payment solutions, or smart contract implementation for either asset.
Macroeconomic Environment and Market Cycles
-
Performance in Inflationary Environments: Materials do not contain specific analysis comparing TLOS and RUNE performance characteristics during inflationary periods or their respective inflation-hedging properties.
-
Macroeconomic Monetary Policy: The materials reference general economic resilience indicators and monetary policy context but do not provide specific analysis of how interest rates or US dollar index movements affect TLOS or RUNE differently.
-
Geopolitical Factors: While materials mention cross-border transaction capabilities in the broader cryptocurrency context, specific analysis of how geopolitical developments or international transaction demand affects these two assets was not provided.
III. 2026-2031 Price Forecast: TLOS vs RUNE
Short-term Forecast (2026)
- TLOS: Conservative $0.0104-$0.0171 | Optimistic $0.0171-$0.0190
- RUNE: Conservative $0.236-$0.445 | Optimistic $0.445-$0.521
Medium-term Forecast (2028-2029)
- TLOS may enter a gradual growth phase, with projected price range of $0.018-$0.037
- RUNE may enter a consolidation phase, with projected price range of $0.305-$0.609
- Key drivers: institutional capital inflows, ETF developments, ecosystem expansion
Long-term Forecast (2030-2031)
- TLOS: Baseline scenario $0.027-$0.039 | Optimistic scenario $0.039-$0.050
- RUNE: Baseline scenario $0.311-$0.692 | Optimistic scenario $0.533-$0.809
Disclaimer
TLOS:
| Year | Predicted High Price | Predicted Average Price | Predicted Low Price | Price Change |
|---|---|---|---|---|
| 2026 | 0.0190032 | 0.01712 | 0.0104432 | 0 |
| 2027 | 0.024925008 | 0.0180616 | 0.012281888 | 5 |
| 2028 | 0.0300906256 | 0.021493304 | 0.02020370576 | 25 |
| 2029 | 0.037140429312 | 0.0257919648 | 0.01805437536 | 50 |
| 2030 | 0.04688463361344 | 0.031466197056 | 0.02706092946816 | 83 |
| 2031 | 0.050144531628441 | 0.03917541533472 | 0.027422790734304 | 128 |
RUNE:
| Year | Predicted High Price | Predicted Average Price | Predicted Low Price | Price Change |
|---|---|---|---|---|
| 2026 | 0.520767 | 0.4451 | 0.235903 | 0 |
| 2027 | 0.497421505 | 0.4829335 | 0.3863468 | 8 |
| 2028 | 0.59801655305 | 0.4901775025 | 0.3725349019 | 10 |
| 2029 | 0.609388671108 | 0.544097027775 | 0.304694335554 | 22 |
| 2030 | 0.8074399892181 | 0.5767428494415 | 0.31144113869841 | 29 |
| 2031 | 0.788984218035972 | 0.6920914193298 | 0.532910392883946 | 55 |
IV. Investment Strategy Comparison: TLOS vs RUNE
Long-term vs Short-term Investment Strategies
-
TLOS: May appeal to investors interested in enterprise-grade blockchain infrastructure and distributed application platforms. The asset's historical price movement from $0.622416 to $0.01717 reflects significant volatility, which may present considerations for both risk tolerance and potential value repositioning scenarios.
-
RUNE: May suit investors focused on cross-chain liquidity solutions and decentralized exchange infrastructure. The token's integration within the THORChain ecosystem positions it within the DeFi sector's liquidity provision segment.
Risk Management and Asset Allocation
-
Conservative Investors: A balanced approach might consider allocating based on risk tolerance and market conditions. Conservative positioning could involve lower exposure to higher-volatility assets, with consideration for 30-40% TLOS and 60-70% RUNE, though individual circumstances vary significantly.
-
Aggressive Investors: Those with higher risk tolerance might consider different allocation ratios, potentially 60-70% TLOS and 30-40% RUNE, depending on conviction in enterprise blockchain adoption versus DeFi infrastructure growth. However, portfolio construction should align with individual research and circumstances.
-
Hedging Tools: Portfolio risk management may incorporate stablecoin positions for liquidity preservation, derivatives instruments where available, and cross-asset diversification strategies to manage exposure to sector-specific developments.
V. Potential Risk Comparison
Market Risks
-
TLOS: The asset has experienced substantial price movement from its all-time high, with current trading near historical lows. Market depth, as indicated by 24-hour trading volume of $62,900.02, may present liquidity considerations during volatile periods. The broader market sentiment index at 17 (Extreme Fear) reflects challenging market conditions.
-
RUNE: While demonstrating higher trading volume at $330,156.95, the asset has also experienced significant historical volatility. Cross-chain liquidity protocols face market risks related to DeFi adoption cycles, network utilization rates, and competition from alternative bridge solutions.
Technical Risks
-
TLOS: Considerations include network scalability requirements for enterprise applications, operational stability of distributed application hosting, and technical development momentum. Materials do not provide specific details on recent protocol upgrades or technical roadmap items.
-
RUNE: Technical considerations involve the complexity of cross-chain architecture, potential smart contract vulnerabilities in liquidity protocols, and the security model of multi-chain operations. The introduction of streaming swaps represents ongoing protocol development, though technical risks inherent to cross-chain systems remain present.
Regulatory Risks
- Regulatory developments may affect both assets differently based on their functional classifications. Enterprise-focused blockchain platforms may face scrutiny regarding corporate adoption and data handling, while DeFi liquidity protocols face evolving regulatory frameworks around decentralized exchange operations and cross-border value transfer. Regional regulatory approaches, as referenced in materials regarding Hong Kong and broader cryptocurrency trading rules, continue to develop and may influence market access and institutional participation.
VI. Conclusion: Which Is the Better Buy?
📌 Investment Value Summary:
-
TLOS Characteristics: Positioned within enterprise-grade blockchain infrastructure with distributed application capabilities. Current price levels reflect significant distance from historical highs, presenting considerations regarding value positioning. The 2026-2031 forecast suggests potential price ranges from $0.0104 to $0.050 across various scenarios.
-
RUNE Characteristics: Operates within the cross-chain liquidity sector through THORChain infrastructure. The asset demonstrates higher current trading volume and price stability relative to historical ranges. Forecast models suggest price ranges from $0.236 to $0.809 through 2031 across different scenarios.
✅ Investment Considerations:
-
Beginning Investors: May benefit from understanding fundamental differences between enterprise blockchain platforms and DeFi liquidity protocols before allocation decisions. Starting with smaller positions while developing knowledge of each ecosystem's development trajectory and use cases could support informed decision-making.
-
Experienced Investors: Portfolio construction might consider both assets' positioning within different cryptocurrency sectors—enterprise infrastructure versus DeFi liquidity. Technical analysis of network metrics, development activity, and ecosystem growth indicators may inform allocation decisions based on individual market perspectives.
-
Institutional Participants: Evaluation factors may include regulatory clarity for each asset class, liquidity depth for position sizing, custody solutions availability, and alignment with institutional investment mandates regarding enterprise technology versus decentralized finance exposure.
⚠️ Risk Warning: Cryptocurrency markets exhibit high volatility. This content does not constitute investment advice. Conduct thorough research and consider consulting financial professionals before making investment decisions.
VII. FAQ
Q1: What are the main differences between TLOS and RUNE in terms of their core functionality?
TLOS is an enterprise-grade blockchain platform for hosting distributed applications, while RUNE powers THORChain's cross-chain liquidity protocol. TLOS focuses on providing fast transaction capabilities for business applications, positioning itself within the enterprise infrastructure sector. RUNE, launched in July 2019, operates within the DeFi ecosystem, facilitating cross-chain swaps and liquidity provision across multiple blockchain networks including Cosmos. The fundamental difference lies in their target markets: TLOS serves enterprise application hosting needs, whereas RUNE addresses decentralized exchange and cross-chain liquidity challenges.
Q2: How have TLOS and RUNE performed historically in terms of price volatility?
Both assets have experienced significant volatility, though with different patterns. RUNE reached an all-time high of $20.87 on May 19, 2021, subsequently declining to a low of $0.00851264 in September 2019, representing extreme volatility characteristic of early-stage DeFi protocols. TLOS achieved its all-time high of $0.622416 on February 29, 2024, and has since declined to $0.01681521 by February 3, 2026. As of February 4, 2026, TLOS trades at $0.01717 with 24-hour volume of $62,900.02, while RUNE trades at $0.4449 with volume of $330,156.95, indicating RUNE currently demonstrates higher liquidity and trading activity.
Q3: What are the price predictions for TLOS and RUNE through 2031?
For TLOS, conservative 2026 forecasts range from $0.0104 to $0.0171, with optimistic scenarios reaching $0.0190. By 2031, baseline predictions suggest $0.027-$0.039, with optimistic scenarios extending to $0.050. For RUNE, 2026 conservative estimates range from $0.236 to $0.445, with optimistic projections at $0.521. Long-term 2031 forecasts place RUNE between $0.311-$0.692 in baseline scenarios, potentially reaching $0.533-$0.809 in optimistic conditions. These projections reflect TLOS's potential for gradual recovery from current low levels and RUNE's positioning within the expanding DeFi liquidity sector, though actual outcomes depend on market conditions, adoption rates, and technological developments.
Q4: What portfolio allocation strategies might investors consider for TLOS vs RUNE?
Portfolio allocation depends significantly on individual risk tolerance and investment objectives. Conservative investors might consider 30-40% TLOS and 60-70% RUNE allocations, favoring RUNE's higher liquidity and established DeFi positioning. Aggressive investors with higher risk tolerance might reverse this ratio to 60-70% TLOS and 30-40% RUNE, betting on enterprise blockchain adoption and TLOS's potential recovery from current low prices. Both strategies should incorporate risk management tools including stablecoin positions for liquidity, derivatives for hedging where available, and cross-asset diversification. Individual circumstances, research conclusions, and market conditions should ultimately guide allocation decisions rather than general frameworks.
Q5: What are the primary risks investors should consider when choosing between TLOS and RUNE?
Market risks include TLOS's limited liquidity ($62,900 daily volume) and significant distance from all-time highs, presenting both value opportunity and liquidity concerns. RUNE faces DeFi sector volatility and competition from alternative cross-chain solutions. Technical risks for TLOS involve enterprise scalability requirements and development momentum uncertainties, while RUNE contends with cross-chain architecture complexity and potential smart contract vulnerabilities. Regulatory risks differ by asset classification: enterprise blockchain platforms may face corporate adoption scrutiny, while DeFi protocols navigate evolving frameworks around decentralized exchange operations. The current market sentiment index of 17 (Extreme Fear) reflects challenging conditions affecting both assets.
Q6: Which asset might be more suitable for different investor profiles?
Beginning investors may find RUNE more accessible due to higher liquidity, clearer DeFi use cases, and more established trading patterns, though they should develop understanding of cross-chain protocols before investing. Experienced investors might evaluate TLOS for its enterprise infrastructure positioning and potential value repositioning from current low levels, while considering RUNE for DeFi ecosystem exposure and established liquidity provision networks. Institutional participants may favor RUNE's higher trading volume and DeFi sector clarity, though enterprise-focused institutions might find TLOS's business application positioning more aligned with corporate blockchain mandates. Ultimately, suitability depends on individual research, risk tolerance, sector conviction, and portfolio diversification objectives rather than investor experience level alone.
Share
Content
Introduction: Investment Comparison Between TLOS and RUNE
I. Historical Price Comparison and Current Market Status
II. Core Factors Affecting TLOS vs RUNE Investment Value
III. 2026-2031 Price Forecast: TLOS vs RUNE
IV. Investment Strategy Comparison: TLOS vs RUNE
V. Potential Risk Comparison
VI. Conclusion: Which Is the Better Buy?
VII. FAQ
How to Buy Cryptocurrency


Trending Cryptocurrencies


What will be the market capitalization of USDC in 2025? Analysis of the stablecoin market landscape.

How is DeFi different from Bitcoin?

What is DeFi: Understanding Decentralized Finance in 2025

USDC stablecoin 2025 Latest Analysis: Principles, Advantages, and Web3 Eco-Applications
Development of Decentralized Finance Ecosystem in 2025: Integration of Decentralized Finance Applications with Web3
2025 USDT USD Complete Guide: A Must-Read for Newbie Investors

KP3R vs SNX: A Comprehensive Comparison of Two Leading DeFi Protocol Tokens
Top Cryptocurrency Exchanges Offering Card Withdrawals
What is a node in cryptocurrency and how do you set one up
Top 6 Real-World Asset (RWA) Tokens: How to Buy and Where to Access Them in Japan

What is mobile mining, and can you make money with it?