This comprehensive comparison analyzes KP3R and SNX, two leading DeFi protocol tokens with distinct market positioning. KP3R, a decentralized task execution platform launched in 2020, has declined from its $1,995.53 peak to $1.72, while SNX, a synthetic asset protocol since 2018, dropped from $28.53 to $0.34. The article examines historical price trends, tokenomics differences, institutional adoption patterns, and technical ecosystems. SNX demonstrates lower market risk through superior market capitalization ($117.36M vs $0.82M) and trading volume. Price predictions through 2031 suggest KP3R ranging $2.09-$3.90 and SNX $0.33-$0.69 under base scenarios. Investment suitability varies by investor profile: conservative investors may favor SNX (70% allocation), while aggressive investors might balance both equally. Both tokens face regulatory uncertainties and DeFi sector volatility, requiring careful risk management and ongoing protocol metric monitoring for informed investment decisions.
Introduction: Investment Comparison Between KP3R and SNX
In the cryptocurrency market, the comparison between KP3R vs SNX has consistently been a topic investors cannot overlook. Both projects demonstrate notable differences in market capitalization ranking, application scenarios, and price performance, while representing distinct positioning within the crypto asset landscape.
KP3R (Keep3rV1): Launched in 2020, this decentralized work matching platform has gained market recognition through its unique approach to connecting external developers with projects requiring specific tasks. The platform facilitates a keeper network where participants execute jobs and earn KP3R token rewards.
SNX (Synthetix): Since its launch in 2018 (formerly known as Havven), Synthetix has established itself as a protocol for synthetic assets, enabling users to create and trade derivatives representing various assets including fiat currencies, precious metals, indices, and other cryptocurrencies.
This article will provide a comprehensive analysis of KP3R vs SNX investment value comparison, focusing on historical price trends, supply mechanisms, institutional adoption, technological ecosystems, and future projections, attempting to address the question investors care about most:
"Which is the better buy right now?"
I. Historical Price Comparison and Current Market Status
Keep3rV1 (KP3R) and Synthetix (SNX) Historical Price Trends
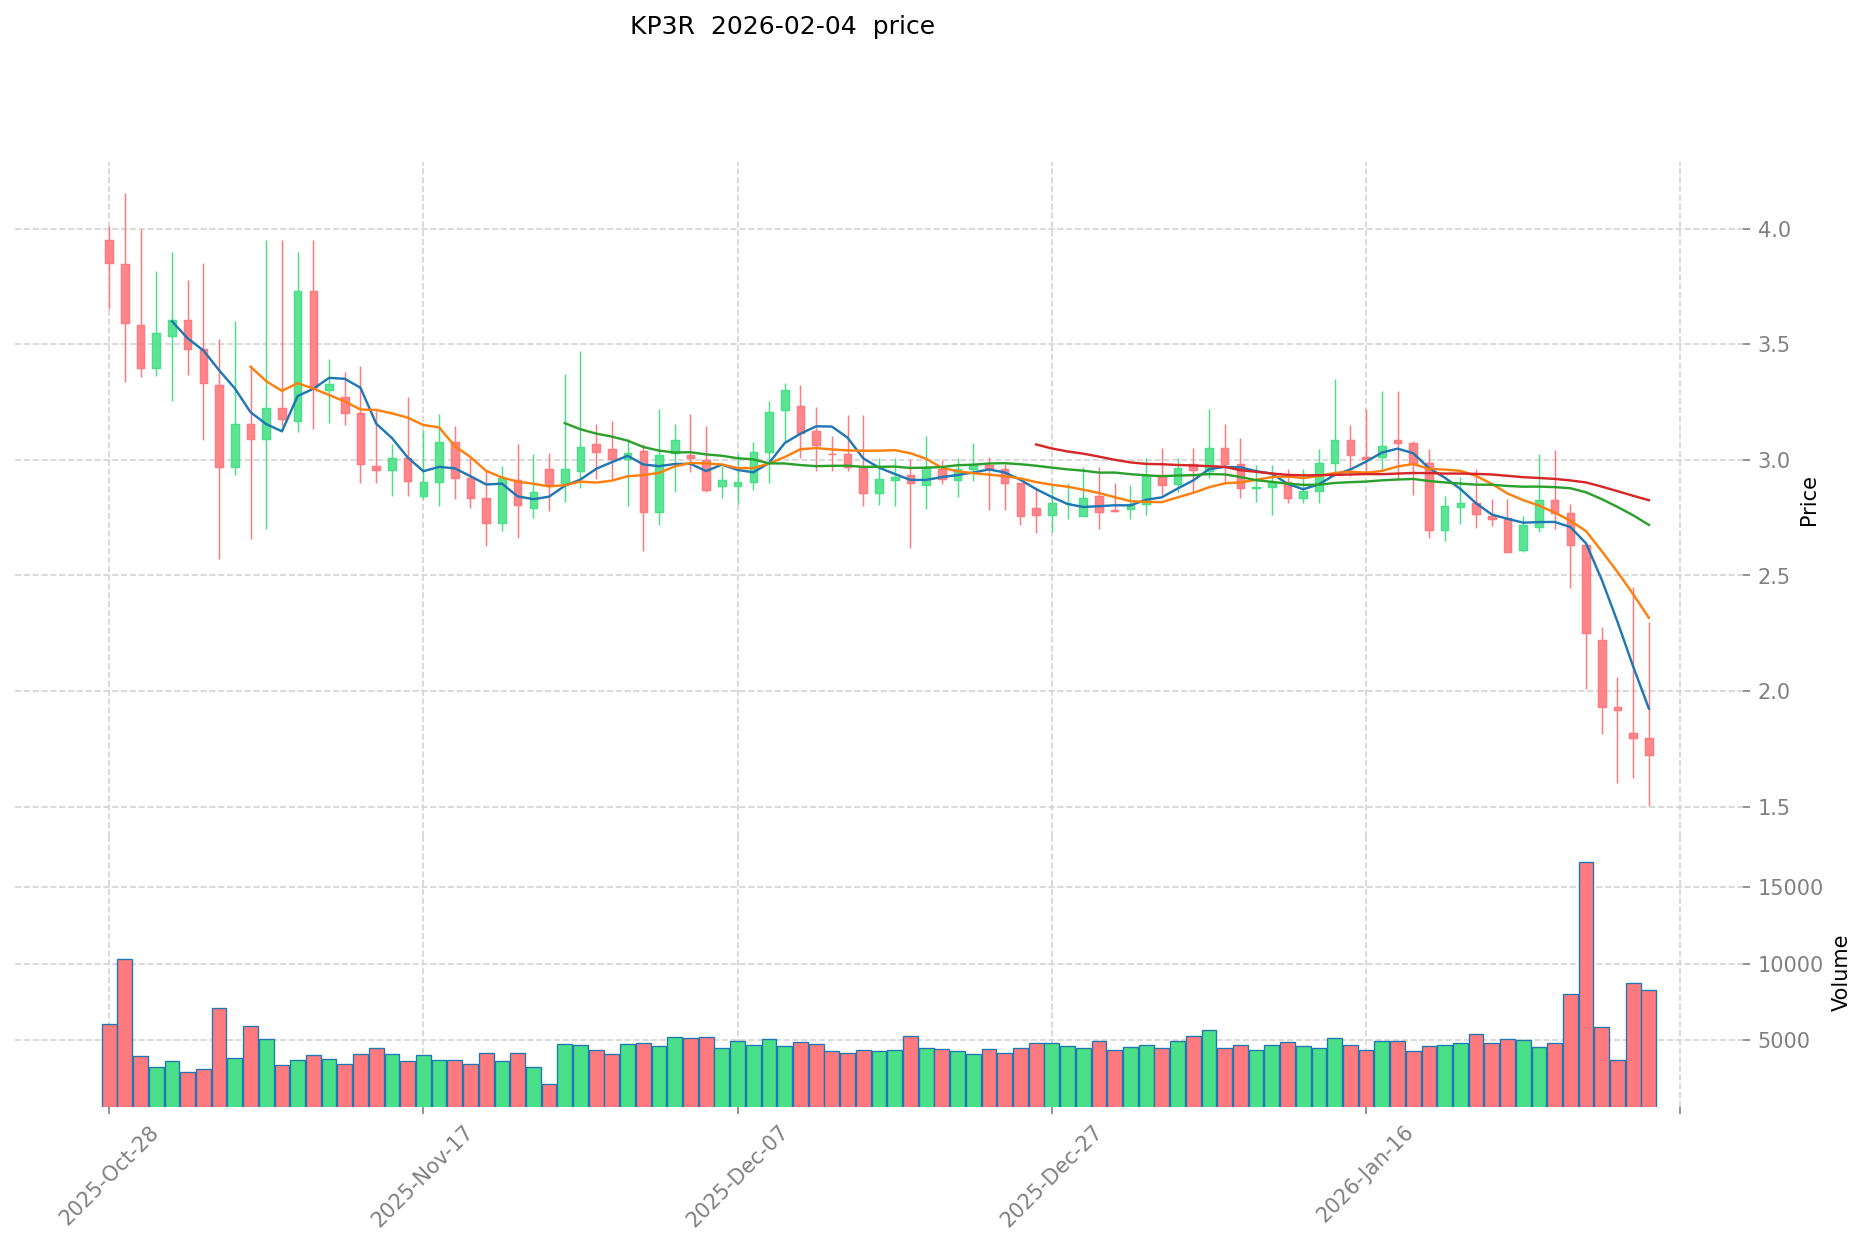
- 2021: KP3R experienced notable price movements, reaching an all-time high of $1,995.53 on November 13, 2021. During this period, the broader DeFi sector showed strong momentum.
- 2018: SNX launched in March 2018 with an initial offering price of $0.90, establishing its presence in the decentralized finance ecosystem.
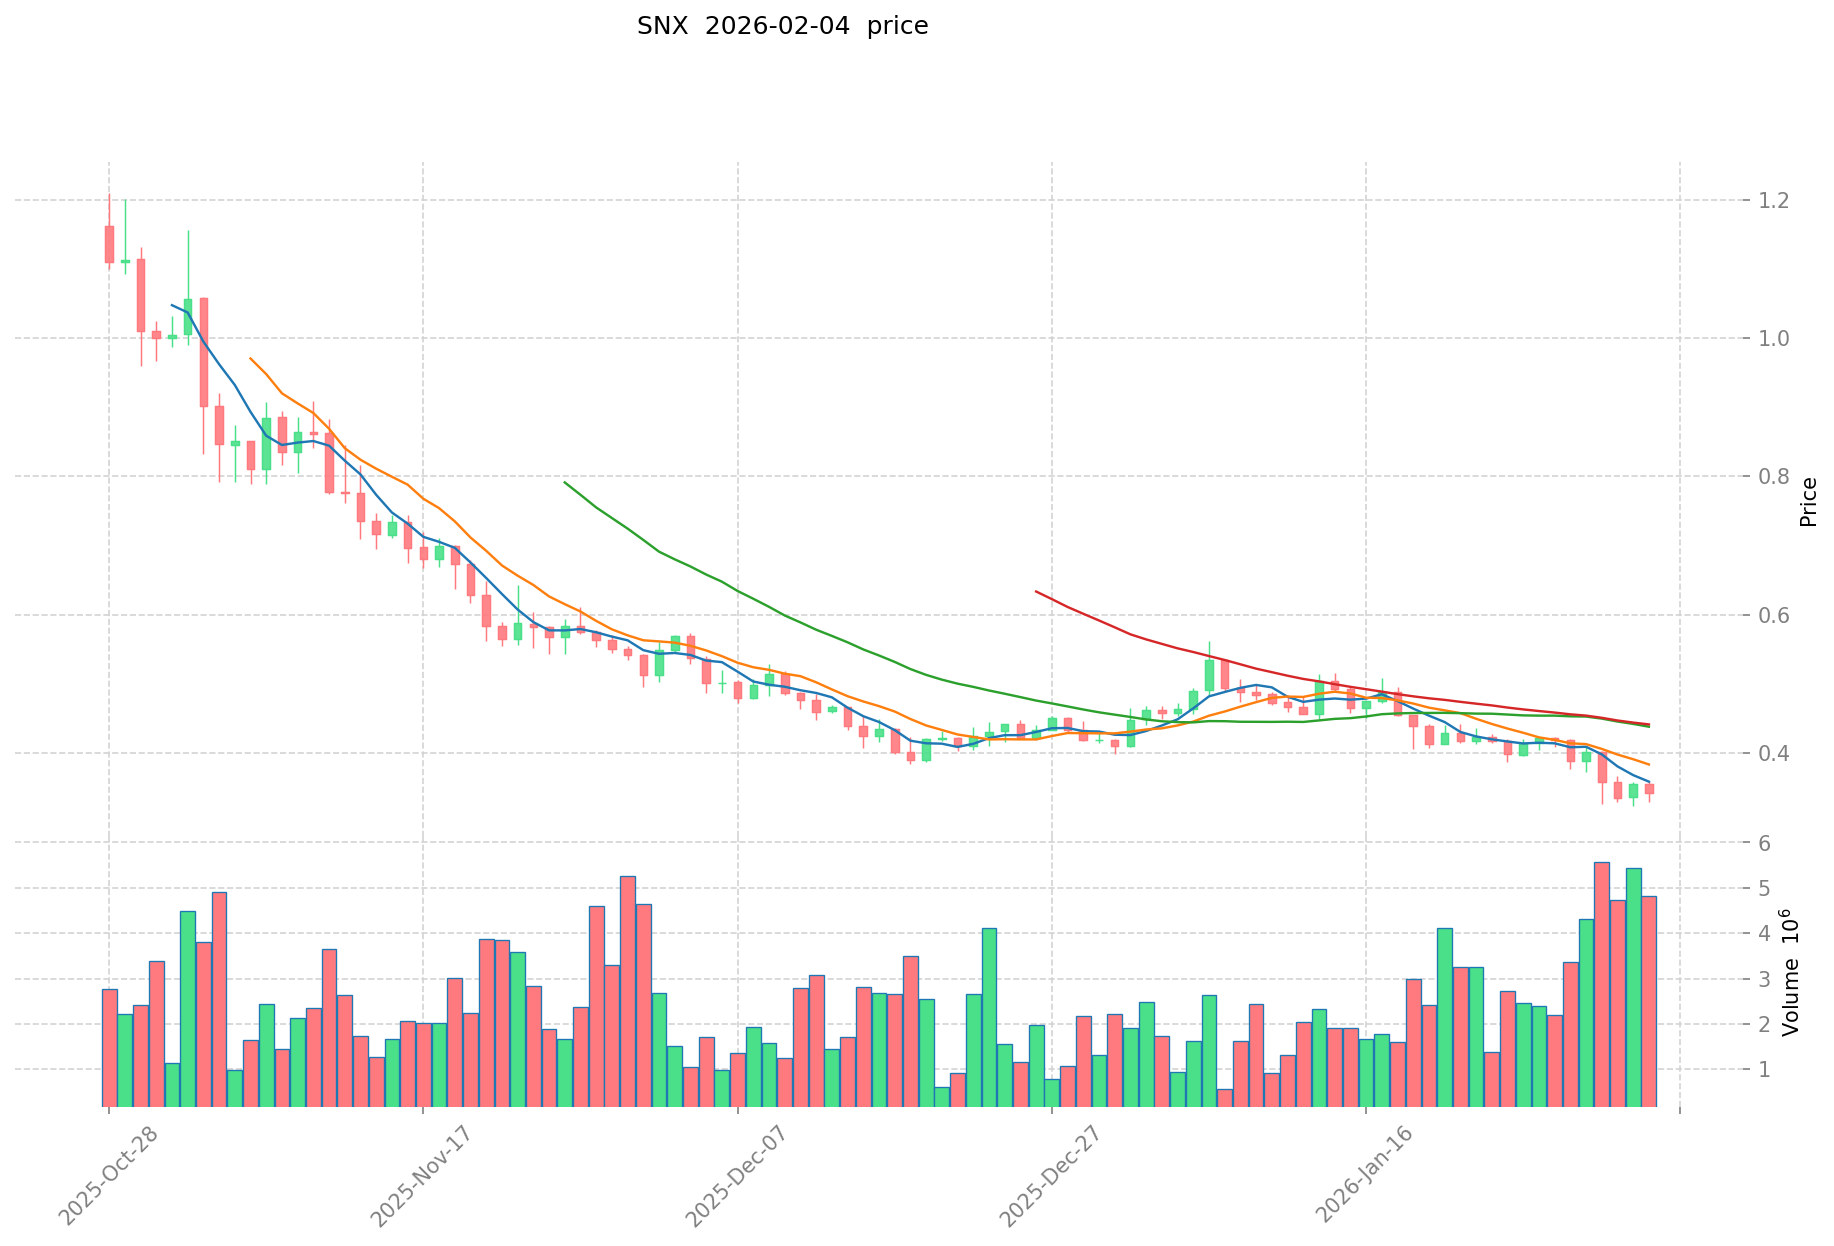
- 2021: SNX reached its all-time high of $28.53 on February 14, 2021, reflecting increased interest in synthetic asset protocols during the DeFi expansion phase.
- Comparative Analysis: Throughout recent market cycles, KP3R has declined from its peak of $1,995.53 to its current level near $1.72, representing substantial downward movement. SNX has similarly declined from $28.53 to approximately $0.34, showing comparable market challenges.
Current Market Status (February 04, 2026)
- KP3R Current Price: $1.722
- SNX Current Price: $0.3417
- 24-Hour Trading Volume: KP3R recorded $14,421.69 compared to SNX's $1,674,686.54
- Market Capitalization: KP3R at $819,866.95 versus SNX at $117,362,406.35
- 24-Hour Price Change: KP3R decreased by 4.28%, while SNX declined by 3.72%
- Market Sentiment Index (Fear & Greed Index): 17 (Extreme Fear)
View real-time prices:
II. Core Factors Influencing KP3R vs SNX Investment Value
Tokenomics Comparison
- KP3R: Operates within the Keep3r Network as a decentralized task execution marketplace token. The token serves as the governance and utility asset for coordinating work between protocols requiring maintenance and external keepers who perform these tasks.
- SNX: Functions as the governance and collateral token for the Synthetix protocol. SNX holders can stake their tokens to mint synthetic assets and earn rewards from trading fees and inflationary incentives.
- 📌 Historical Pattern: Both tokens feature utility-driven models where value accrues through protocol usage and staking mechanisms, though their specific economic designs differ significantly in purpose and structure.
Institutional Adoption and Market Application
- Institutional Holdings: Both projects operate primarily within the DeFi ecosystem, with adoption patterns reflecting their respective niches—KP3R in automated protocol maintenance and SNX in synthetic asset creation.
- Enterprise Adoption: KP3R focuses on providing infrastructure for DeFi protocols requiring automated keeper services, while SNX aims to establish itself as a liquidity layer supporting broader DeFi applications.
- Regulatory Landscape: Both projects face evolving regulatory considerations as DeFi protocols navigate compliance requirements across different jurisdictions.
Technical Development and Ecosystem Building
- KP3R Technical Position: The project centers on its Keep3r Network platform, which addresses the need for decentralized task execution. The platform's technical architecture supports various DeFi protocols requiring automated maintenance operations.
- SNX Technical Direction: SNX positions itself to become a foundational liquidity layer for DeFi applications. The protocol initially targets technically sophisticated users but maintains ambitions for broader accessibility.
- Ecosystem Comparison: KP3R serves a specialized infrastructure role within DeFi, while SNX operates across synthetic asset creation and DeFi liquidity provision. Both projects demonstrate technical foundations aligned with their respective use cases.
Macroeconomic Environment and Market Cycles
- Performance Under Economic Conditions: Both tokens exhibit volatility characteristics typical of DeFi protocols, with value influenced by overall cryptocurrency market sentiment and specific protocol adoption rates.
- Monetary Policy Impact: Interest rate changes and broader financial market conditions affect risk appetite for DeFi investments, impacting both KP3R and SNX through liquidity flows and investor positioning.
- Market Structure Factors: The performance of both tokens correlates with DeFi sector growth, protocol usage metrics, and the evolving competitive landscape within their respective niches.
III. 2026-2031 Price Prediction: KP3R vs SNX
Short-term Forecast (2026)
- KP3R: Conservative $1.36-$1.72 | Optimistic $1.72-$2.26
- SNX: Conservative $0.32-$0.34 | Optimistic $0.34-$0.50
Medium-term Forecast (2028-2029)
- KP3R may enter a moderate growth phase, with estimated price range of $1.70-$3.96
- SNX may enter a gradual expansion phase, with estimated price range of $0.24-$0.57
- Key drivers: institutional capital inflows, ETF developments, ecosystem expansion
Long-term Forecast (2030-2031)
- KP3R: Base scenario $2.09-$3.46 | Optimistic scenario $3.39-$3.90
- SNX: Base scenario $0.33-$0.55 | Optimistic scenario $0.54-$0.69
View detailed price predictions for KP3R and SNX
Disclaimer: Price predictions are based on historical data analysis and market trend modeling. Cryptocurrency markets are highly volatile and subject to numerous unpredictable factors. These forecasts should not be construed as investment advice. Users should conduct independent research and consult qualified financial advisors before making any investment decisions.
KP3R:
| Year |
Predicted High Price |
Predicted Average Price |
Predicted Low Price |
Price Change |
| 2026 |
2.25582 |
1.722 |
1.36038 |
0 |
| 2027 |
2.3668029 |
1.98891 |
1.4717934 |
15 |
| 2028 |
3.179670417 |
2.17785645 |
1.698728031 |
26 |
| 2029 |
3.96456988158 |
2.6787634335 |
2.437674724485 |
55 |
| 2030 |
3.4545333238416 |
3.32166665754 |
2.0926499942502 |
92 |
| 2031 |
3.89631498929442 |
3.3880999906908 |
2.608836992831916 |
96 |
SNX:
| Year |
Predicted High Price |
Predicted Average Price |
Predicted Low Price |
Price Change |
| 2026 |
0.501711 |
0.3413 |
0.324235 |
0 |
| 2027 |
0.434150665 |
0.4215055 |
0.299268905 |
23 |
| 2028 |
0.52195026065 |
0.4278280825 |
0.235305445375 |
25 |
| 2029 |
0.57461589760575 |
0.474889171575 |
0.28968239466075 |
38 |
| 2030 |
0.54574263597399 |
0.524752534590375 |
0.325346571446032 |
53 |
| 2031 |
0.685116909161193 |
0.535247585282182 |
0.347910930433418 |
56 |
IV. Investment Strategy Comparison: KP3R vs SNX
Long-term vs Short-term Investment Strategies
- KP3R: May appeal to investors focused on DeFi infrastructure and automated protocol maintenance systems. The token's utility within the Keep3r Network positions it for those interested in decentralized task execution markets.
- SNX: May attract investors seeking exposure to synthetic asset protocols and DeFi liquidity provision. The project's focus on derivative asset creation appeals to those interested in expanding DeFi financial instruments.
Risk Management and Asset Allocation
- Conservative Investors: KP3R: 30% vs SNX: 70%
- Aggressive Investors: KP3R: 50% vs SNX: 50%
- Hedging Tools: Stablecoin allocation, options strategies, cross-asset portfolio diversification
V. Potential Risk Comparison
Market Risk
- KP3R: Exposure to DeFi sector volatility, limited trading volume ($14,421.69 in 24-hour period), smaller market capitalization ($819,866.95) may result in higher price sensitivity to market movements.
- SNX: Subject to broader DeFi market conditions, synthetic asset adoption rates, and competition within the derivatives protocol space. Trading volume of $1,674,686.54 indicates moderate liquidity characteristics.
Technical Risk
- KP3R: Network scalability considerations, dependency on keeper participation rates, protocol maintenance requirements.
- SNX: Smart contract complexity associated with synthetic asset creation, collateralization ratio management, protocol upgrade implementation.
Regulatory Risk
- Global regulatory developments may impact both projects differently based on their operational models. KP3R's infrastructure role and SNX's synthetic asset creation may face distinct compliance considerations across various jurisdictions.
VI. Conclusion: Which Is the Better Buy?
📌 Investment Value Summary:
- KP3R Characteristics: Specialized infrastructure positioning within DeFi automation, serves niche market for protocol maintenance services, lower market capitalization with associated volatility characteristics.
- SNX Characteristics: Established presence in synthetic asset protocols since 2018, broader DeFi ecosystem integration, larger market capitalization ($117,362,406.35) relative to KP3R.
✅ Investment Considerations:
- Novice Investors: Consider starting with smaller position sizes, focus on understanding each protocol's specific use case, prioritize risk management through diversification.
- Experienced Investors: Evaluate protocol-specific metrics including adoption rates, ecosystem developments, and technical roadmap progress when determining allocation strategies.
- Institutional Investors: Assess liquidity characteristics, regulatory compliance frameworks, and long-term protocol sustainability when considering position sizing.
⚠️ Risk Disclosure: Cryptocurrency markets demonstrate substantial volatility. This content does not constitute investment advice.
VII. FAQ
Q1: What are the primary differences between KP3R and SNX in terms of their core functionality?
KP3R functions as a decentralized task execution marketplace token within the Keep3r Network, while SNX operates as a governance and collateral token for synthetic asset creation. Specifically, KP3R connects external developers (keepers) with protocols requiring automated maintenance operations, serving as both a coordination mechanism and reward system for task completion. In contrast, SNX enables users to stake tokens as collateral to mint synthetic assets (Synths) representing various real-world assets including fiat currencies, commodities, and indices. The fundamental distinction lies in their operational focus: KP3R addresses DeFi infrastructure automation needs, whereas SNX facilitates derivative asset creation and trading within the decentralized finance ecosystem.
Q2: Which token presents lower market risk based on current metrics?
SNX demonstrates relatively lower market risk characteristics compared to KP3R based on several quantitative factors. SNX maintains significantly higher market capitalization ($117,362,406.35 versus $819,866.95), substantially greater 24-hour trading volume ($1,674,686.54 compared to $14,421.69), and broader liquidity distribution across exchanges. These metrics indicate enhanced price stability, easier position entry/exit capabilities, and reduced susceptibility to large order impacts. However, both tokens exhibit volatility consistent with DeFi protocols and have declined substantially from their all-time highs—KP3R from $1,995.53 to $1.72 (99.9% decline) and SNX from $28.53 to $0.34 (98.8% decline)—suggesting investors should maintain appropriate risk management regardless of selection.
Q3: How do the tokenomics models of KP3R and SNX differ in value accrual mechanisms?
Both tokens employ utility-driven models but operate through distinct value accrual mechanisms aligned with their respective protocols. KP3R derives value from its role within the Keep3r Network ecosystem, where token holders participate in governance decisions and keepers earn KP3R rewards for executing protocol maintenance tasks. The token's value correlates with network usage rates, keeper participation levels, and the breadth of protocols requiring automated services. SNX implements a staking-based collateralization system where token holders lock SNX to mint synthetic assets, earning protocol trading fees and inflationary rewards in return. SNX value accrual depends on synthetic asset trading volumes, staking participation rates, and the overall growth of the Synthetix derivatives ecosystem. The fundamental difference centers on task marketplace economics (KP3R) versus collateralized asset creation economics (SNX).
Q4: What are the predicted price trajectories for KP3R and SNX through 2031?
Price predictions indicate divergent trajectories for both assets through 2031, though both face substantial uncertainty. For KP3R, conservative 2026 estimates range from $1.36-$1.72, expanding to $2.09-$3.46 by 2030-2031 under base scenarios, with optimistic projections reaching $3.90 by 2031. SNX conservative forecasts suggest $0.32-$0.34 for 2026, progressing to $0.33-$0.55 by 2030-2031 in base scenarios, with optimistic estimates approaching $0.69 by 2031. These projections suggest KP3R may experience higher percentage growth from current levels (potentially 126% increase from current price to 2031 optimistic scenario) compared to SNX (approximately 102% increase under similar conditions). However, these forecasts rely on historical data modeling and market trend analysis, which cannot account for regulatory changes, technological disruptions, competitive dynamics, or macroeconomic shifts that substantially impact cryptocurrency valuations.
Q5: Which token better suits different investor profiles?
Investment suitability depends on individual risk tolerance, investment timeframe, and portfolio objectives. Conservative investors seeking relative stability may favor SNX allocations (70%) over KP3R (30%) due to SNX's larger market capitalization, established protocol history since 2018, higher trading volumes, and broader ecosystem integration. Aggressive investors comfortable with higher volatility and specialized protocol exposure might consider balanced allocations (50% KP3R, 50% SNX) to capture potential upside from both DeFi infrastructure automation and synthetic asset growth. Novice investors should prioritize smaller position sizes initially, focusing on understanding each protocol's specific use case and maintaining diversification across stablecoins and established cryptocurrencies. Institutional investors evaluating either asset should assess liquidity characteristics, regulatory compliance frameworks, protocol sustainability metrics, and correlation with broader DeFi sector performance when determining appropriate allocation strategies.
Q6: What regulatory risks distinguish KP3R and SNX investments?
Both projects face evolving regulatory considerations, though their operational models present distinct compliance challenges. SNX's synthetic asset creation functionality may attract heightened regulatory scrutiny as authorities worldwide develop frameworks for derivative instruments, securities tokenization, and decentralized trading platforms. The protocol's ability to create synthetic representations of traditional financial assets positions it at the intersection of DeFi innovation and securities regulation, potentially requiring compliance with commodity futures regulations, securities laws, or financial derivatives oversight depending on jurisdiction. KP3R's infrastructure-focused role as a decentralized task marketplace may face different regulatory considerations centered on labor coordination frameworks, service provision classification, and potential requirements for intermediary licensing. Both projects operate in jurisdictions with varying cryptocurrency regulations, creating compliance complexity as global regulatory frameworks continue developing. Investors should monitor regulatory announcements from major financial authorities including the SEC, CFTC, European Commission, and corresponding Asian regulatory bodies, as policy decisions may significantly impact protocol operations and token valuations.
Q7: How do technical development trajectories compare between the two projects?
KP3R and SNX pursue distinct technical development paths aligned with their respective protocol objectives. KP3R's technical roadmap centers on expanding its Keep3r Network infrastructure, enhancing keeper coordination mechanisms, improving task matching algorithms, and scaling protocol maintenance capabilities across the growing DeFi ecosystem. Development priorities focus on network efficiency, keeper incentive optimization, and integration with additional protocols requiring automated operations. SNX technical development emphasizes becoming a foundational liquidity layer for decentralized finance, implementing protocol upgrades to improve synthetic asset creation efficiency, expanding available Synths across diverse asset classes, and enhancing collateralization mechanisms. Recent development efforts include transitioning to optimized Layer 2 solutions for reduced transaction costs, implementing governance improvements, and expanding cross-chain compatibility. Both projects demonstrate active technical development, though SNX maintains a longer operational history (2018 versus 2020 for KP3R) providing established development patterns and community feedback integration processes.
Q8: What factors should investors monitor when evaluating these assets ongoing?
Ongoing evaluation requires monitoring protocol-specific metrics alongside broader market indicators. For KP3R, key metrics include keeper network participation rates, number of protocols utilizing Keep3r services, task execution volumes, network usage growth, and governance proposal activity. Technical developments such as protocol upgrades, partnership announcements with major DeFi platforms, and keeper reward structure modifications provide important signals. For SNX, critical metrics encompass total value locked in the protocol, synthetic asset trading volumes, staking participation rates, collateralization ratios, available Synth variety, and integration with other DeFi platforms. Both assets require monitoring of broader indicators including DeFi sector growth rates, regulatory developments affecting decentralized protocols, macroeconomic conditions influencing risk asset appetite, institutional capital flows into cryptocurrency markets, and competitive dynamics within their respective niches. The current Fear & Greed Index level of 17 (Extreme Fear) suggests market sentiment significantly impacts short-term price movements, warranting attention to sentiment indicators alongside fundamental protocol metrics.
* The information is not intended to be and does not constitute financial advice or any other recommendation of any sort offered or endorsed by Gate.