WAM vs AAVE: A Comprehensive Comparison of DeFi Lending Protocols and Their Market Impact

Introduction: WAM vs AAVE Investment Comparison
In the cryptocurrency market, the comparison between WAM and AAVE has consistently been a topic that investors cannot overlook. The two differ significantly in market capitalization ranking, application scenarios, and price performance, representing distinct positioning within the crypto asset landscape. WAM (WAM): Launched in 2021, it has gained market recognition as a play-to-earn crypto gaming platform where users can compete in casual tournaments to earn crypto rewards. AAVE (AAVE): Since its introduction in 2020, it has been positioned as a decentralized lending protocol, becoming one of the crypto assets with substantial trading volume and market presence. This article will comprehensively analyze the investment value comparison between WAM and AAVE, focusing on historical price trends, supply mechanisms, institutional adoption, technical ecosystems, and future predictions, attempting to address the question investors care about most:
"Which is the better buy right now?"
I. Historical Price Comparison and Market Status
WAM and AAVE Historical Price Trends
- 2021: WAM reached a price level of $0.194038 in December, representing a significant peak during the broader crypto market bull cycle.
- 2021: AAVE achieved its all-time high of $661.69 in May, benefiting from the DeFi sector expansion and increased institutional interest in decentralized lending protocols.
- Comparative Analysis: During the 2021-2026 market cycle, WAM declined from its peak of $0.194038 to a low of $0.00053227, while AAVE decreased from $661.69 to $26.02, showing both assets experienced substantial corrections from their historical highs.
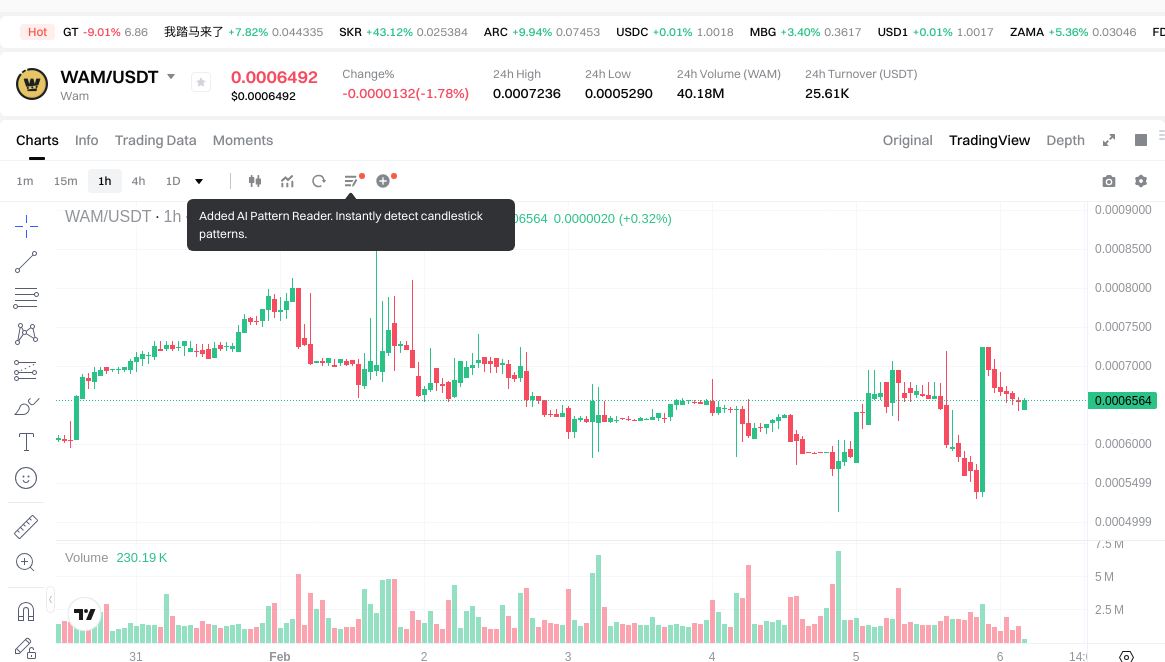
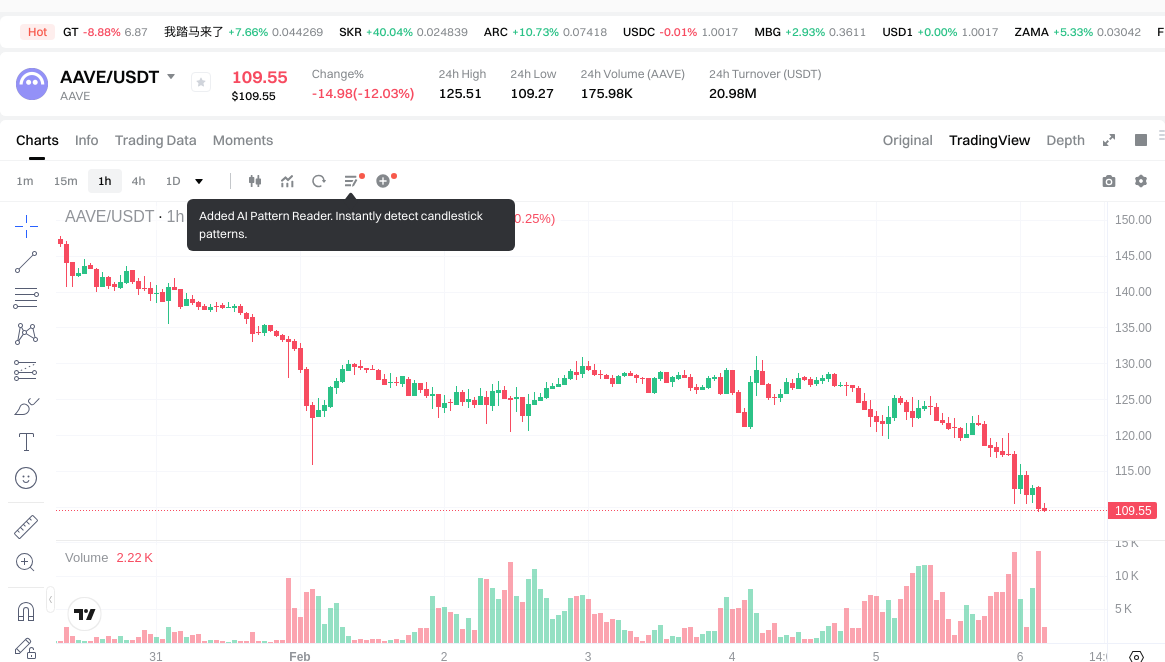
Current Market Status (February 6, 2026)
- WAM Current Price: $0.0006593
- AAVE Current Price: $110.05
- 24-Hour Trading Volume: WAM $25,608.38 vs AAVE $20,865,755.85
- Market Sentiment Index (Fear & Greed Index): 12 (Extreme Fear)
View real-time prices:
- Check WAM current price Market Price
- Check AAVE current price Market Price
II. Core Factors Influencing WAM vs AAVE Investment Value
Supply Mechanism Comparison (Tokenomics)
-
AAVE: The AAVE token operates under a governance and staking model with a capped supply structure. Token holders can participate in protocol governance decisions and stake tokens in the Safety Module to earn rewards while providing risk coverage for the protocol. The staking mechanism reduces circulating supply, potentially creating upward price pressure during periods of increased platform adoption.
-
📌 Historical Pattern: Supply dynamics in DeFi lending protocols demonstrate correlation between Total Value Locked (TVL) growth and token valuation. According to reference materials, Aave's TVL recovery to 51% of its 2021 cycle peak, driven by increased deposits and appreciation in underlying assets like WBTC and ETH, reflects how protocol utilization influences token demand through governance participation and yield opportunities.
Institutional Adoption and Market Application
-
Institutional positioning: Aave has established itself as a core infrastructure component within decentralized finance, attracting attention from institutional participants seeking yield opportunities and lending services in the crypto ecosystem.
-
Enterprise adoption: Aave's multi-chain deployment strategy enables cross-chain lending functionality, expanding its operational scope across various blockchain networks. This technical infrastructure supports institutional use cases in liquidity management and collateralized borrowing.
-
Regulatory landscape: Regulatory compliance frameworks vary significantly across jurisdictions. The reference materials indicate that enhanced regulatory clarity can strengthen platform credibility, though specific regulatory approvals were not detailed in the provided context.
Technical Development and Ecosystem Building
-
AAVE technical upgrades: The protocol's evolution from its original P2P model to a liquidity pool-based architecture improved capital efficiency and user experience. The platform's signature flash loan mechanism represents a technical innovation that enables uncollateralized borrowing within single-transaction blocks.
-
Ecosystem comparison: Aave operates within the DeFi lending sector, competing with platforms like Compound. The protocol supports multiple interest rate models (variable and stable rates) and has integrated with various DeFi primitives. Reference materials note that Aave's innovation pace and value capture model influence its competitive positioning relative to other lending protocols.
-
Cross-chain interoperability: Development efforts focus on enabling cross-chain lending capabilities, potentially expanding the range of digital assets available for lending and storage on the platform, thereby broadening the token's utility scope.
Macroeconomic Environment and Market Cycles
-
Performance during inflation: DeFi lending protocols provide yield-generating opportunities that may attract capital during inflationary periods, though their performance characteristics differ from traditional inflation hedges. Market demand dynamics and liquidity pool efficiency remain primary value drivers.
-
Macroeconomic policy impact: Interest rate environments and broader cryptocurrency market cycles influence DeFi protocol utilization. Reference materials indicate that market demand, supply dynamics (including staking rates affecting circulation), and regulatory developments constitute key internal and external factors affecting token valuations.
-
Geopolitical considerations: While not extensively covered in the reference materials for AAVE specifically, broader crypto market dynamics suggest that cross-border transaction demand and international regulatory developments can impact decentralized finance adoption patterns.
III. 2026-2031 Price Forecast: WAM vs AAVE
Short-term Forecast (2026)
- WAM: Conservative $0.000440 - $0.000656 | Optimistic $0.000656 - $0.000919
- AAVE: Conservative $82.54 - $110.05 | Optimistic $110.05 - $141.96
Mid-term Forecast (2028-2029)
- WAM may enter a gradual growth phase, with estimated price range of $0.000532 - $0.001402
- AAVE may enter an expansion phase, with estimated price range of $118.93 - $261.48
- Key drivers: institutional capital inflows, ETF developments, ecosystem expansion
Long-term Forecast (2030-2031)
- WAM: Baseline scenario $0.000919 - $0.001668 | Optimistic scenario $0.001438 - $0.001812
- AAVE: Baseline scenario $173.98 - $280.16 | Optimistic scenario $224.13 - $347.96
Disclaimer
WAM:
| Year | Predicted High Price | Predicted Average Price | Predicted Low Price | Price Change |
|---|---|---|---|---|
| 2026 | 0.00091896 | 0.0006564 | 0.000439788 | 0 |
| 2027 | 0.0011106288 | 0.00078768 | 0.0006065136 | 19 |
| 2028 | 0.001082036016 | 0.0009491544 | 0.000531526464 | 43 |
| 2029 | 0.00140152138704 | 0.001015595208 | 0.00084294402264 | 54 |
| 2030 | 0.001667810450577 | 0.00120855829752 | 0.000918504306115 | 83 |
| 2031 | 0.001812112311301 | 0.001438184374048 | 0.000934819843131 | 118 |
AAVE:
| Year | Predicted High Price | Predicted Average Price | Predicted Low Price | Price Change |
|---|---|---|---|---|
| 2026 | 141.9645 | 110.05 | 82.5375 | 0 |
| 2027 | 178.930295 | 126.00725 | 95.76551 | 14 |
| 2028 | 221.079720125 | 152.4687725 | 118.92564255 | 38 |
| 2029 | 261.4839448375 | 186.7742463125 | 164.361336755 | 69 |
| 2030 | 280.16136946875 | 224.129095575 | 186.02714932725 | 103 |
| 2031 | 347.9604208801875 | 252.145232521875 | 173.98021044009375 | 129 |
IV. Investment Strategy Comparison: WAM vs AAVE
Long-term vs Short-term Investment Strategies
-
WAM: May suit investors seeking higher-risk, speculative positions in gaming-related crypto assets with smaller market capitalization. The token's historical volatility and lower liquidity characteristics suggest alignment with investors prepared for substantial price fluctuations and extended holding periods.
-
AAVE: May suit investors focused on DeFi infrastructure with established protocol adoption and institutional participation. The token's governance utility and staking mechanisms align with strategies emphasizing yield generation and participation in decentralized finance governance.
Risk Management and Asset Allocation
-
Conservative investors: WAM 5-10% vs AAVE 15-25%
- Conservative allocation strategies typically emphasize established protocols with demonstrated market resilience and operational track records.
-
Aggressive investors: WAM 15-25% vs AAVE 30-40%
- Higher allocation percentages reflect risk tolerance levels suited for investors seeking growth potential through established DeFi platforms or speculative gaming tokens.
-
Hedging instruments: stablecoin allocations, options strategies, cross-asset portfolio combinations
- Diversification approaches include maintaining stablecoin reserves, utilizing derivatives instruments where available, and constructing portfolios spanning multiple crypto asset categories to manage concentration risk.
V. Potential Risk Comparison
Market Risk
-
WAM: Lower trading volume ($25,608.38 as of February 6, 2026) indicates limited liquidity, which may result in wider bid-ask spreads and increased price volatility during market stress periods. The gaming token sector experiences cyclical demand patterns influenced by user engagement trends.
-
AAVE: Higher trading volume ($20,865,755.85 as of February 6, 2026) provides greater liquidity, though the token remains subject to broader DeFi sector volatility. Protocol utilization correlates with crypto market cycles, affecting Total Value Locked and consequently governance token demand.
Technical Risk
-
WAM: Gaming platform scalability and user retention represent operational dependencies. Network stability and platform development roadmap execution influence long-term viability.
-
AAVE: Smart contract security constitutes ongoing operational consideration for lending protocols. The platform's multi-chain deployment strategy introduces cross-chain technical complexity. Flash loan mechanisms, while innovative, require continuous security monitoring to prevent exploitation attempts.
Regulatory Risk
- Global regulatory frameworks impact both assets differently based on their functional classifications. Gaming tokens face varying jurisdictional interpretations regarding their classification, while DeFi lending protocols encounter regulatory considerations related to financial service provision, securities law applicability, and cross-border transaction compliance requirements. Enhanced regulatory clarity may provide operational certainty, though specific regulatory developments remain jurisdiction-dependent.
VI. Conclusion: Which Is the Better Buy?
📌 Investment Value Summary:
-
WAM advantages: Lower entry price point enables positional flexibility for speculative allocations. Gaming sector participation provides exposure to play-to-earn model developments within crypto gaming ecosystems.
-
AAVE advantages: Established DeFi infrastructure position with demonstrated protocol adoption metrics. Governance and staking utility provides multiple value accrual mechanisms beyond price appreciation. Multi-chain operational capability expands addressable market scope.
✅ Investment Recommendations:
-
Beginning investors: Consider establishing foundational understanding of DeFi protocols through research into established platforms like AAVE before allocation decisions. Initial positions in protocols with higher liquidity and operational track records may provide learning opportunities with relatively lower execution risk.
-
Experienced investors: Portfolio construction incorporating both established DeFi infrastructure (AAVE) and selective speculative positions (WAM) enables diversified exposure across crypto market segments. Risk-adjusted allocation percentages should reflect individual risk tolerance and market outlook assumptions.
-
Institutional investors: Focus on protocols demonstrating institutional adoption patterns, regulatory engagement, and operational transparency. AAVE's positioning within DeFi infrastructure and cross-chain capabilities may align with institutional criteria emphasizing governance participation and yield generation mechanisms.
⚠️ Risk Disclosure: Cryptocurrency markets exhibit extreme volatility characteristics. This content does not constitute investment advice. Market conditions, regulatory developments, and protocol-specific factors influence asset valuations. Investors should conduct independent research and consider consultation with qualified financial advisors before making investment decisions.
VII. FAQ
Q1: What are the main differences between WAM and AAVE in terms of market positioning?
WAM and AAVE represent fundamentally different crypto asset categories. WAM operates as a play-to-earn gaming platform token with a current price of $0.0006593 and relatively low trading volume ($25,608.38), positioning it within the gaming/entertainment sector of crypto assets. AAVE functions as a governance token for a decentralized lending protocol with a current price of $110.05 and substantially higher trading volume ($20,865,755.85), establishing it as core DeFi infrastructure. The key distinction lies in their utility models: WAM enables participation in gaming tournaments and rewards, while AAVE provides governance rights, staking opportunities, and participation in a decentralized financial services protocol with cross-chain lending capabilities.
Q2: Which asset demonstrates better historical price resilience from all-time highs?
AAVE has shown relatively better price recovery from its all-time high compared to WAM in percentage terms. AAVE declined from its May 2021 peak of $661.69 to $110.05 (as of February 6, 2026), representing approximately an 83% correction. WAM dropped from its December 2021 high of $0.194038 to $0.0006593, reflecting approximately a 99.7% decline from peak levels. While both assets experienced substantial corrections during the 2021-2026 market cycle, AAVE's established position within DeFi infrastructure and higher liquidity profile contributed to its comparatively stronger price retention. However, past performance does not guarantee future results, and both assets remain subject to crypto market volatility.
Q3: What role does supply mechanism play in the investment thesis for each token?
AAVE's supply mechanism incorporates governance and staking functionality that can create deflationary pressure on circulating supply. Token holders can stake AAVE in the Safety Module to earn rewards while providing risk coverage for the protocol, effectively reducing available circulation during periods of increased staking participation. This mechanism correlates with Total Value Locked (TVL) growth, as higher protocol utilization typically increases governance participation and yield-seeking behavior. WAM's supply dynamics were not extensively detailed in reference materials, though gaming tokens typically experience demand fluctuations based on user engagement and platform activity levels. The structural difference suggests AAVE's tokenomics provide multiple value accrual pathways through governance, staking rewards, and protocol fee capture, while WAM's value proposition centers primarily on gaming platform participation and reward distribution.
Q4: How do institutional adoption patterns differ between WAM and AAVE?
AAVE has established significant institutional recognition as core DeFi infrastructure, attracting participants seeking yield opportunities and decentralized lending services within the crypto ecosystem. The protocol's multi-chain deployment strategy enables institutional use cases in liquidity management and collateralized borrowing across various blockchain networks. WAM, as a gaming platform token, operates within the play-to-earn gaming sector, which primarily attracts retail participants rather than institutional capital allocators. The institutional adoption disparity reflects fundamental differences in asset classification: AAVE functions as financial infrastructure suitable for treasury management and yield generation, while WAM represents entertainment/gaming sector exposure with limited institutional utility. This distinction significantly influences liquidity profiles, with AAVE's institutional participation contributing to its substantially higher daily trading volume.
Q5: What are the primary technical risks associated with each protocol?
AAVE's primary technical risks center on smart contract security considerations inherent to DeFi lending protocols. The platform's flash loan mechanism, while innovative, requires continuous security monitoring to prevent exploitation attempts. Multi-chain deployment introduces cross-chain technical complexity and potential vulnerabilities across different blockchain environments. Protocol upgrades and governance changes carry execution risk that could impact platform functionality. WAM faces gaming platform-specific technical risks including scalability challenges, user retention dependencies, and network stability requirements. Gaming platforms require consistent technical performance to maintain user engagement, and development roadmap execution directly influences platform viability. Both assets face broader blockchain infrastructure risks including network congestion, consensus mechanism vulnerabilities, and potential security breaches, though AAVE's position as financial infrastructure subjects it to higher scrutiny regarding operational security standards.
Q6: How should investors approach portfolio allocation between WAM and AAVE based on risk tolerance?
Portfolio allocation should reflect individual risk tolerance profiles and investment objectives. Conservative investors may consider 5-10% allocation to WAM (if pursuing gaming sector exposure) versus 15-25% to AAVE, emphasizing established protocols with demonstrated market resilience. Aggressive investors seeking higher growth potential might allocate 15-25% to WAM and 30-40% to AAVE, accepting increased volatility in exchange for potential appreciation. AAVE's higher liquidity, institutional participation, and established DeFi infrastructure position suggest suitability for larger portfolio allocations within crypto-focused strategies. WAM's speculative nature, lower liquidity, and gaming sector dependencies indicate appropriateness for smaller, risk-tolerant allocations. Diversification principles recommend maintaining stablecoin reserves, considering derivatives instruments where available, and constructing portfolios spanning multiple crypto asset categories to manage concentration risk. All allocation decisions should incorporate individual financial circumstances and risk capacity assessments.
Q7: What macroeconomic factors most significantly impact these assets differently?
Interest rate environments and broader cryptocurrency market cycles influence AAVE and WAM through distinct transmission mechanisms. AAVE, as a DeFi lending protocol, experiences direct demand correlation with yield-seeking behavior during varying interest rate regimes. Low traditional finance rates may drive capital toward DeFi yield opportunities, increasing protocol TVL and governance token demand. Conversely, rising rates may redirect capital toward traditional instruments. Inflationary environments affect both assets differently: AAVE provides yield-generating mechanisms that may attract inflation-hedging capital flows, while WAM's gaming platform utility shows less direct correlation with inflation metrics. Geopolitical developments impact cross-border transaction demand, potentially benefiting decentralized finance adoption patterns that favor AAVE. Gaming token demand patterns like WAM demonstrate greater sensitivity to discretionary spending trends and entertainment sector dynamics rather than macroeconomic policy variables, creating fundamentally different exposure profiles within crypto market cycles.
Q8: What price forecast scenarios exist for 2026-2031, and what assumptions underpin them?
Price forecasts for 2026-2031 reflect varying scenario assumptions regarding market adoption, regulatory developments, and ecosystem expansion. For WAM, conservative 2026 projections estimate $0.000440-$0.000656, while optimistic scenarios project $0.000656-$0.000919, extending to long-term baseline scenarios of $0.000919-$0.001668 by 2030-2031. AAVE conservative 2026 estimates range $82.54-$110.05, with optimistic projections reaching $110.05-$141.96, expanding to baseline scenarios of $173.98-$280.16 by 2030-2031. These forecasts assume continued crypto market maturation, potential institutional capital inflows, regulatory clarity developments, and ecosystem expansion. Key assumptions include sustained protocol development, user adoption growth, and absence of catastrophic security breaches or regulatory prohibitions. However, cryptocurrency markets exhibit extreme volatility, and actual outcomes may vary substantially from projections based on unforeseen technological developments, competitive dynamics, or macroeconomic shifts. These forecasts should not constitute sole investment decision criteria.
Share
Content
Introduction: WAM vs AAVE Investment Comparison
I. Historical Price Comparison and Market Status
II. Core Factors Influencing WAM vs AAVE Investment Value
III. 2026-2031 Price Forecast: WAM vs AAVE
IV. Investment Strategy Comparison: WAM vs AAVE
V. Potential Risk Comparison
VI. Conclusion: Which Is the Better Buy?
VII. FAQ
How to Buy Cryptocurrency


Trending Cryptocurrencies


What will be the market capitalization of USDC in 2025? Analysis of the stablecoin market landscape.

How is DeFi different from Bitcoin?

What is DeFi: Understanding Decentralized Finance in 2025
USDC stablecoin 2025 Latest Analysis: Principles, Advantages, and Web3 Eco-Applications
Development of Decentralized Finance Ecosystem in 2025: Integration of Decentralized Finance Applications with Web3
2025 USDT USD Complete Guide: A Must-Read for Newbie Investors
What Is Ripple (XRP)? An Easy-to-Understand Guide to Its Key Features and Future Outlook

What Is an Airdrop? How to Earn Passive Income in Crypto with Airdrops

Comprehensive Guide to Physical Bitcoins

Comprehensive Guide to Coffeezilla: Crypto's Leading Fraud Investigator

Comprehensive Guide to Quantitative Analysis