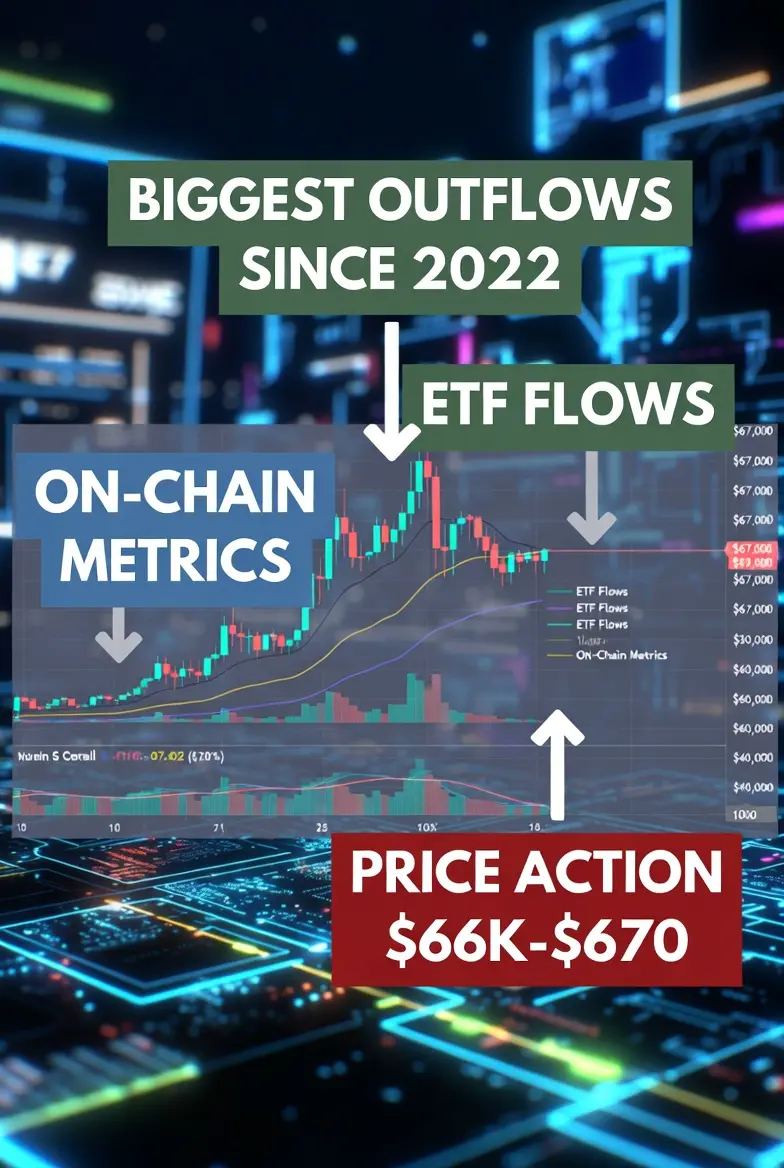
#BiggestCryptoOutflowsSince2022
As of mid-February 2026, the cryptocurrency market is experiencing one of its most intense periods of capital departure since the brutal 2022 bear market. Bitcoin hovers around the $66,000–$67,000 zone after a painful ~50% drop from its late-2025 all-time high near $126,000–$127,000. Ethereum and many altcoins are bleeding similarly, with the total crypto market cap dipping toward $2.3–$2.4 trillion amid "extreme fear" levels on sentiment indexes.
This isn't just another routine correction—it's a broad-based exodus of capital from exchanges, funds, ETFs, and leveraged positions. Here's the complete, extended explanation covering definitions, mechanics, latest numbers, causes, comparisons to history, impacts across the ecosystem, positives amid the pain, risks ahead, and realistic strategies moving forward.
1. The Largest Capital Exodus from Crypto Since 2022 – Core Definition & On-Chain Evidence
At its heart, this trend means the biggest net withdrawal of real money (in USD terms) from the cryptocurrency sector since the 2022 collapse. We're talking about realized capital flows turning sharply negative on a scale not seen in over three years.
Glassnode's Realized Cap Netflow — Analyst data shows the 30-day aggregate realized market value capital flow for major assets (Bitcoin + Ethereum + stablecoins) has plunged into deep negative territory. This is the most extreme monthly decline since the full 2022 bear market. Realized Cap measures the actual USD value at which coins last moved on-chain—positive means fresh money entering and holding; negative signals real selling or withdrawal. After staying strongly positive through most of 2025's bull run, the metric flipped hard in December 2025 and hit historic red levels by early-to-mid February 2026.
ETF & Product Flows as the Main Window — U.S. spot Bitcoin ETFs alone have seen massive redemptions. On February 18, 2026, net outflows hit $133.3 million in a single day (BlackRock's IBIT: -$84.2 million; Fidelity's FBTC: -$49 million). This extends a painful streak: four consecutive weeks of net outflows totaling roughly $3.4–$3.8 billion recently, with cumulative exits since October 2025 highs reaching $8–$8.66 billion across spot Bitcoin products. Broader crypto ETPs (including global funds) recorded another $173 million pulled in one recent week, pushing four-week totals to ~$3.74 billion. Year-to-date 2026 flows have turned net negative in some reports after early weakness.
Scale in Context — While cumulative net inflows since ETF launches remain positive (e.g., ~$53 billion for Bitcoin ETFs overall, down from a $63 billion peak), the recent pace is alarming—averaging ~$90 million per trading day in outflows during the drawdown. This removes a key structural bid that had supported prices in 2024–2025.
2. Why Investors Are Pulling Huge Amounts from Exchanges, Funds, Projects & Leveraged Positions
This isn't random—it's driven by a classic mix of fear, forced selling, macro headwinds, and post-euphoria deleveraging.
Post-Bull Deleveraging & Leverage Unwind — 2025 delivered explosive gains, with Bitcoin reportedly surging well above $100k–$126k. Institutions, hedge funds, retail, and speculators loaded up on leverage (futures OI spiked). The ~50% crash triggered cascading liquidations: over $2.5–$2.67 billion in positions wiped out on peak days in early February, with total liquidations in the correction phase reaching billions. Futures open interest dropped sharply, order books thinned, and forced selling amplified downside.
Macro & Geopolitical Pressures — Risk-off mood dominates: Fed policy uncertainty (hawkish signals, potential higher-for-longer rates), geopolitical nerves, U.S. dollar strength, tech sector outflows (crypto correlates ~0.73 with Nasdaq/tech), and fears of economic slowdown. The Fear & Greed Index sits at multi-year lows (extreme fear around 11 recently). No new FTX-scale bankruptcy has hit, but memories fuel quick panic.
Where the Money Is Actually Leaving
Spot ETFs & Institutional Products — Heavy trimming by hedge funds and institutions rebalancing risk (not full abandonment—long-term inflows still net positive over 1–2 years).
Exchanges & On-Chain — Altcoin inflows to exchanges for selling, stablecoin dominance surging to 12.5% (three-year high) as capital flees to safety (USDC/USDT supply contracted ~$7 billion from peaks).
Projects & Risk Assets — DeFi TVL drops, NFT volumes slow, smaller alts bleed hardest in rotation (sell alts → BTC/stablecoins → fiat/exit). Solana stands out as a rotation beneficiary.
Psychology — Capitulation signals abound (MVRV ratios low, long-term holder accumulation weaker than in past crashes like FTX/LUNA). Many are de-risking portfolios rather than panic-selling everything.
3. Broader Ecosystem Impacts – Funds, Projects, Retail vs Institutions
The pain spreads unevenly:
ETFs & Funds — Bitcoin/ETH/XRP products bleed heavily; Solana ETFs buck the trend with inflows (e.g., +$2.4 million on some days, cumulative ~$880 million). This shows selective rotation inside crypto, not total flight.
DeFi, Layer-2s, NFTs, Altcoins — Reduced liquidity, slower fundraising, higher slippage in thin markets. Riskier projects face survival pressure.
Retail vs Institutions — On-chain suggests long-term holders (diamond hands) mostly hold; outflows driven by short-term traders, leveraged players, and some institutions trimming. University endowments (e.g., Harvard, Brown) appear to hold steady in volatile ETFs. European ETF flows even turned positive recently despite U.S. weakness.
4. Short Summary
Big money is leaving the crypto market in 2026 at the fastest pace since the 2022 bear market—driven by deleveraging after 2025 euphoria, macro fears, liquidations, and institutional risk reduction.
Extended Discussion: 2022 Comparison, Positives, Risks & What Comes Next?
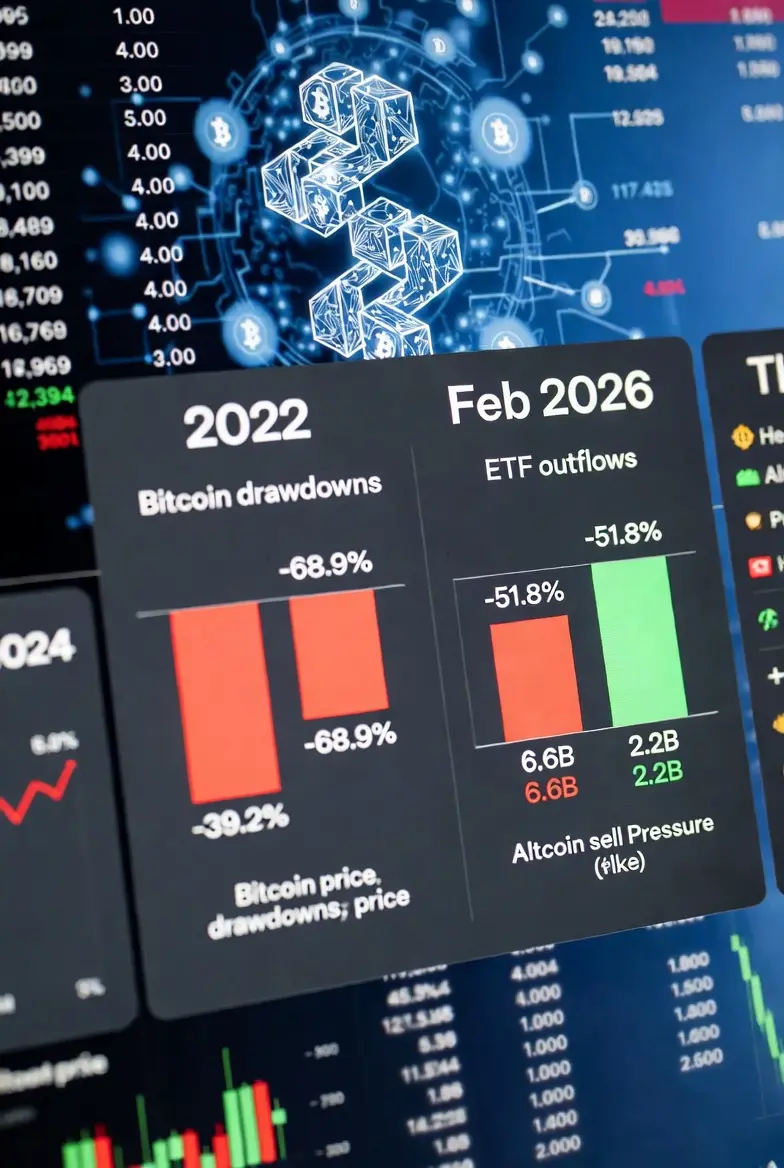
Vs 2022 — 2022 was existential (FTX implosion, Terra/Luna collapse, 3AC bankruptcy, soaring rates → 70–90% losses). 2026 is a deep correction inside a potential longer super-cycle—no systemic failures yet. ETF infrastructure provides transparency and an orderly exit for institutions. Outflows are large but measured.
Silver Linings
Healthy reset: Clears weak hands, over-leverage, hype capital → shifts focus to fundamentals (Bitcoin as digital gold, Ethereum upgrades, Solana utility).
Accumulation setup: Analysts call this "not broken, just adjusting." Long-term ETF inflows remain net positive overall. Solana rotation shows smart money staying selective.
Historical precedent: Crypto survives worse and delivers massive returns post-shakeouts.
Risks Ahead
Macro worsens (recession signals, persistent high rates) → more outflows, BTC testing $60k–$55k supports (Realized Price ~$54.9k as structural floor).
Volatility explosion: Thin liquidity means bigger swings. Continued ETF bleed could accelerate downside.
If no catalyst (Fed pivot, positive policy), range-bound pressure persists ($79k resistance to $55k support per Glassnode).
Outlook & Practical Thoughts
This feels like the classic "shakeout" before the next leg—history favors believers who buy fear. Watch daily ETF flows (stabilizing = bullish), Realized Cap turning less negative, Bitcoin dominance, stablecoin flows reversing, and macro data (Fed minutes, inflation prints). For long-term holders: This can be generational opportunity. Traders: Tight risk management essential. Rotate selectively (e.g., Solana strength) or sit in cash/stablecoins until conviction returns.
As of mid-February 2026, the cryptocurrency market is experiencing one of its most intense periods of capital departure since the brutal 2022 bear market. Bitcoin hovers around the $66,000–$67,000 zone after a painful ~50% drop from its late-2025 all-time high near $126,000–$127,000. Ethereum and many altcoins are bleeding similarly, with the total crypto market cap dipping toward $2.3–$2.4 trillion amid "extreme fear" levels on sentiment indexes.
This isn't just another routine correction—it's a broad-based exodus of capital from exchanges, funds, ETFs, and leveraged positions. Here's the complete, extended explanation covering definitions, mechanics, latest numbers, causes, comparisons to history, impacts across the ecosystem, positives amid the pain, risks ahead, and realistic strategies moving forward.
1. The Largest Capital Exodus from Crypto Since 2022 – Core Definition & On-Chain Evidence
At its heart, this trend means the biggest net withdrawal of real money (in USD terms) from the cryptocurrency sector since the 2022 collapse. We're talking about realized capital flows turning sharply negative on a scale not seen in over three years.
Glassnode's Realized Cap Netflow — Analyst data shows the 30-day aggregate realized market value capital flow for major assets (Bitcoin + Ethereum + stablecoins) has plunged into deep negative territory. This is the most extreme monthly decline since the full 2022 bear market. Realized Cap measures the actual USD value at which coins last moved on-chain—positive means fresh money entering and holding; negative signals real selling or withdrawal. After staying strongly positive through most of 2025's bull run, the metric flipped hard in December 2025 and hit historic red levels by early-to-mid February 2026.
ETF & Product Flows as the Main Window — U.S. spot Bitcoin ETFs alone have seen massive redemptions. On February 18, 2026, net outflows hit $133.3 million in a single day (BlackRock's IBIT: -$84.2 million; Fidelity's FBTC: -$49 million). This extends a painful streak: four consecutive weeks of net outflows totaling roughly $3.4–$3.8 billion recently, with cumulative exits since October 2025 highs reaching $8–$8.66 billion across spot Bitcoin products. Broader crypto ETPs (including global funds) recorded another $173 million pulled in one recent week, pushing four-week totals to ~$3.74 billion. Year-to-date 2026 flows have turned net negative in some reports after early weakness.
Scale in Context — While cumulative net inflows since ETF launches remain positive (e.g., ~$53 billion for Bitcoin ETFs overall, down from a $63 billion peak), the recent pace is alarming—averaging ~$90 million per trading day in outflows during the drawdown. This removes a key structural bid that had supported prices in 2024–2025.
2. Why Investors Are Pulling Huge Amounts from Exchanges, Funds, Projects & Leveraged Positions
This isn't random—it's driven by a classic mix of fear, forced selling, macro headwinds, and post-euphoria deleveraging.
Post-Bull Deleveraging & Leverage Unwind — 2025 delivered explosive gains, with Bitcoin reportedly surging well above $100k–$126k. Institutions, hedge funds, retail, and speculators loaded up on leverage (futures OI spiked). The ~50% crash triggered cascading liquidations: over $2.5–$2.67 billion in positions wiped out on peak days in early February, with total liquidations in the correction phase reaching billions. Futures open interest dropped sharply, order books thinned, and forced selling amplified downside.
Macro & Geopolitical Pressures — Risk-off mood dominates: Fed policy uncertainty (hawkish signals, potential higher-for-longer rates), geopolitical nerves, U.S. dollar strength, tech sector outflows (crypto correlates ~0.73 with Nasdaq/tech), and fears of economic slowdown. The Fear & Greed Index sits at multi-year lows (extreme fear around 11 recently). No new FTX-scale bankruptcy has hit, but memories fuel quick panic.
Where the Money Is Actually Leaving
Spot ETFs & Institutional Products — Heavy trimming by hedge funds and institutions rebalancing risk (not full abandonment—long-term inflows still net positive over 1–2 years).
Exchanges & On-Chain — Altcoin inflows to exchanges for selling, stablecoin dominance surging to 12.5% (three-year high) as capital flees to safety (USDC/USDT supply contracted ~$7 billion from peaks).
Projects & Risk Assets — DeFi TVL drops, NFT volumes slow, smaller alts bleed hardest in rotation (sell alts → BTC/stablecoins → fiat/exit). Solana stands out as a rotation beneficiary.
Psychology — Capitulation signals abound (MVRV ratios low, long-term holder accumulation weaker than in past crashes like FTX/LUNA). Many are de-risking portfolios rather than panic-selling everything.
3. Broader Ecosystem Impacts – Funds, Projects, Retail vs Institutions
The pain spreads unevenly:
ETFs & Funds — Bitcoin/ETH/XRP products bleed heavily; Solana ETFs buck the trend with inflows (e.g., +$2.4 million on some days, cumulative ~$880 million). This shows selective rotation inside crypto, not total flight.
DeFi, Layer-2s, NFTs, Altcoins — Reduced liquidity, slower fundraising, higher slippage in thin markets. Riskier projects face survival pressure.
Retail vs Institutions — On-chain suggests long-term holders (diamond hands) mostly hold; outflows driven by short-term traders, leveraged players, and some institutions trimming. University endowments (e.g., Harvard, Brown) appear to hold steady in volatile ETFs. European ETF flows even turned positive recently despite U.S. weakness.
4. Short Summary
Big money is leaving the crypto market in 2026 at the fastest pace since the 2022 bear market—driven by deleveraging after 2025 euphoria, macro fears, liquidations, and institutional risk reduction.
Extended Discussion: 2022 Comparison, Positives, Risks & What Comes Next?
Vs 2022 — 2022 was existential (FTX implosion, Terra/Luna collapse, 3AC bankruptcy, soaring rates → 70–90% losses). 2026 is a deep correction inside a potential longer super-cycle—no systemic failures yet. ETF infrastructure provides transparency and an orderly exit for institutions. Outflows are large but measured.
Silver Linings
Healthy reset: Clears weak hands, over-leverage, hype capital → shifts focus to fundamentals (Bitcoin as digital gold, Ethereum upgrades, Solana utility).
Accumulation setup: Analysts call this "not broken, just adjusting." Long-term ETF inflows remain net positive overall. Solana rotation shows smart money staying selective.
Historical precedent: Crypto survives worse and delivers massive returns post-shakeouts.
Risks Ahead
Macro worsens (recession signals, persistent high rates) → more outflows, BTC testing $60k–$55k supports (Realized Price ~$54.9k as structural floor).
Volatility explosion: Thin liquidity means bigger swings. Continued ETF bleed could accelerate downside.
If no catalyst (Fed pivot, positive policy), range-bound pressure persists ($79k resistance to $55k support per Glassnode).
Outlook & Practical Thoughts
This feels like the classic "shakeout" before the next leg—history favors believers who buy fear. Watch daily ETF flows (stabilizing = bullish), Realized Cap turning less negative, Bitcoin dominance, stablecoin flows reversing, and macro data (Fed minutes, inflation prints). For long-term holders: This can be generational opportunity. Traders: Tight risk management essential. Rotate selectively (e.g., Solana strength) or sit in cash/stablecoins until conviction returns.