4.2 Bitcoin and Ethereum early morning short positions!
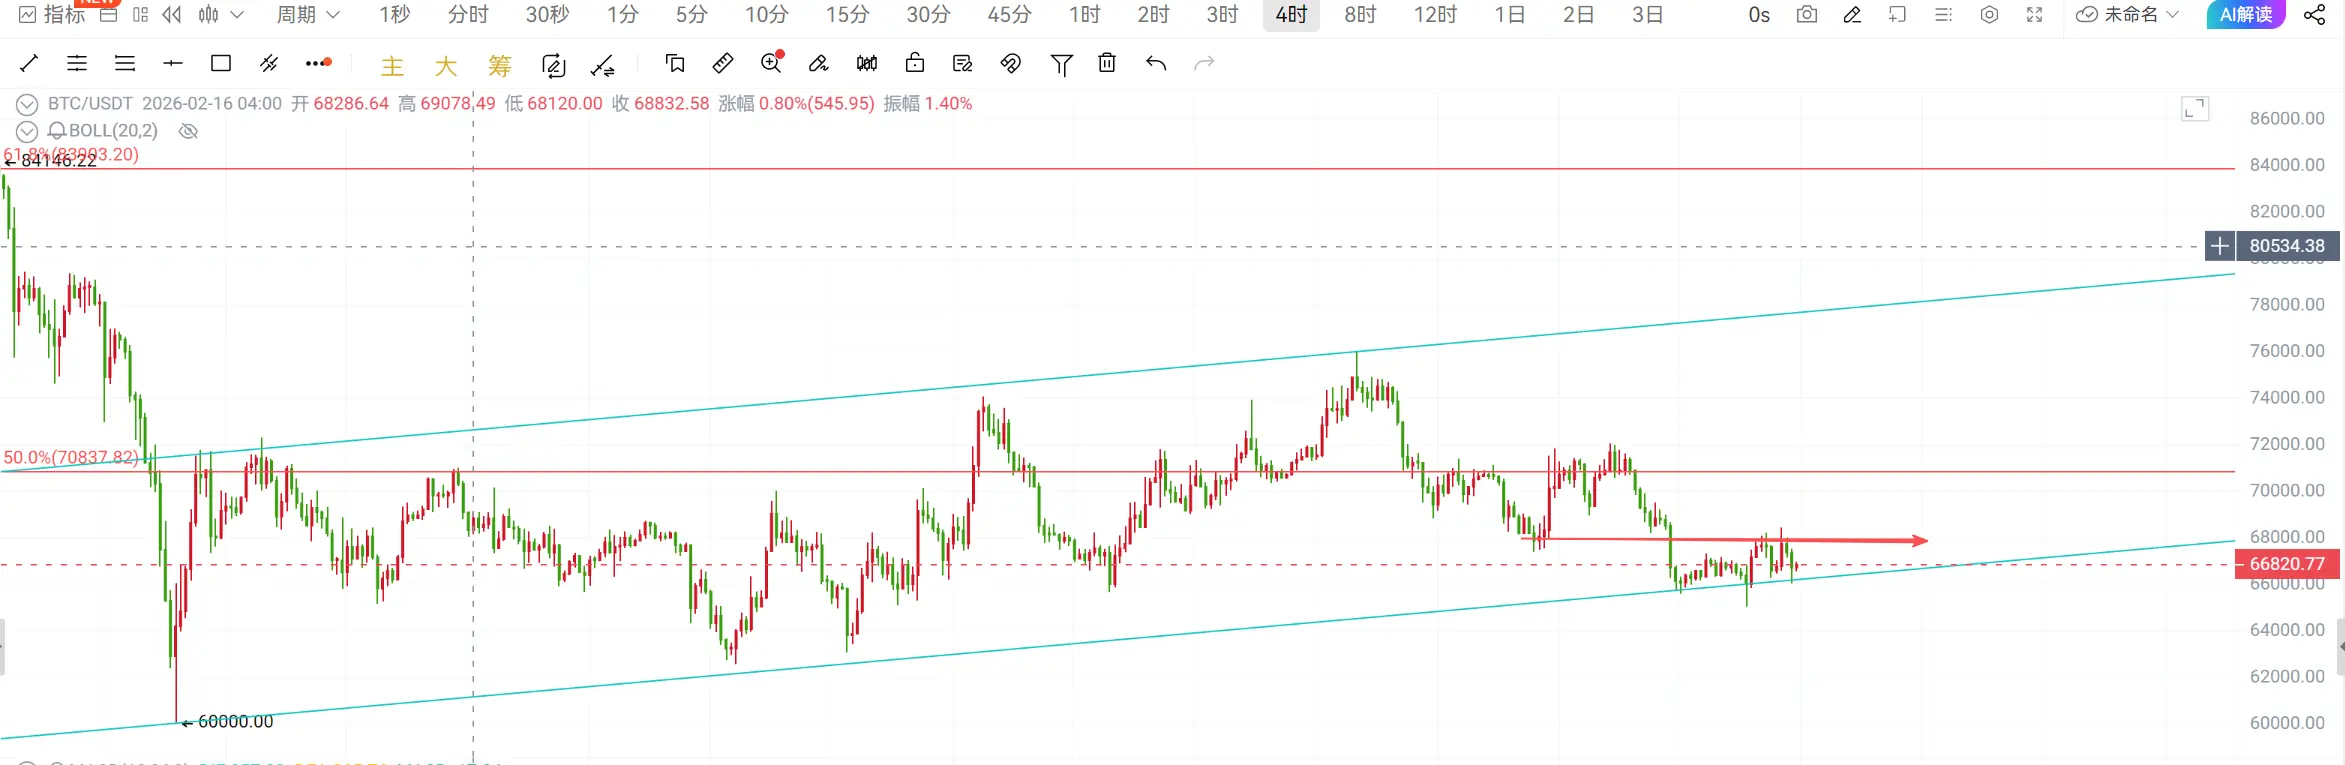
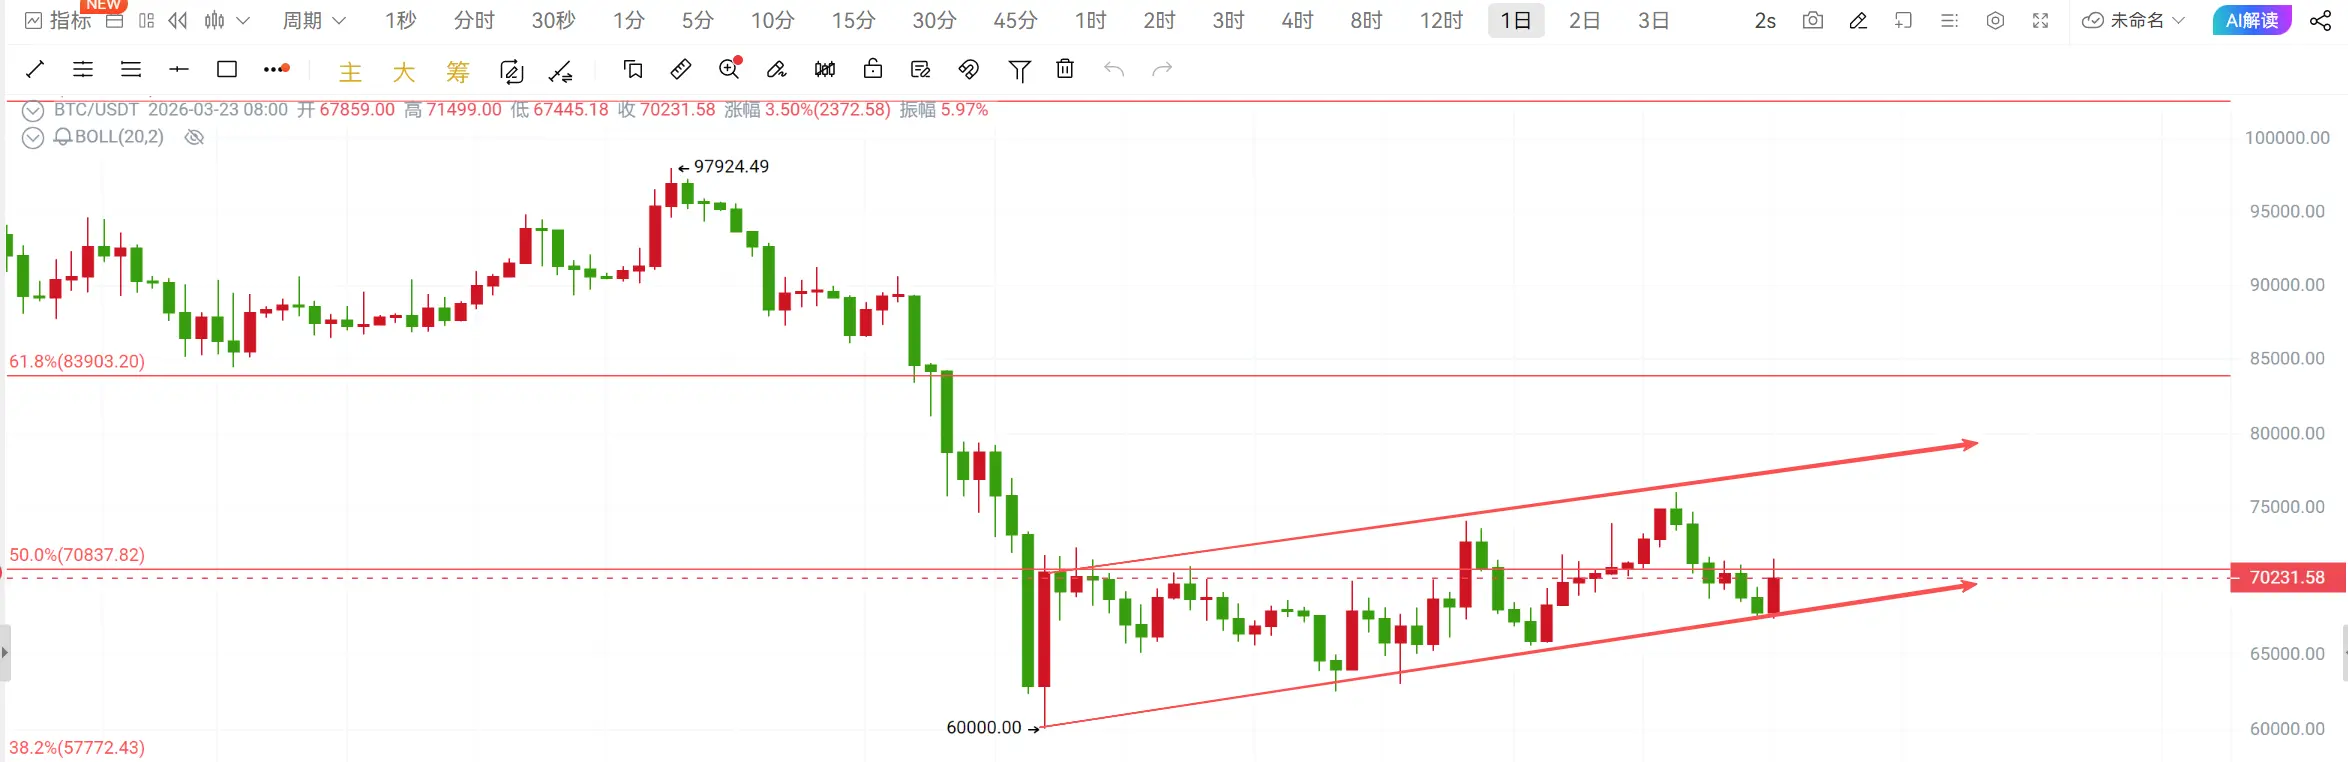
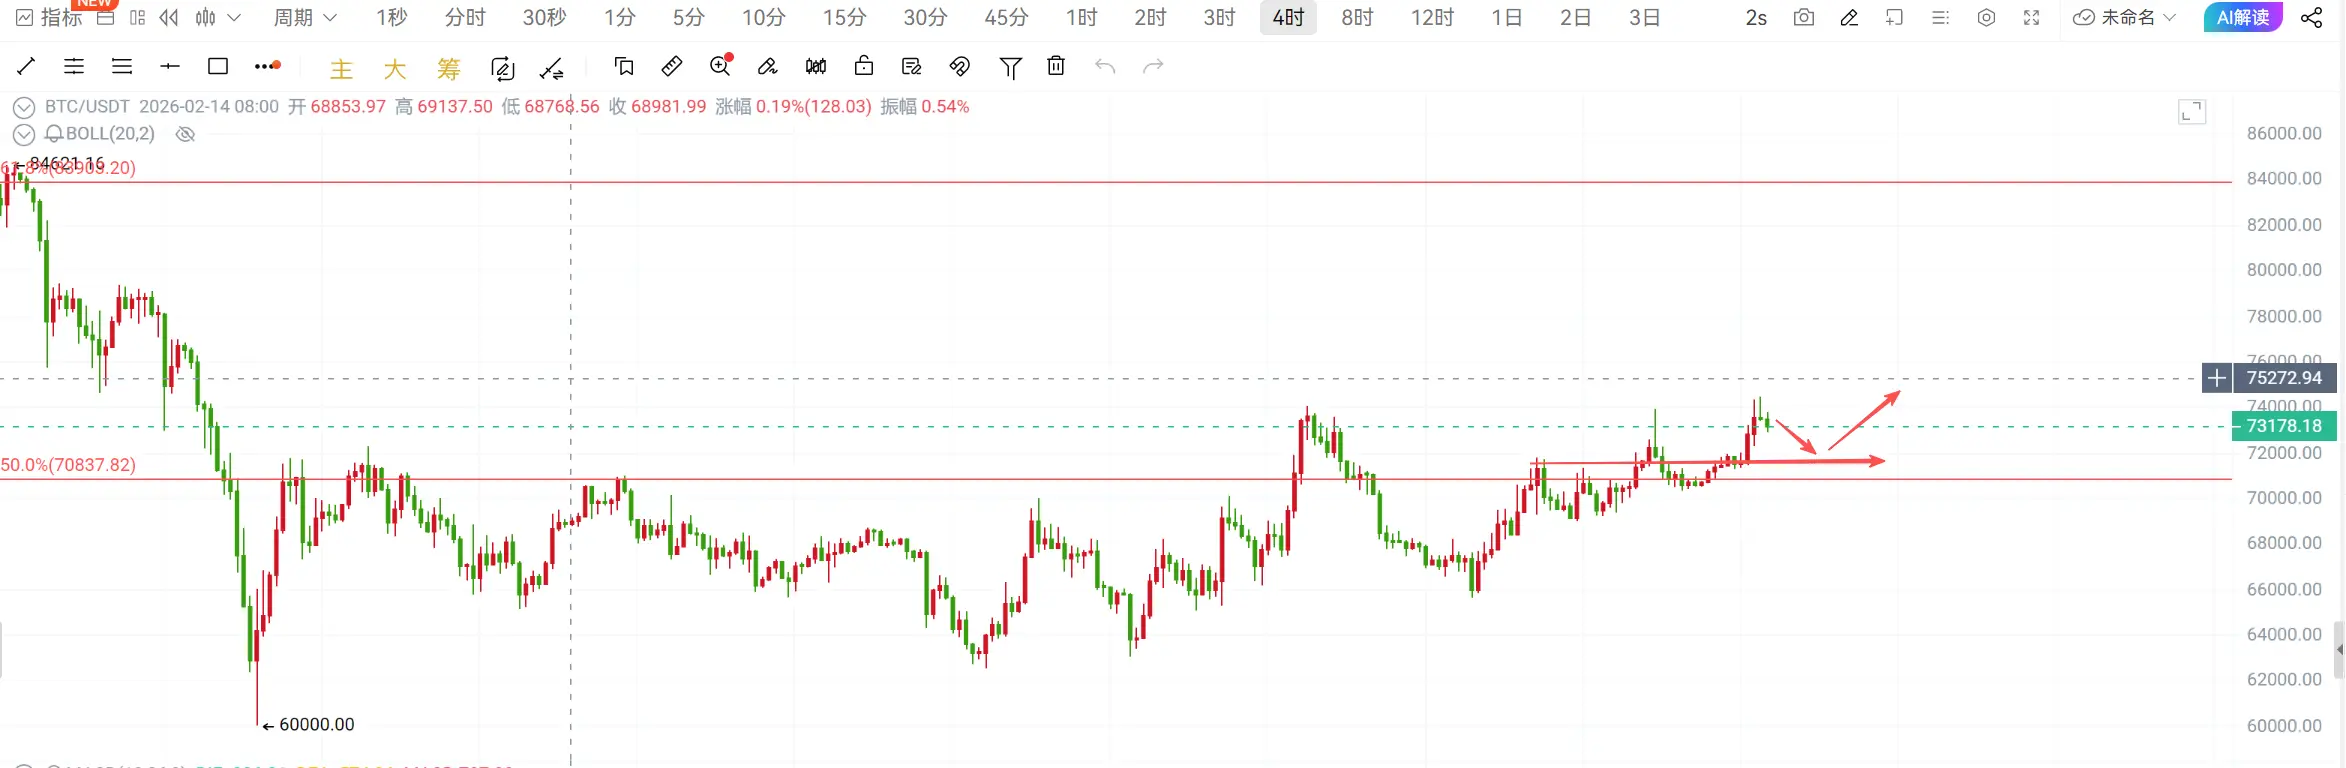
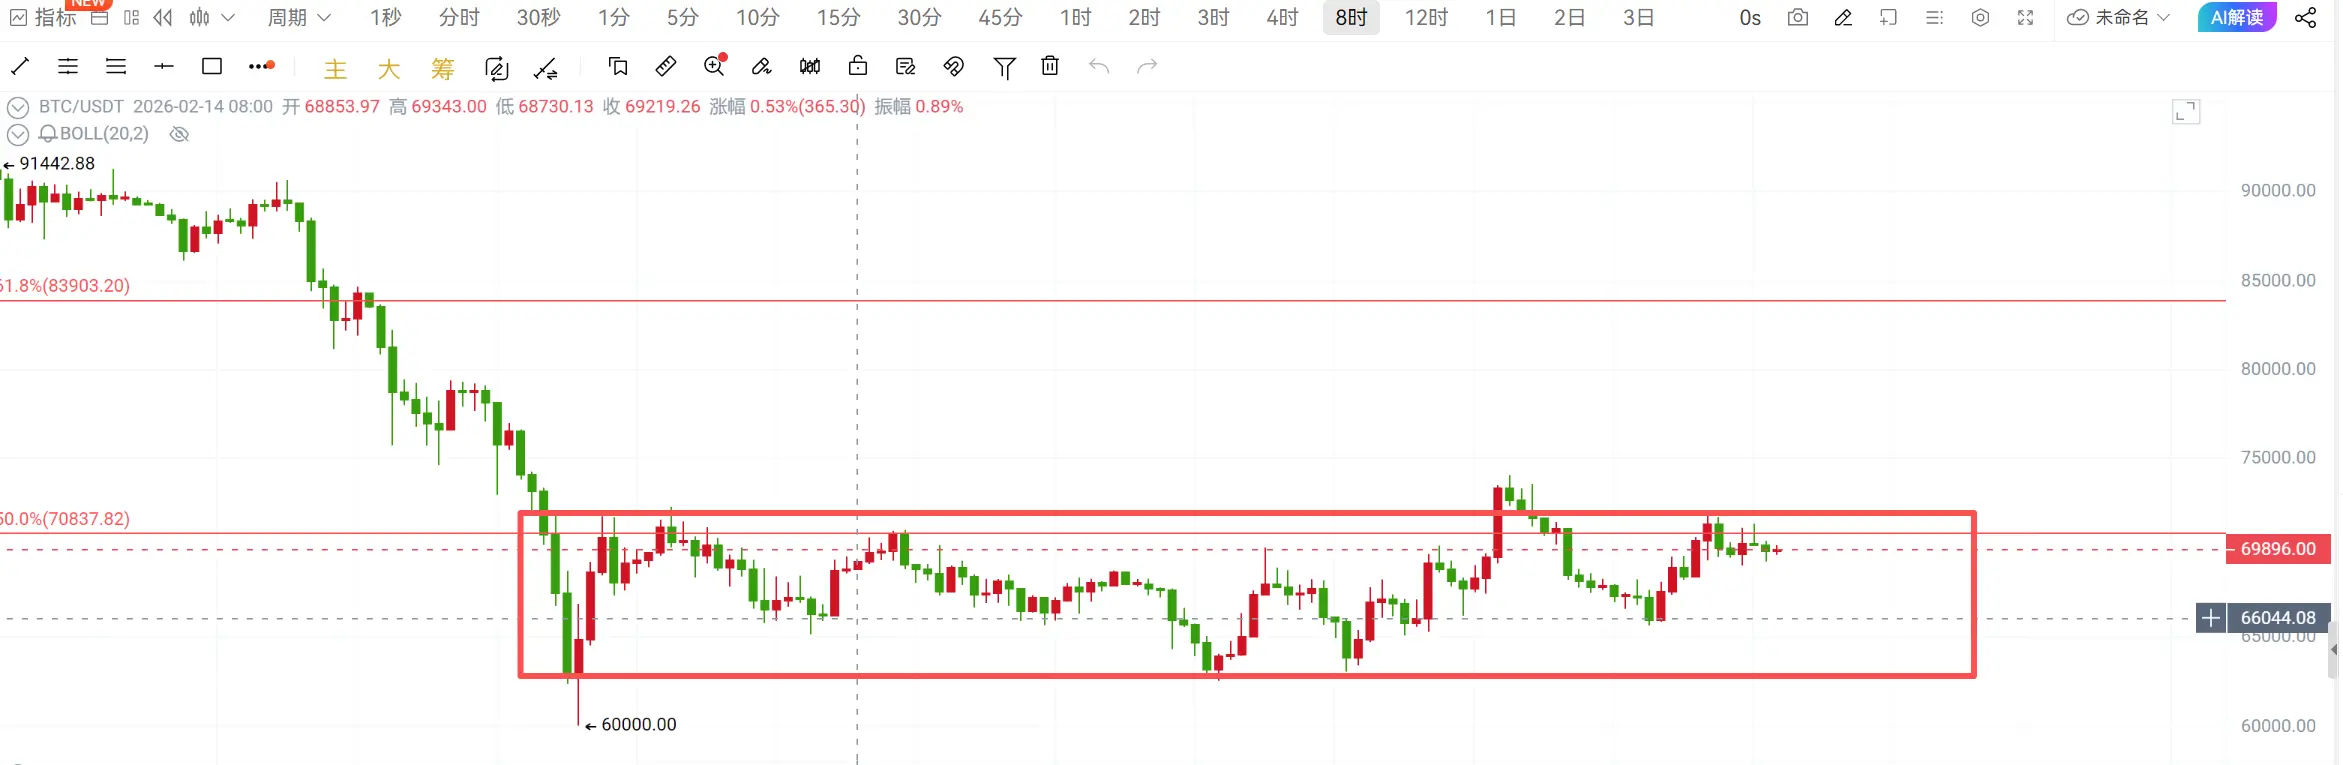
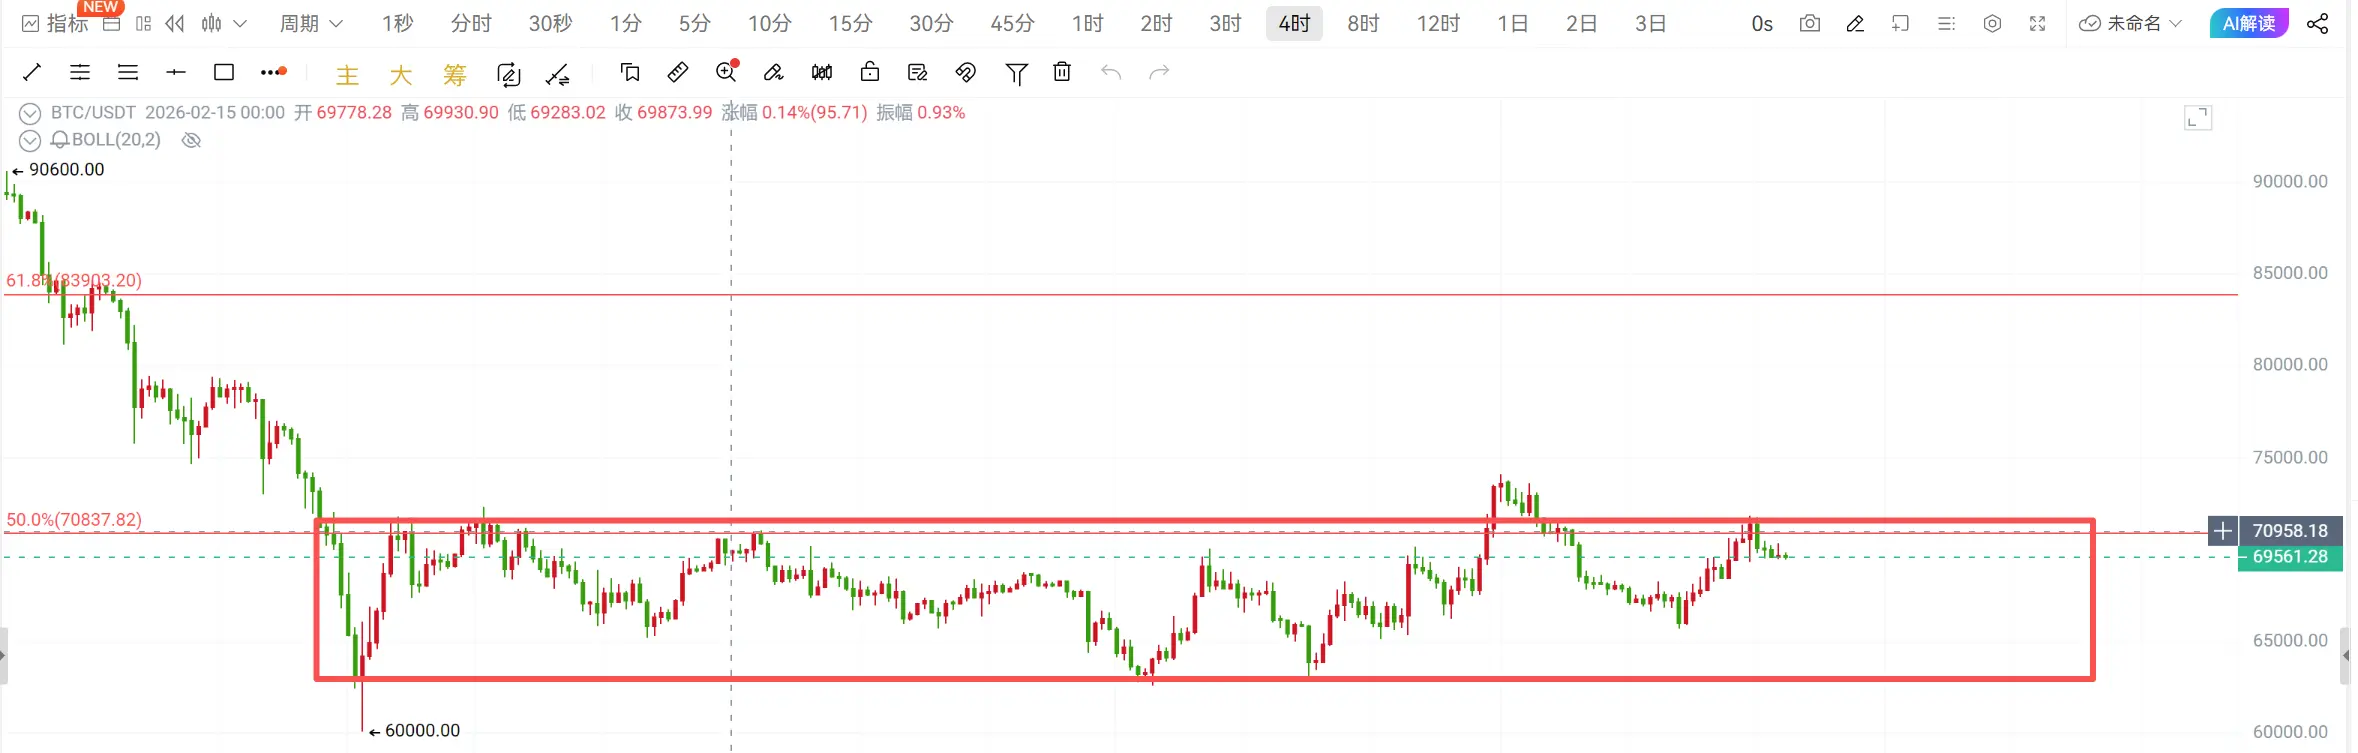
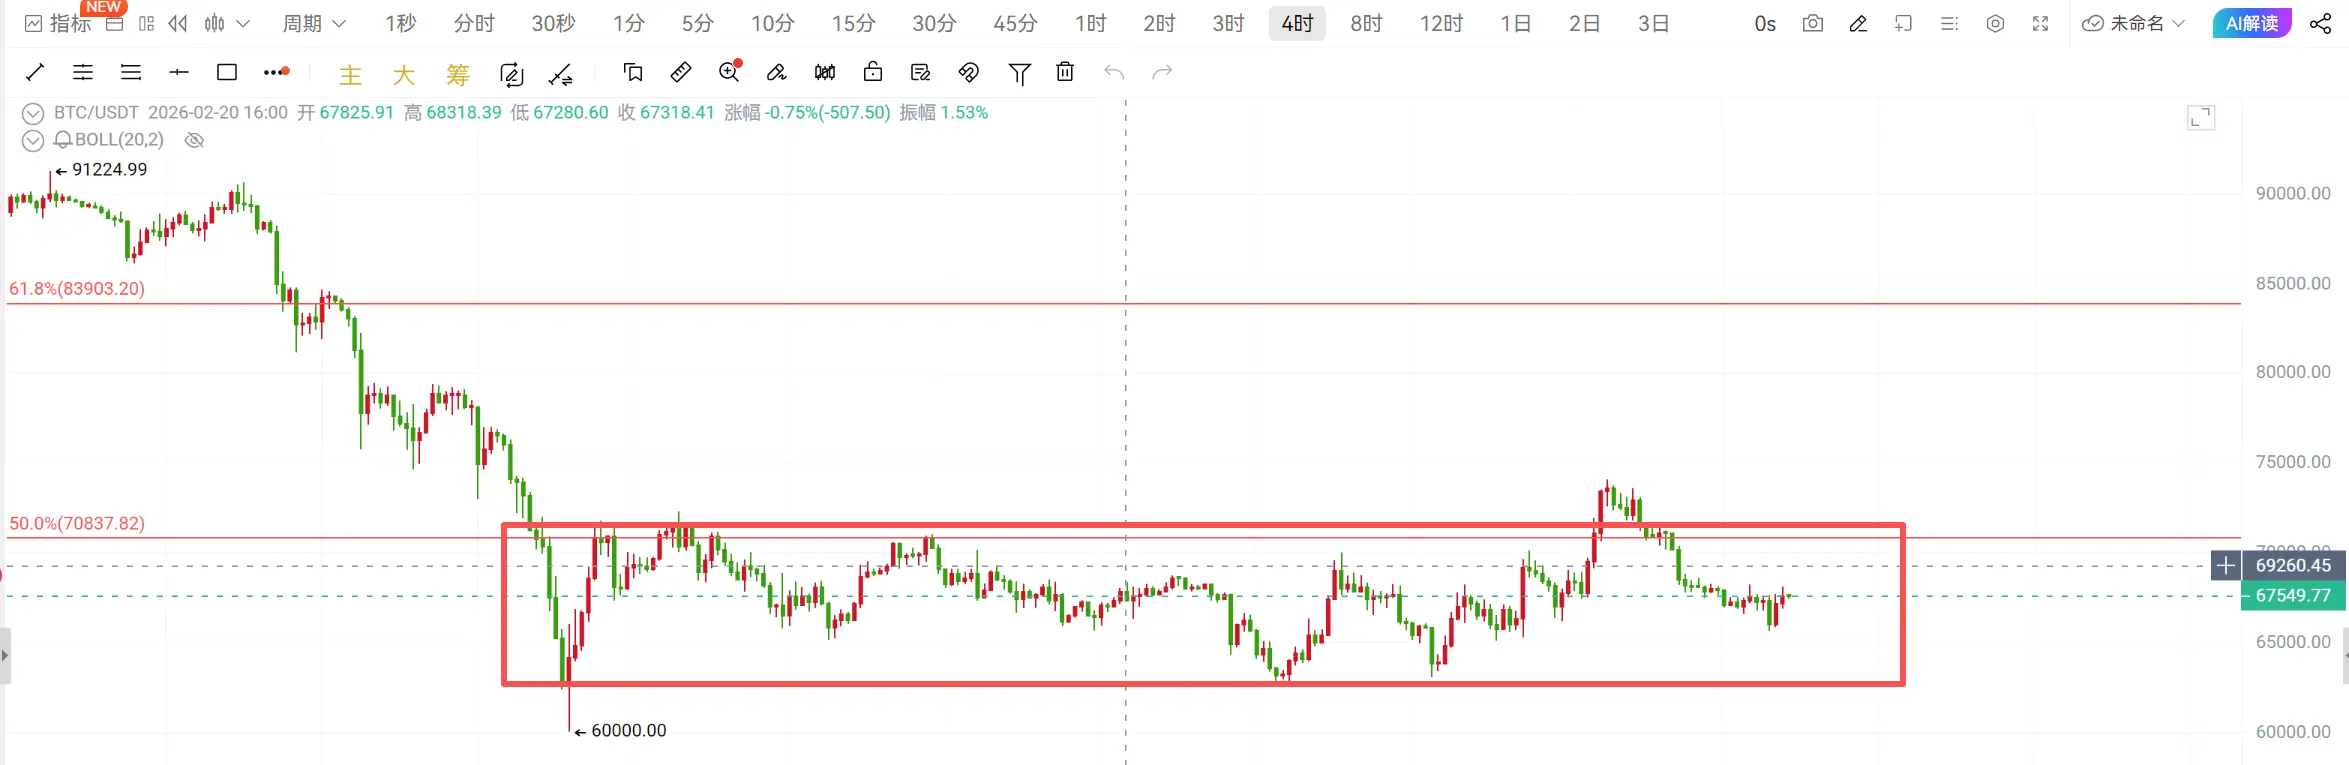
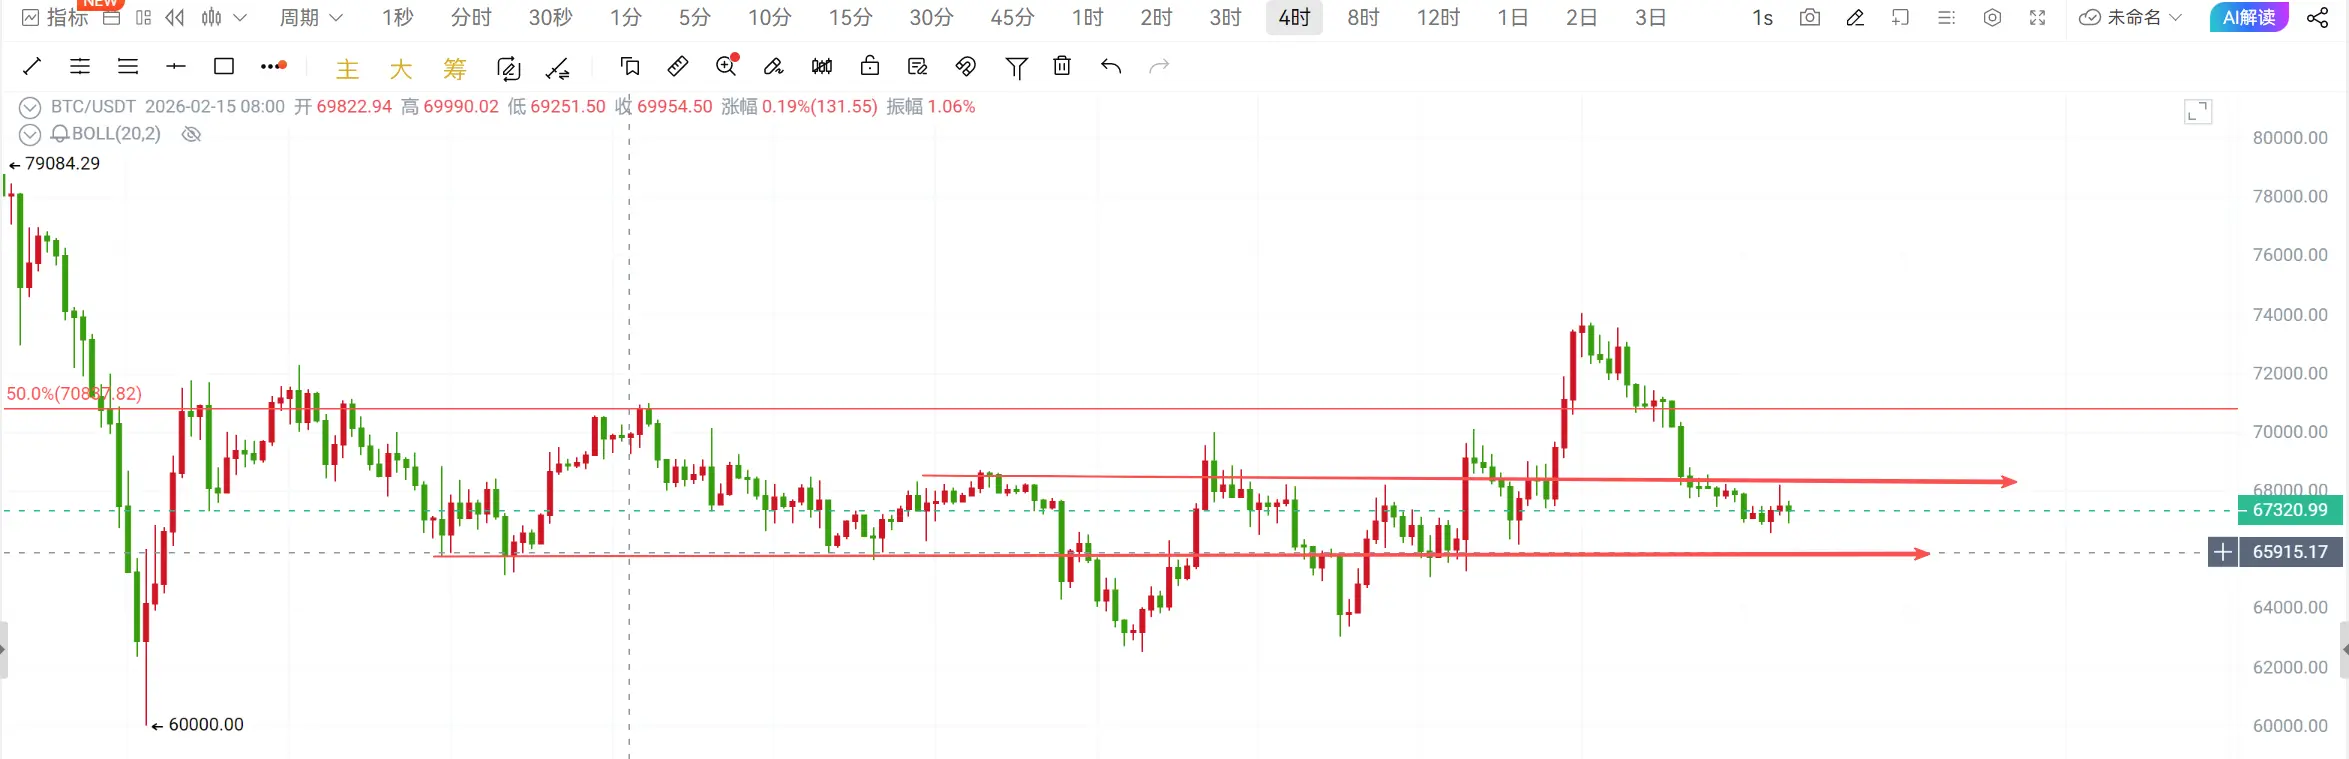
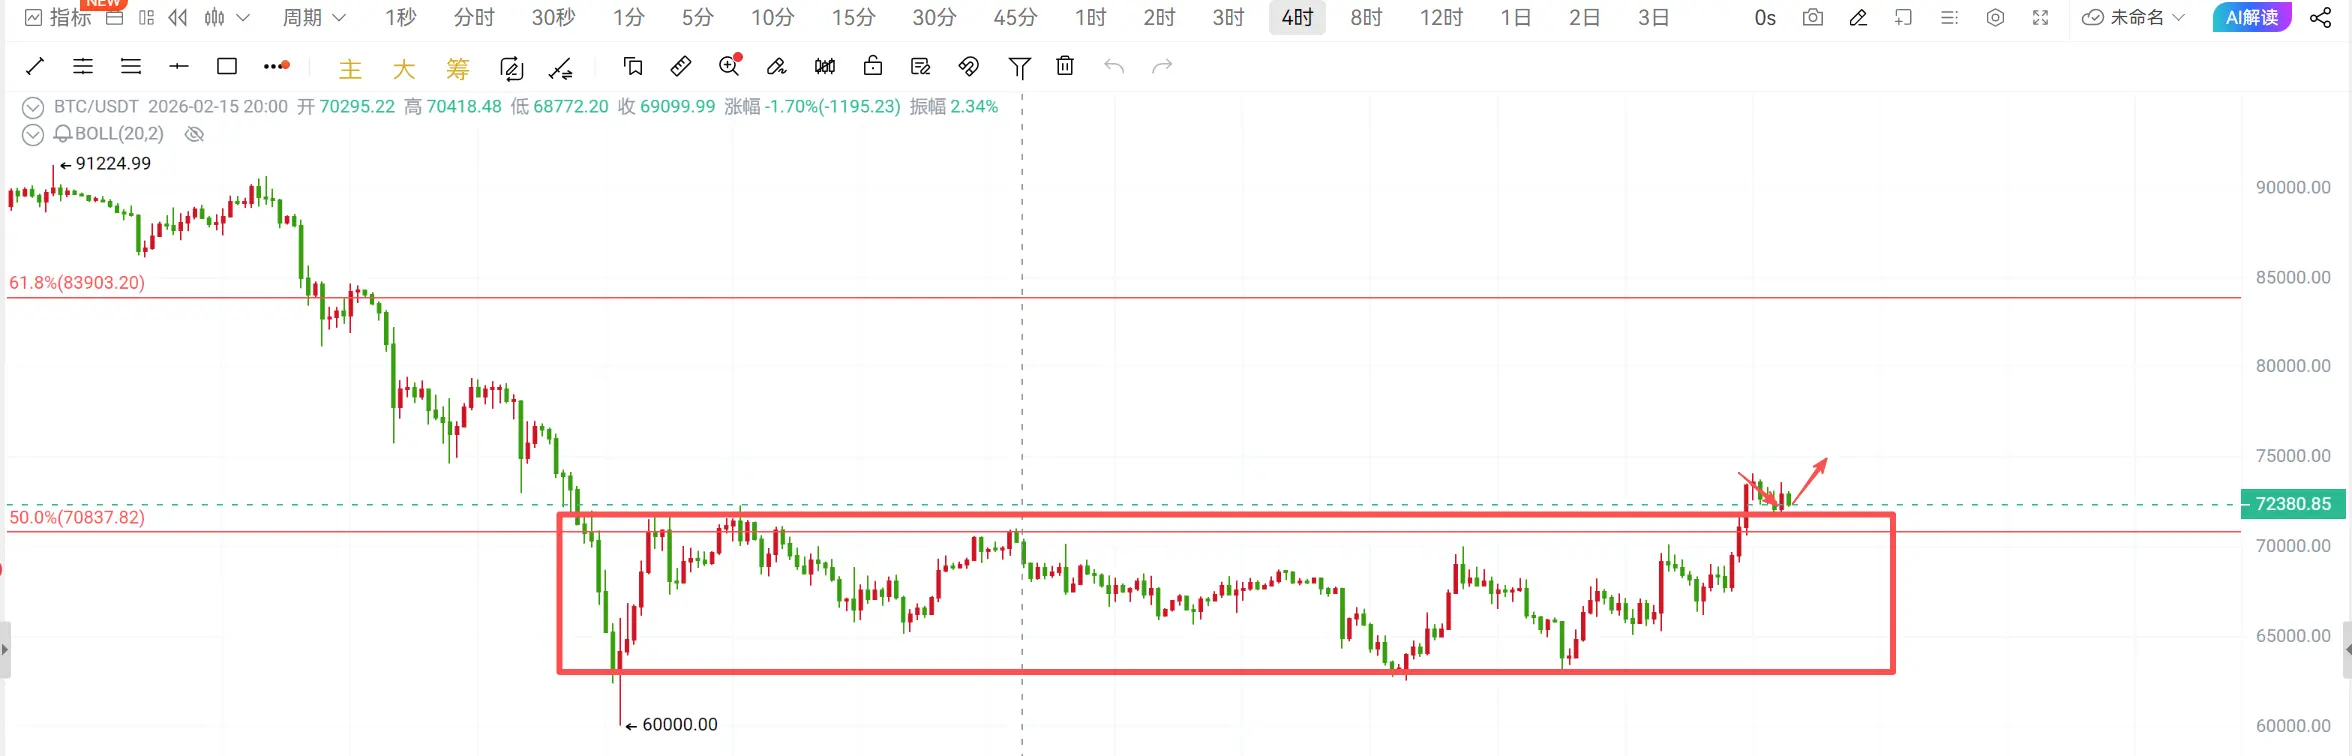
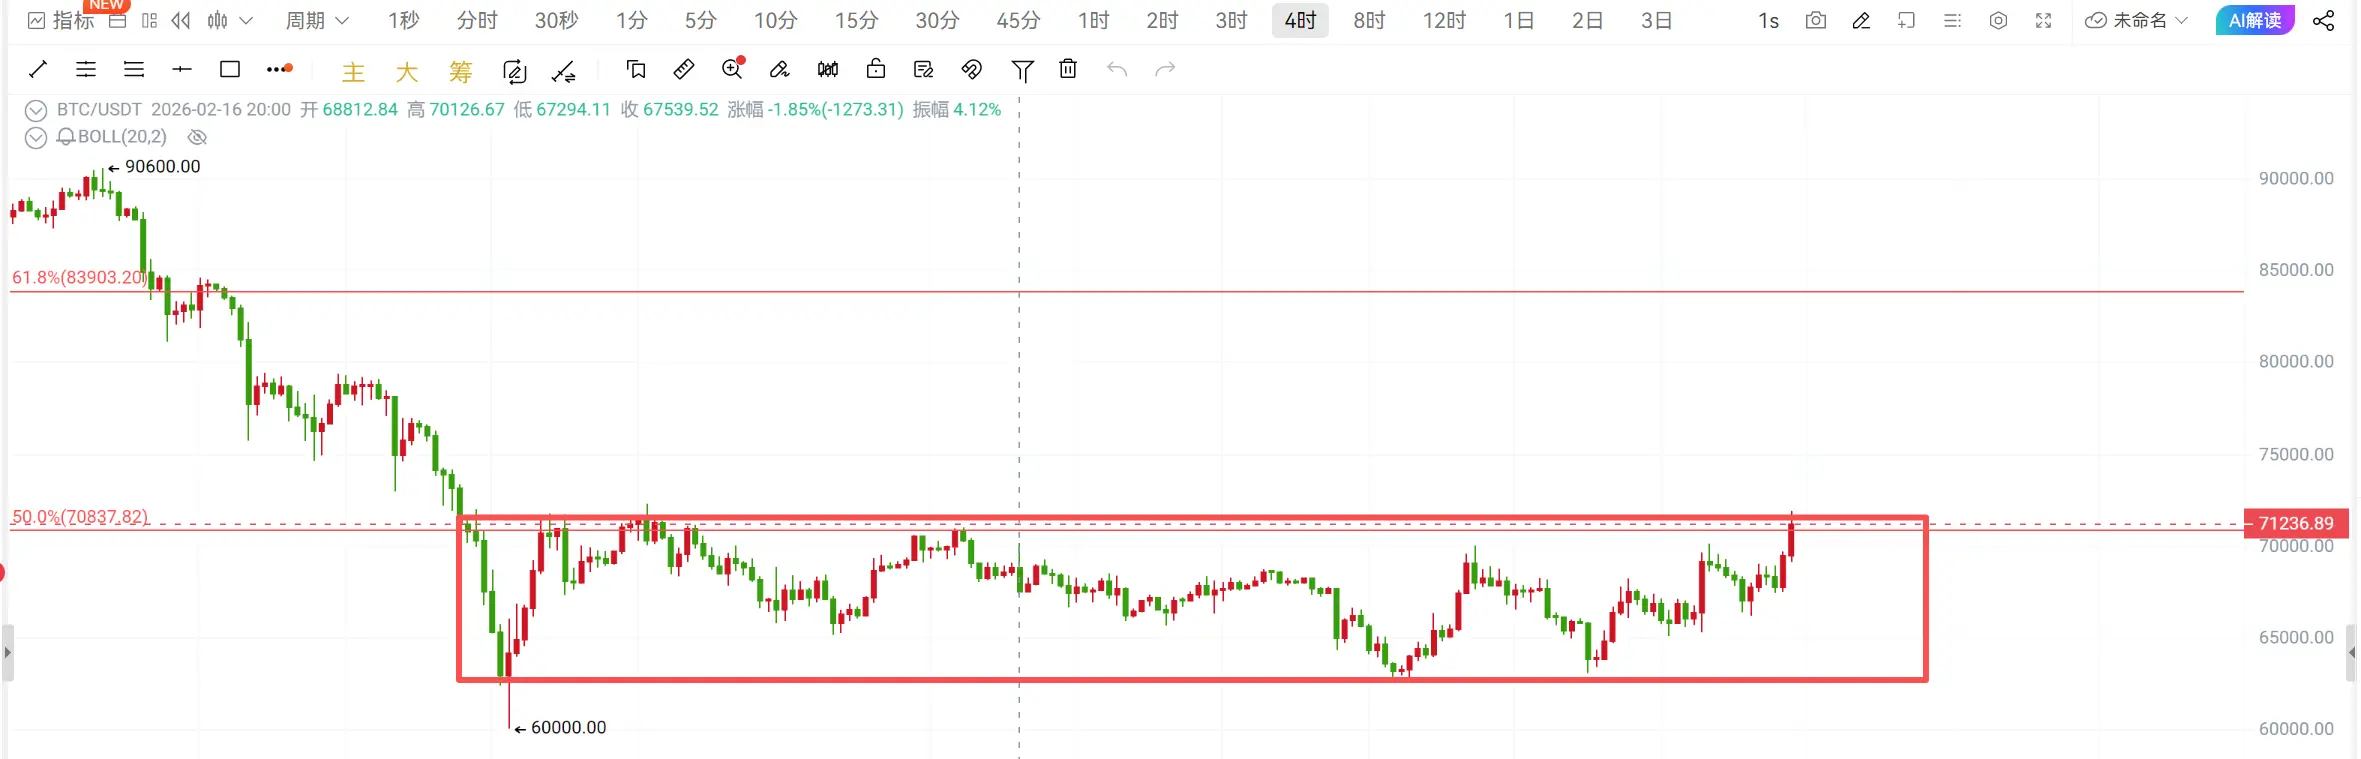
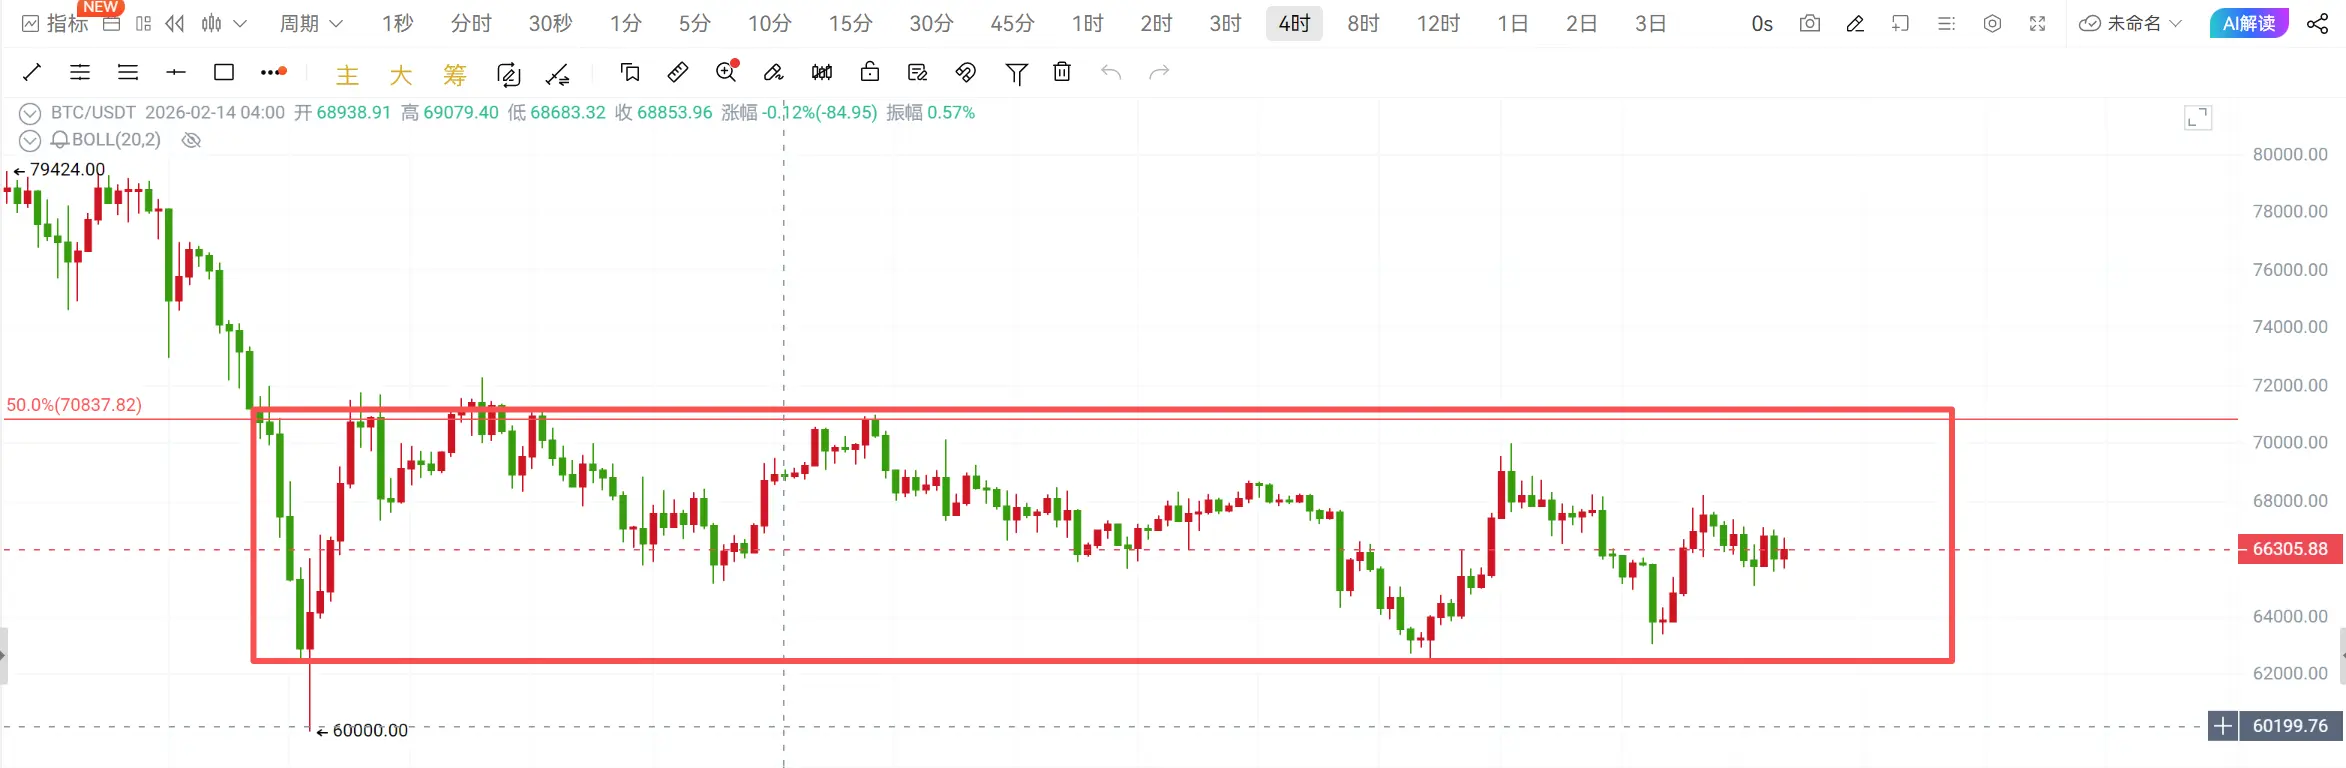
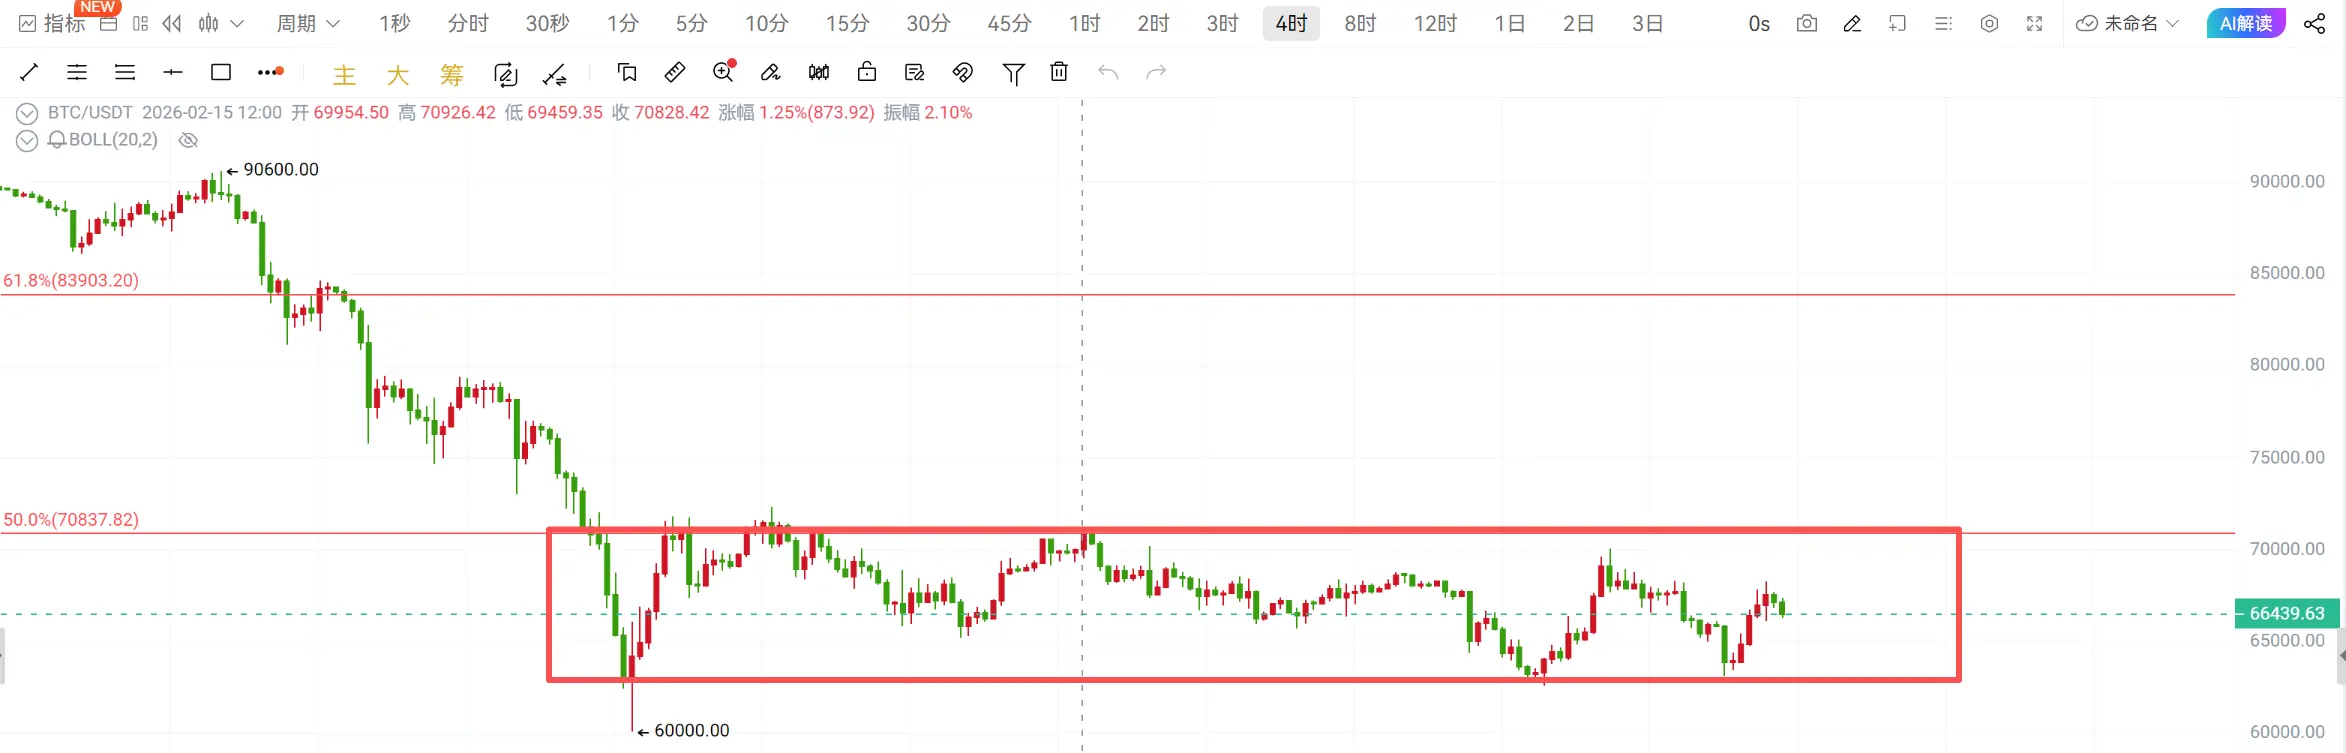
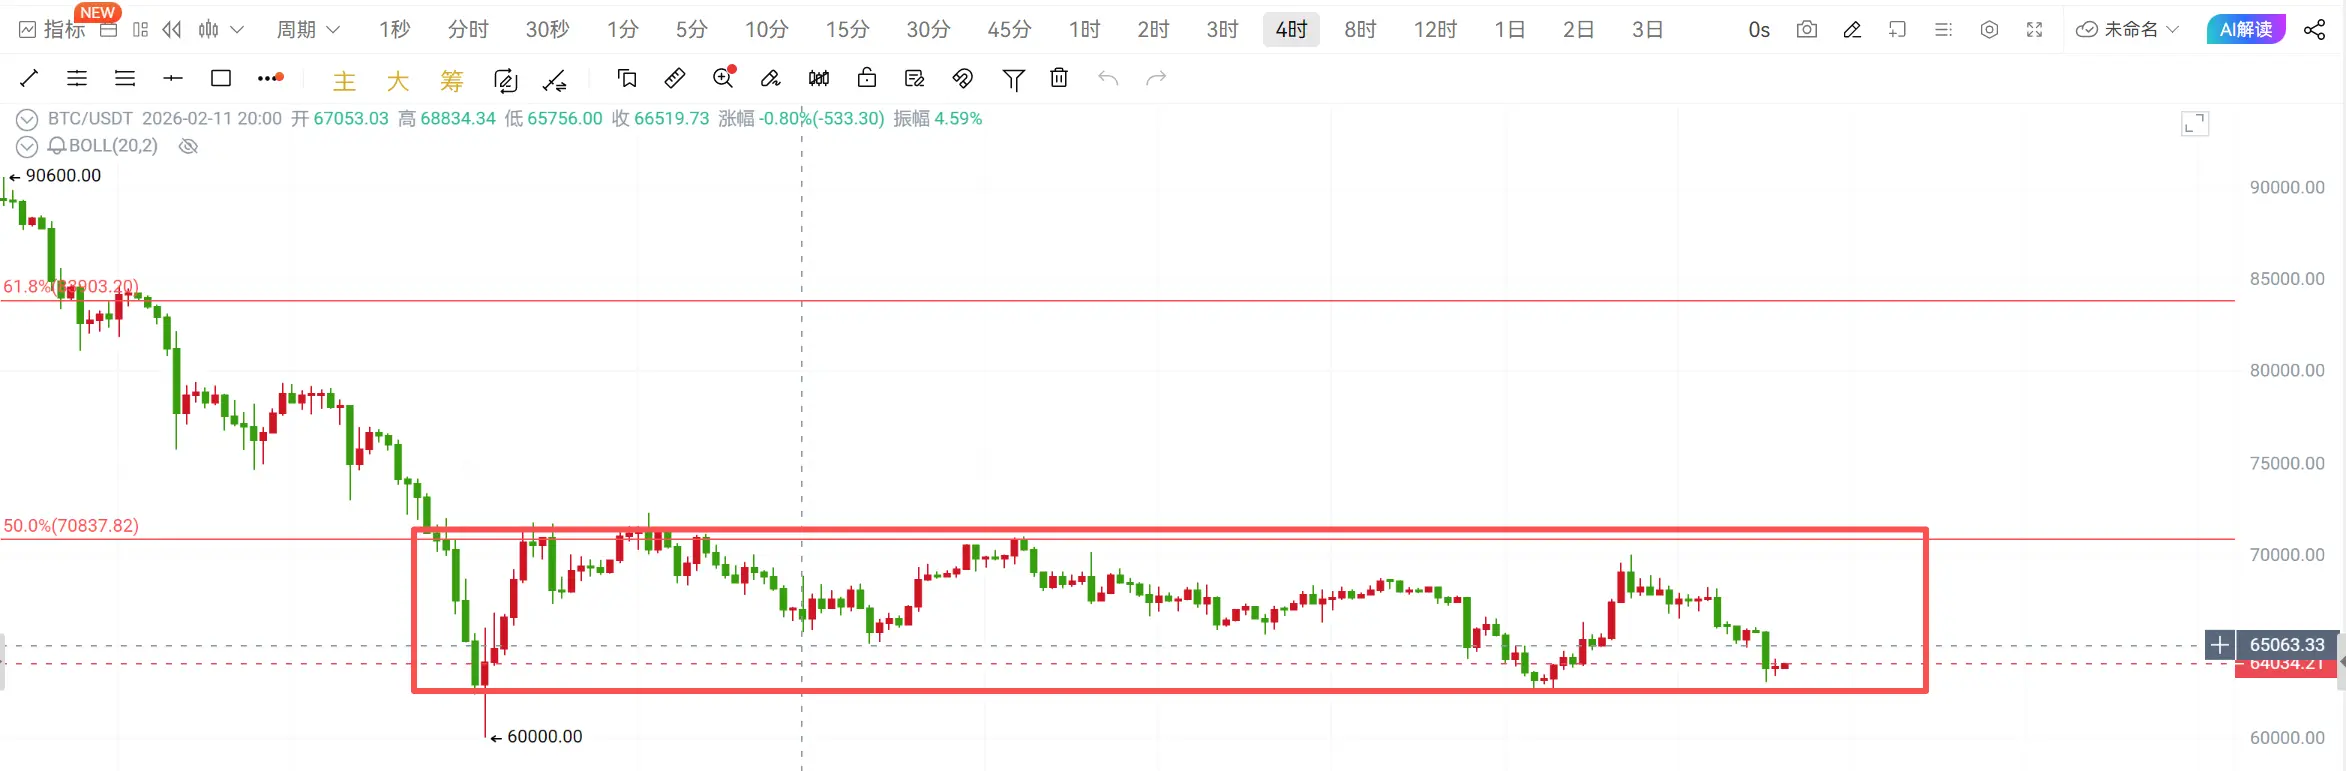
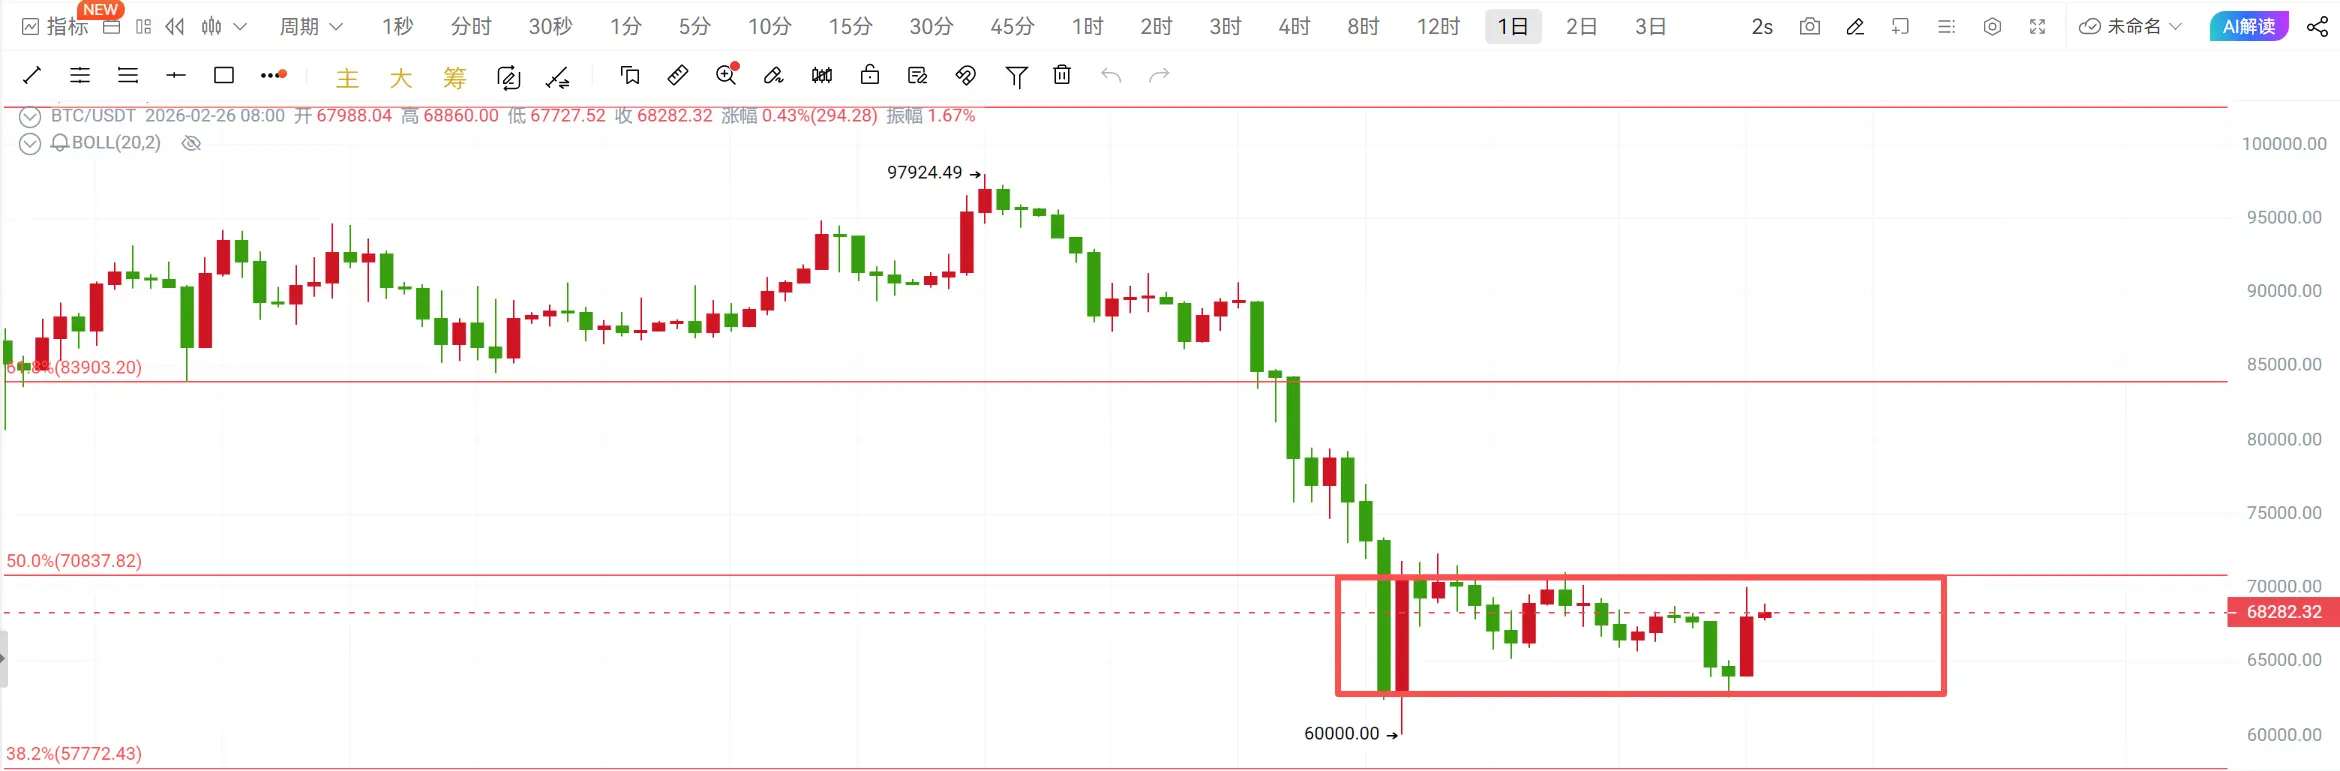
Current price Bitcoin 68,800-69,300 short, target 68,000-67,000, stop-loss above 70,000!
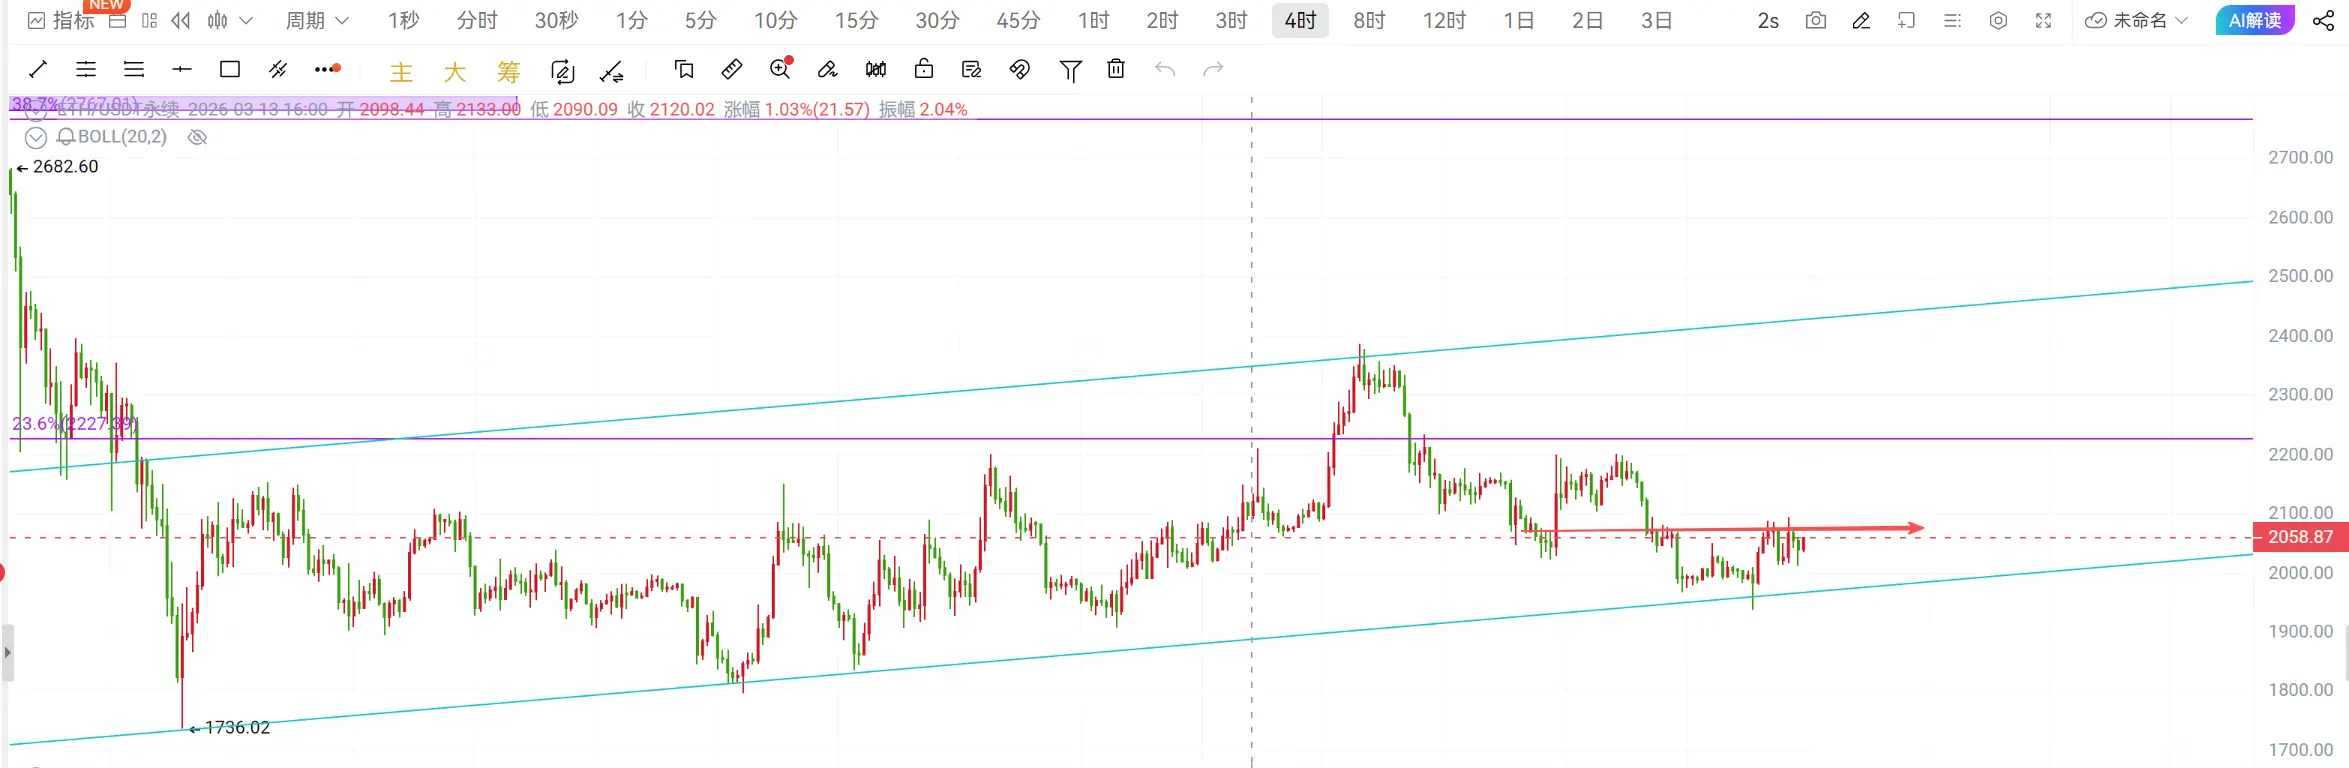
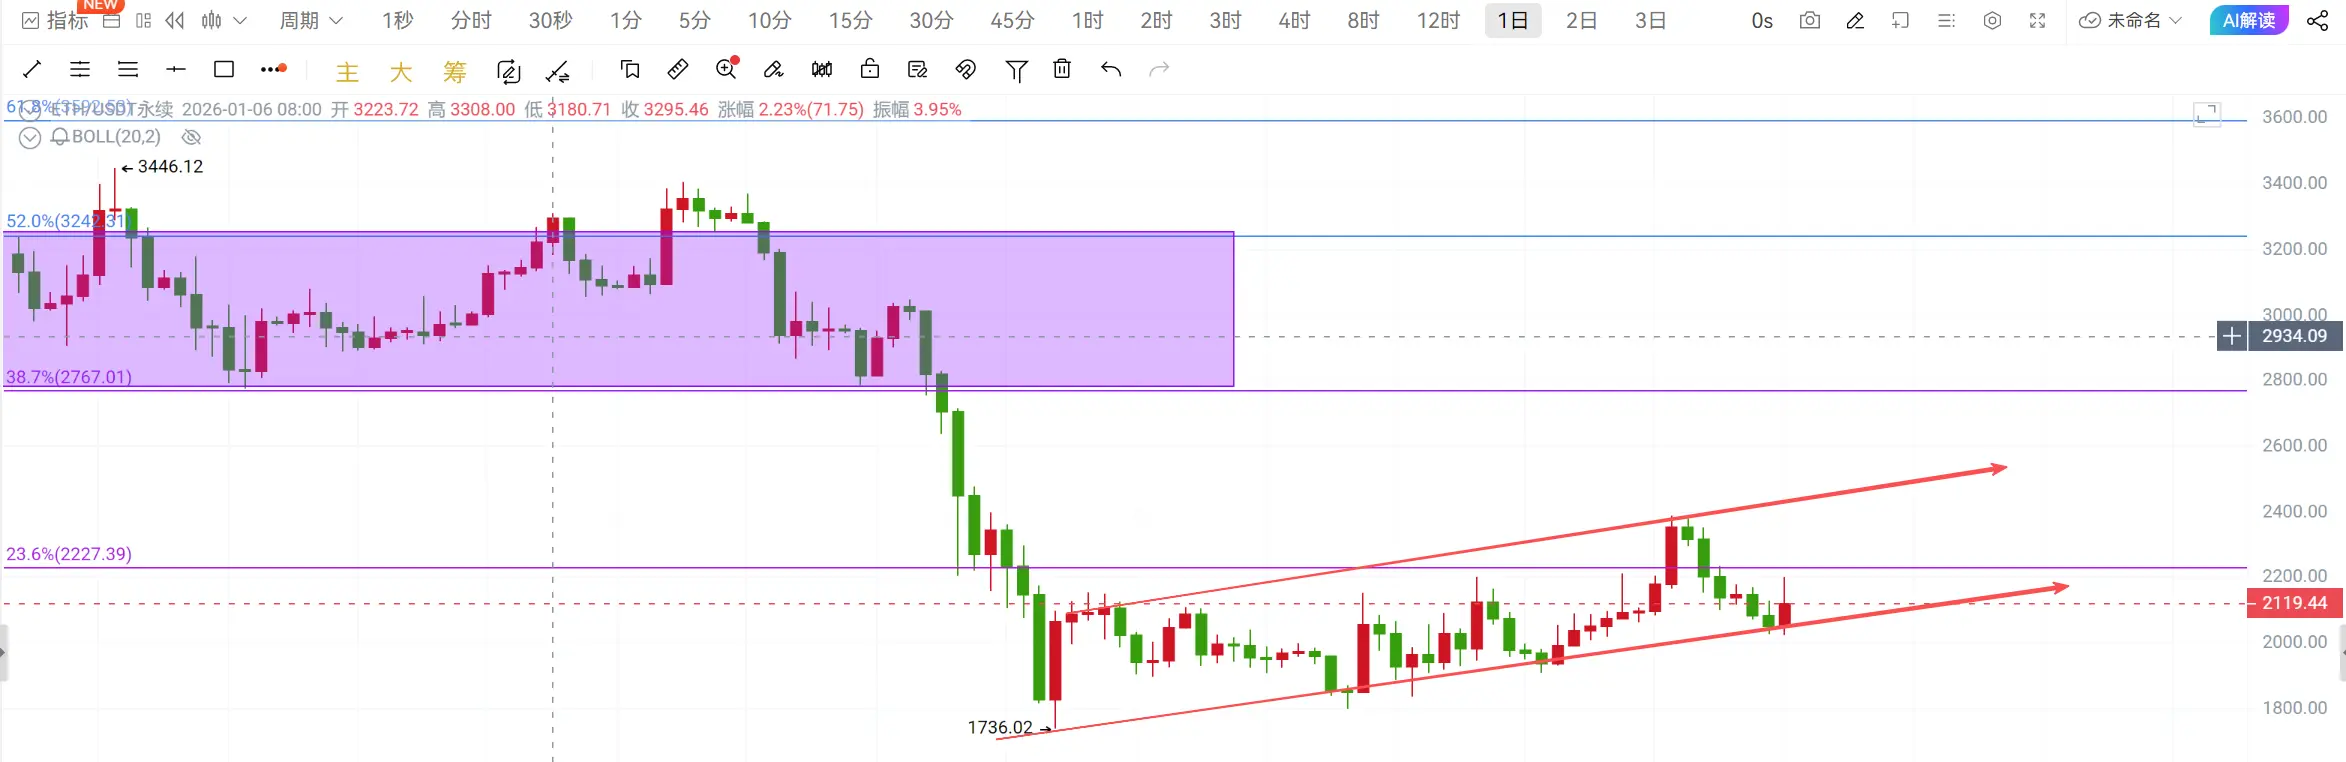
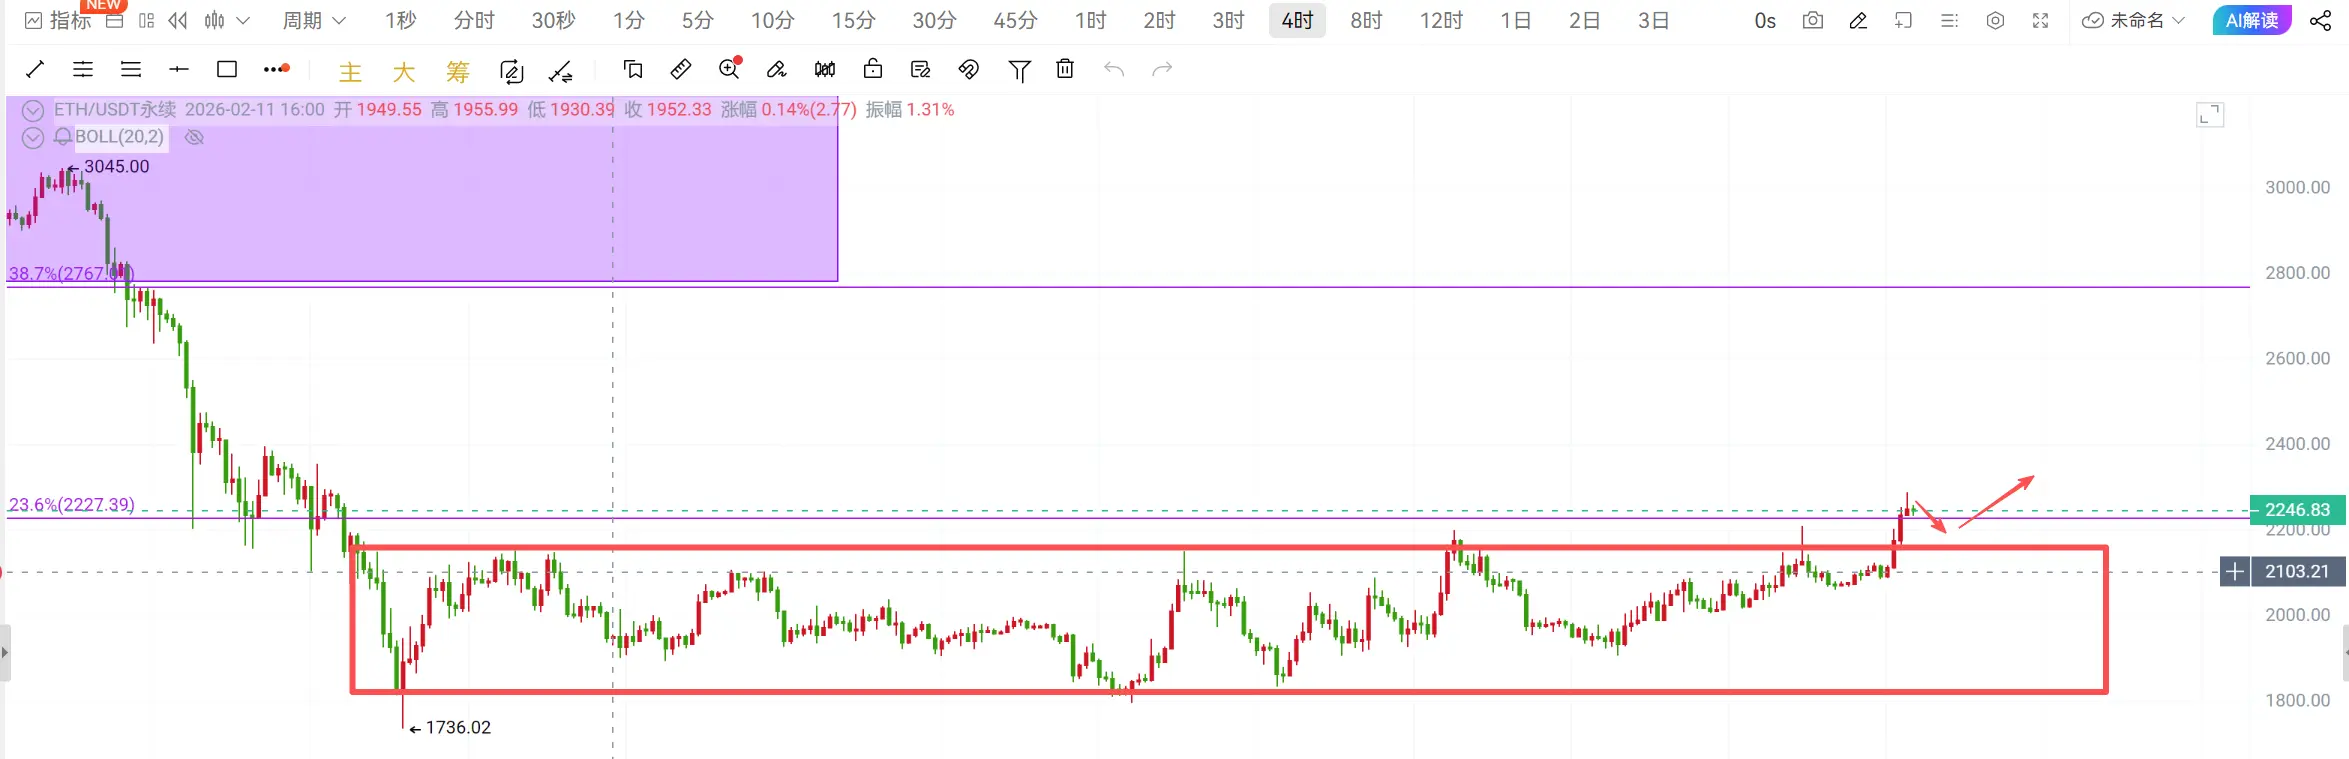
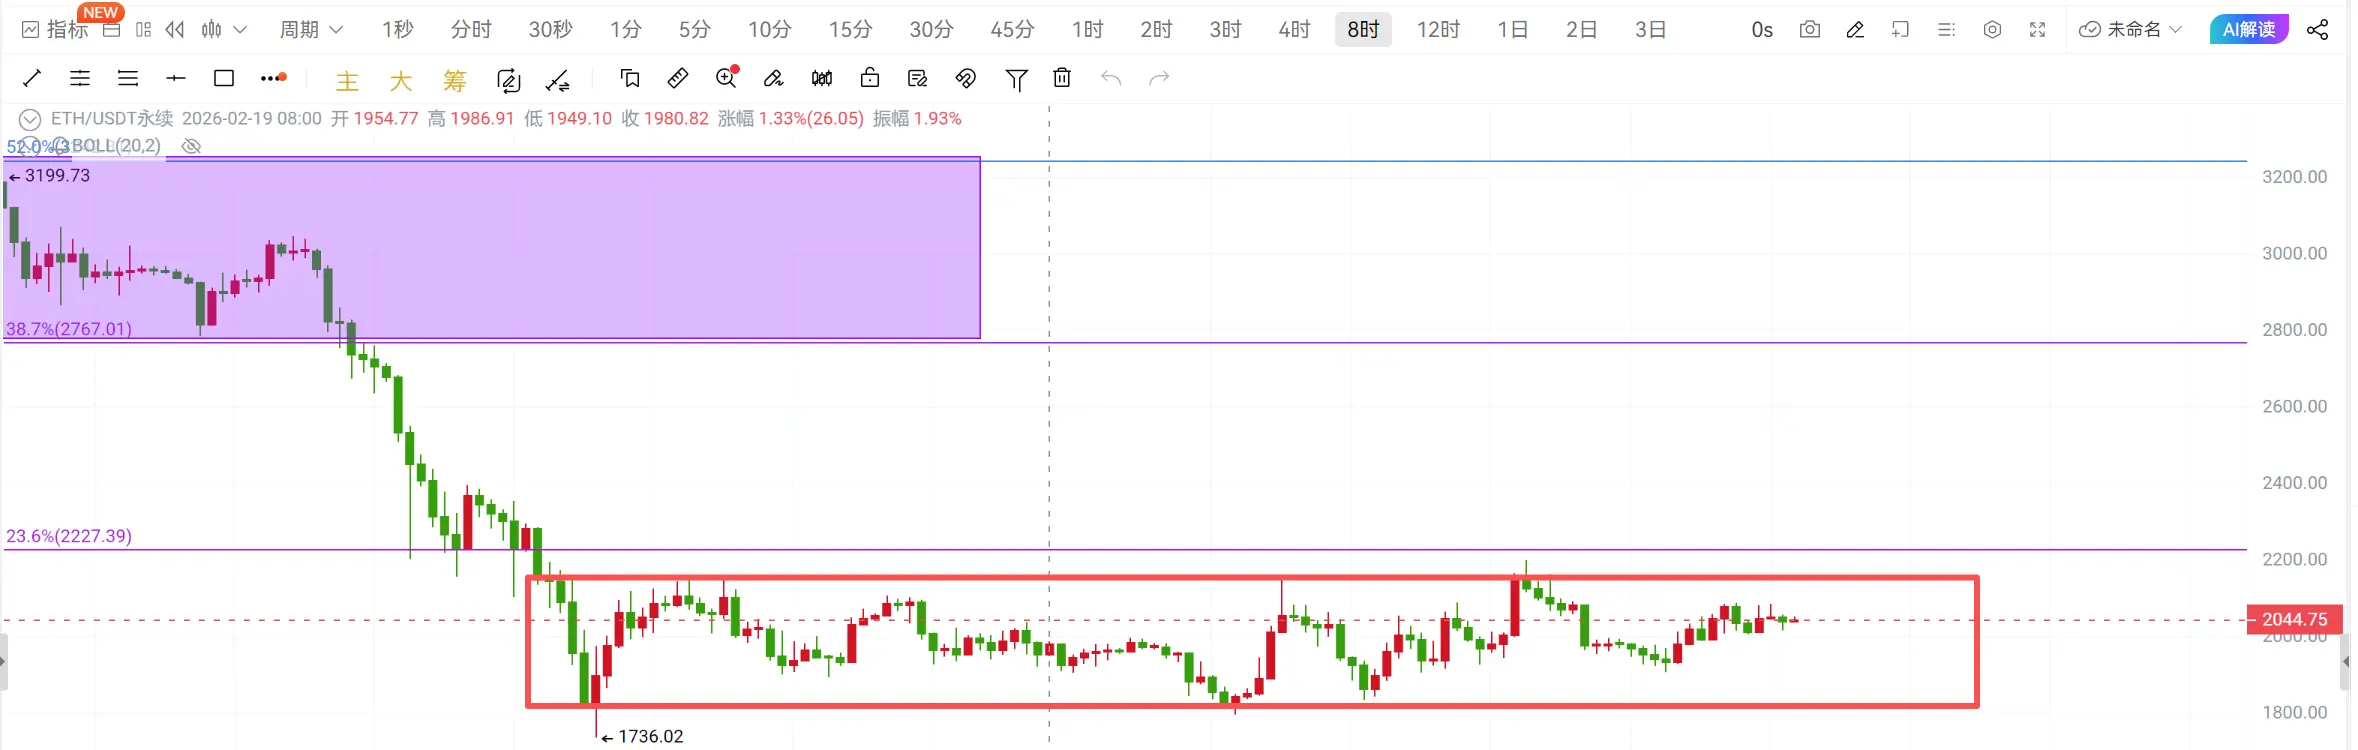
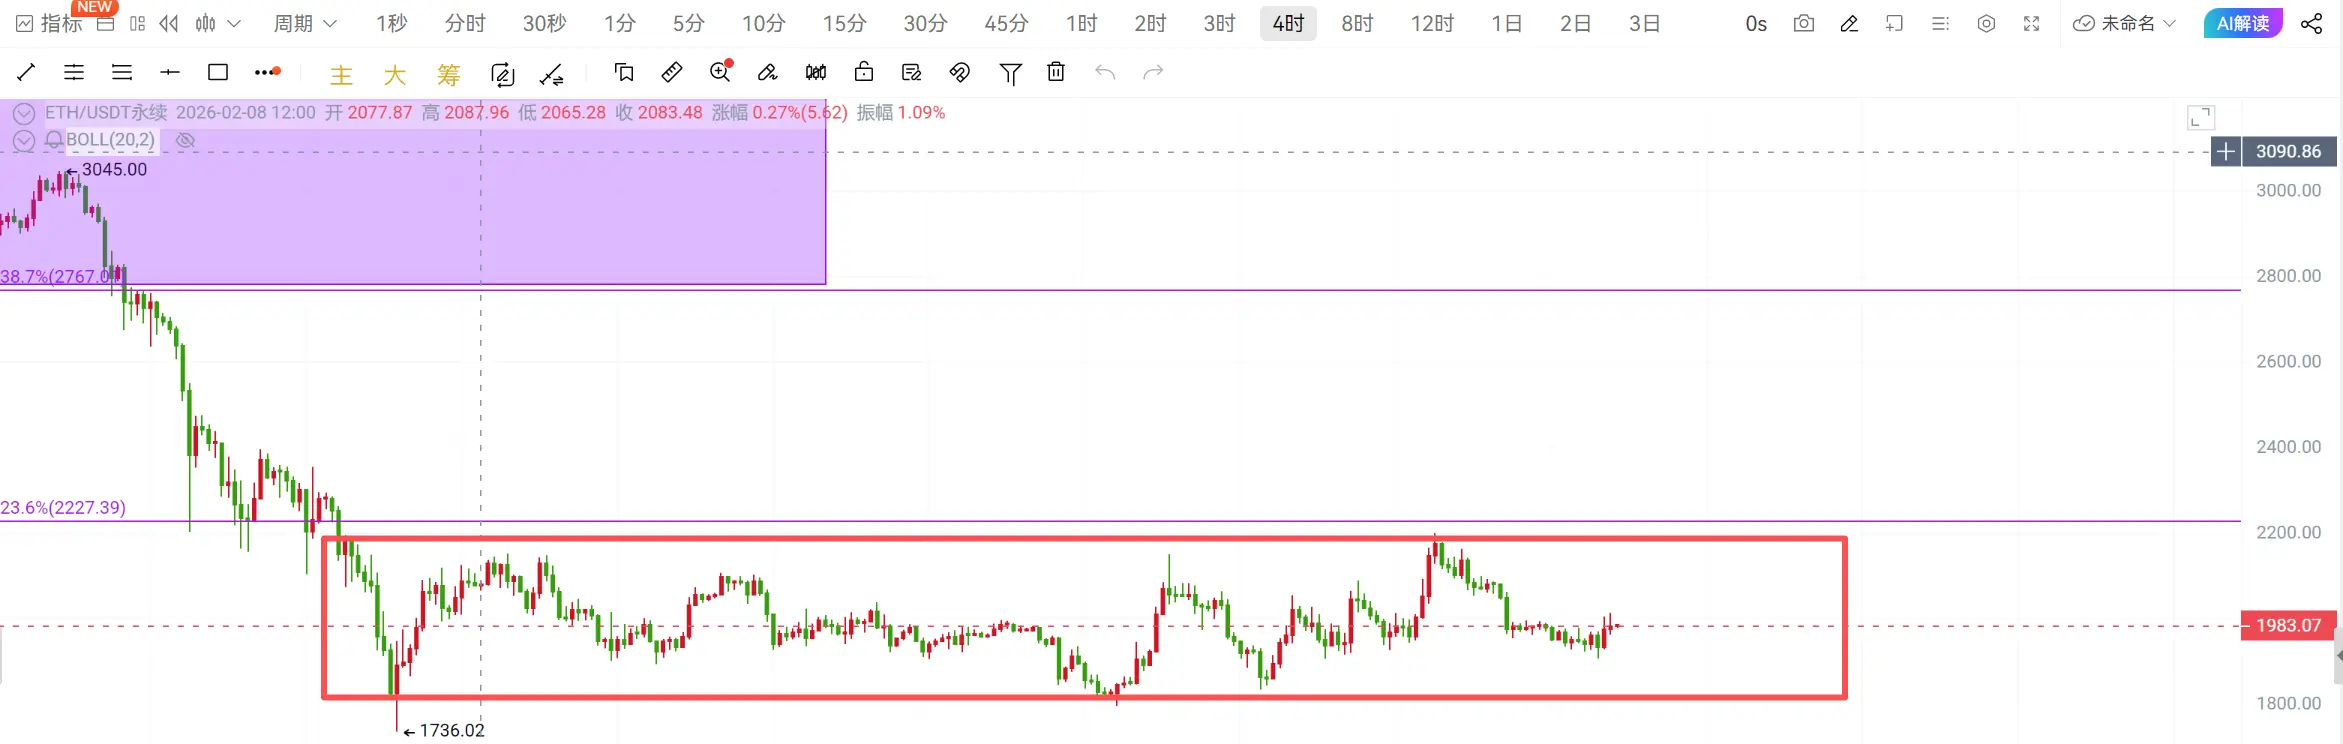
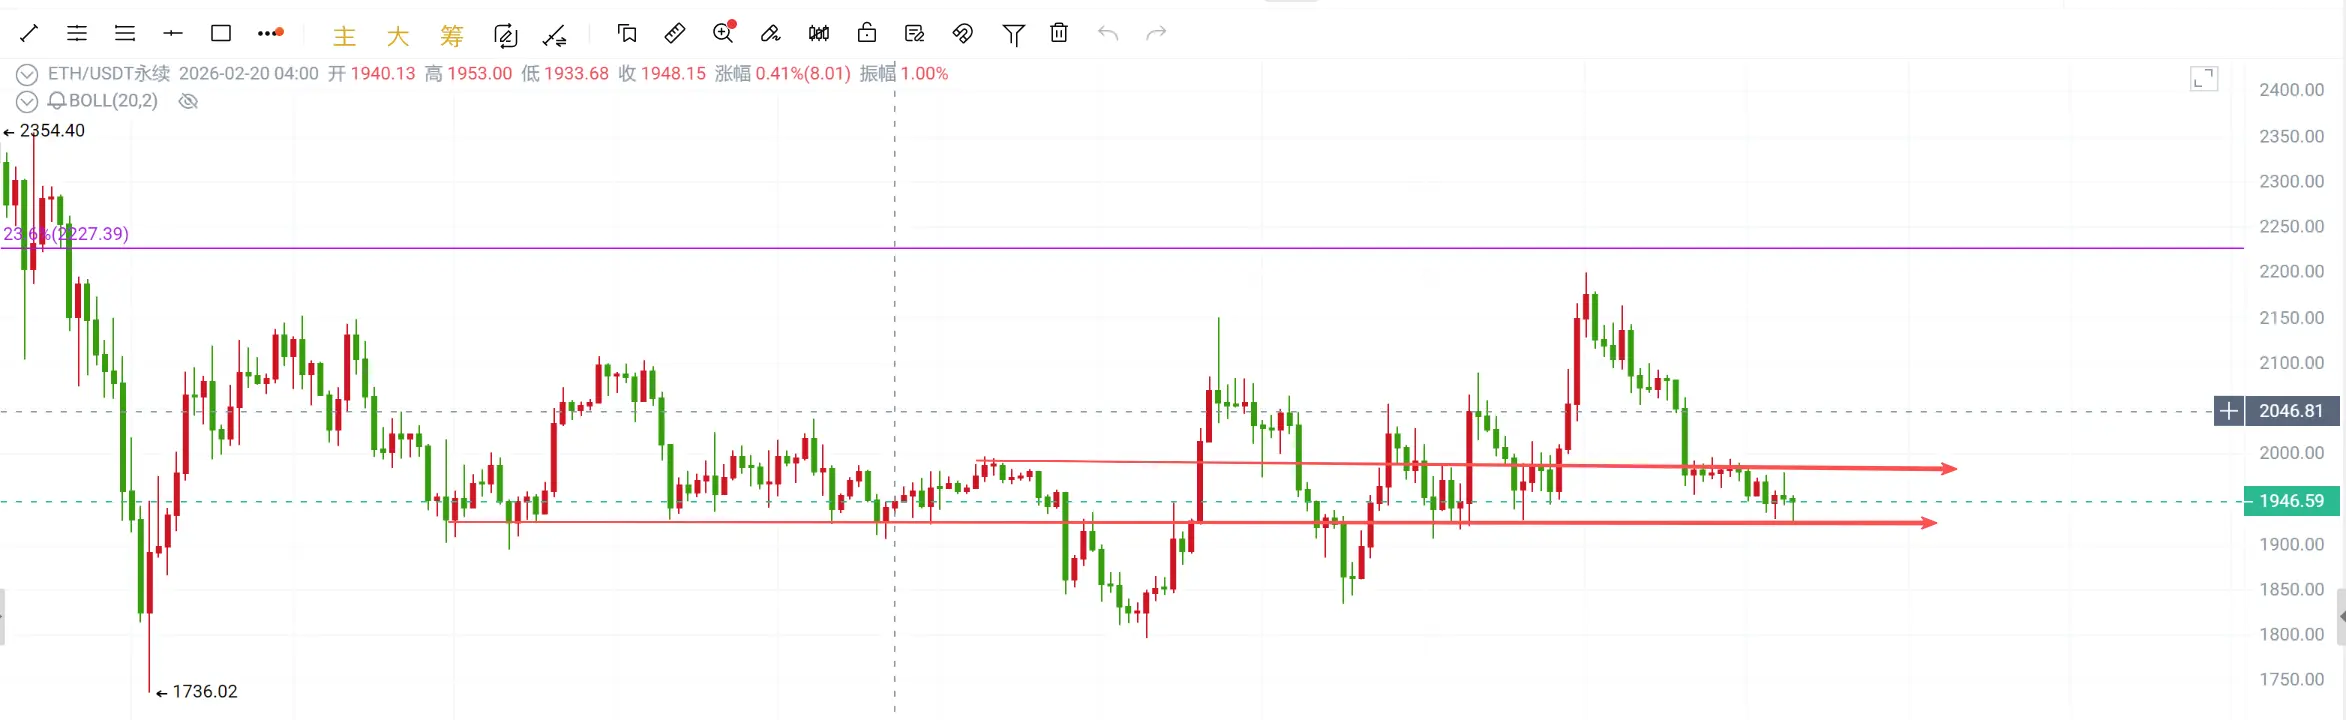
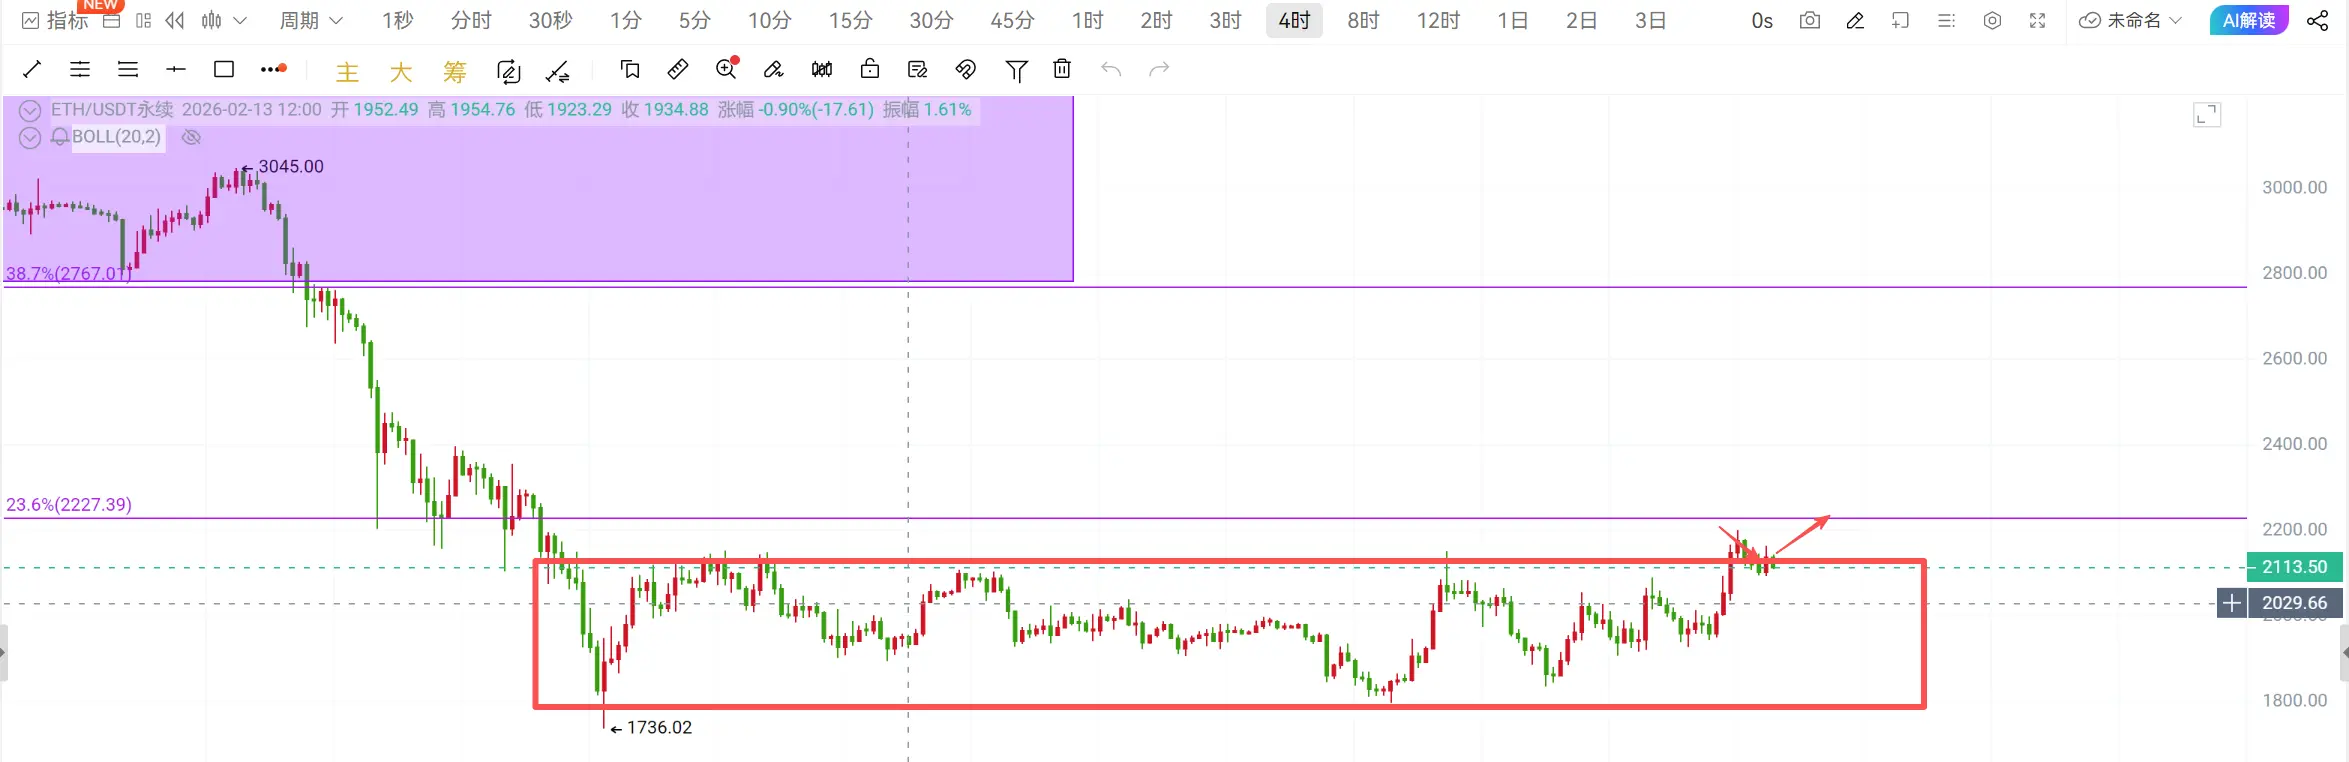
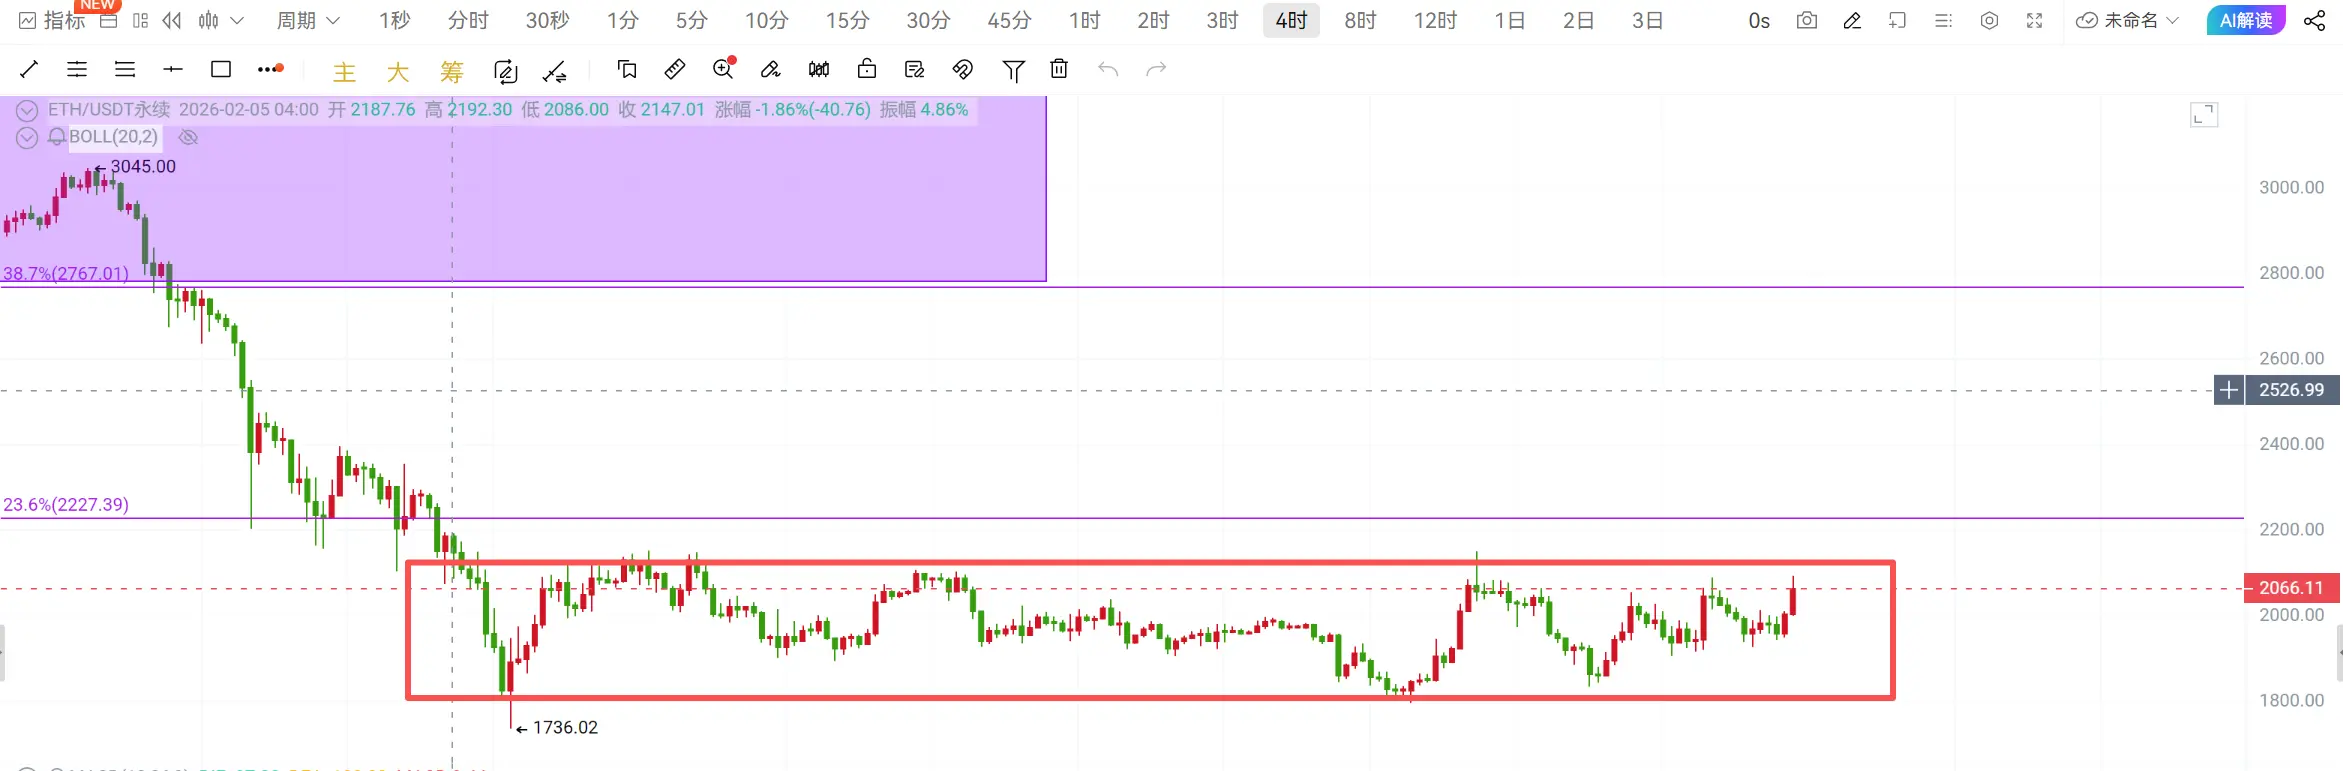
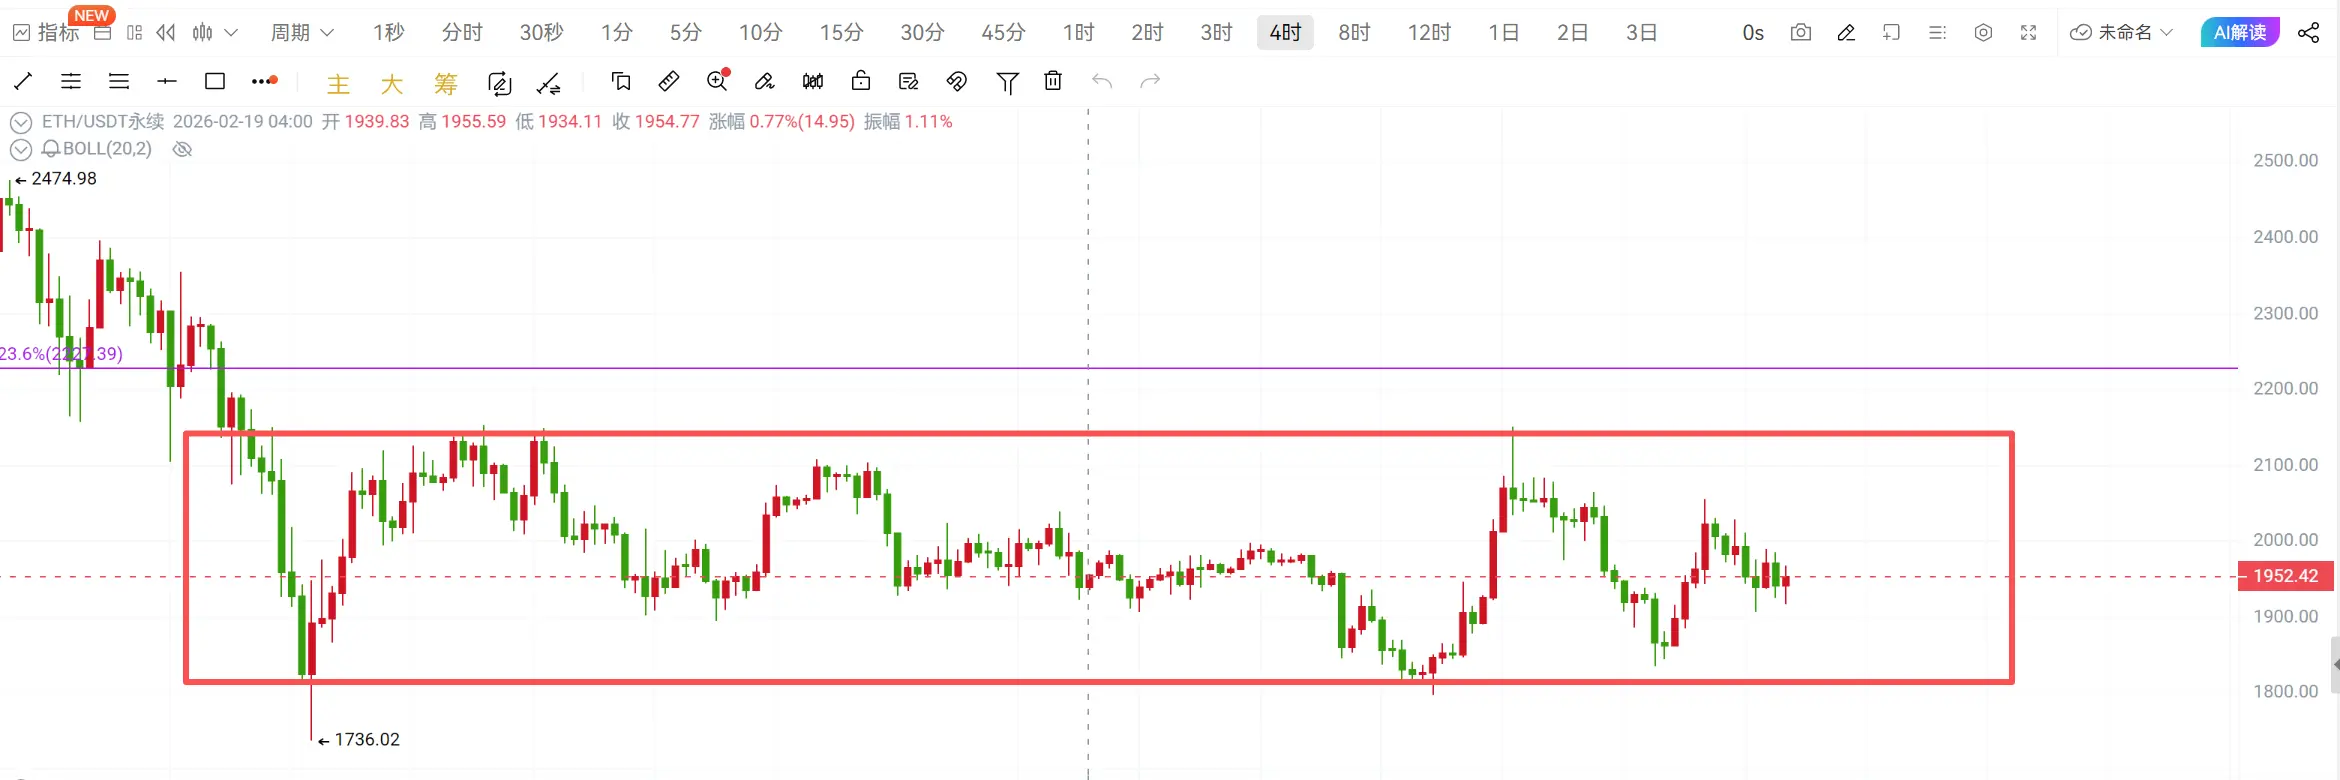
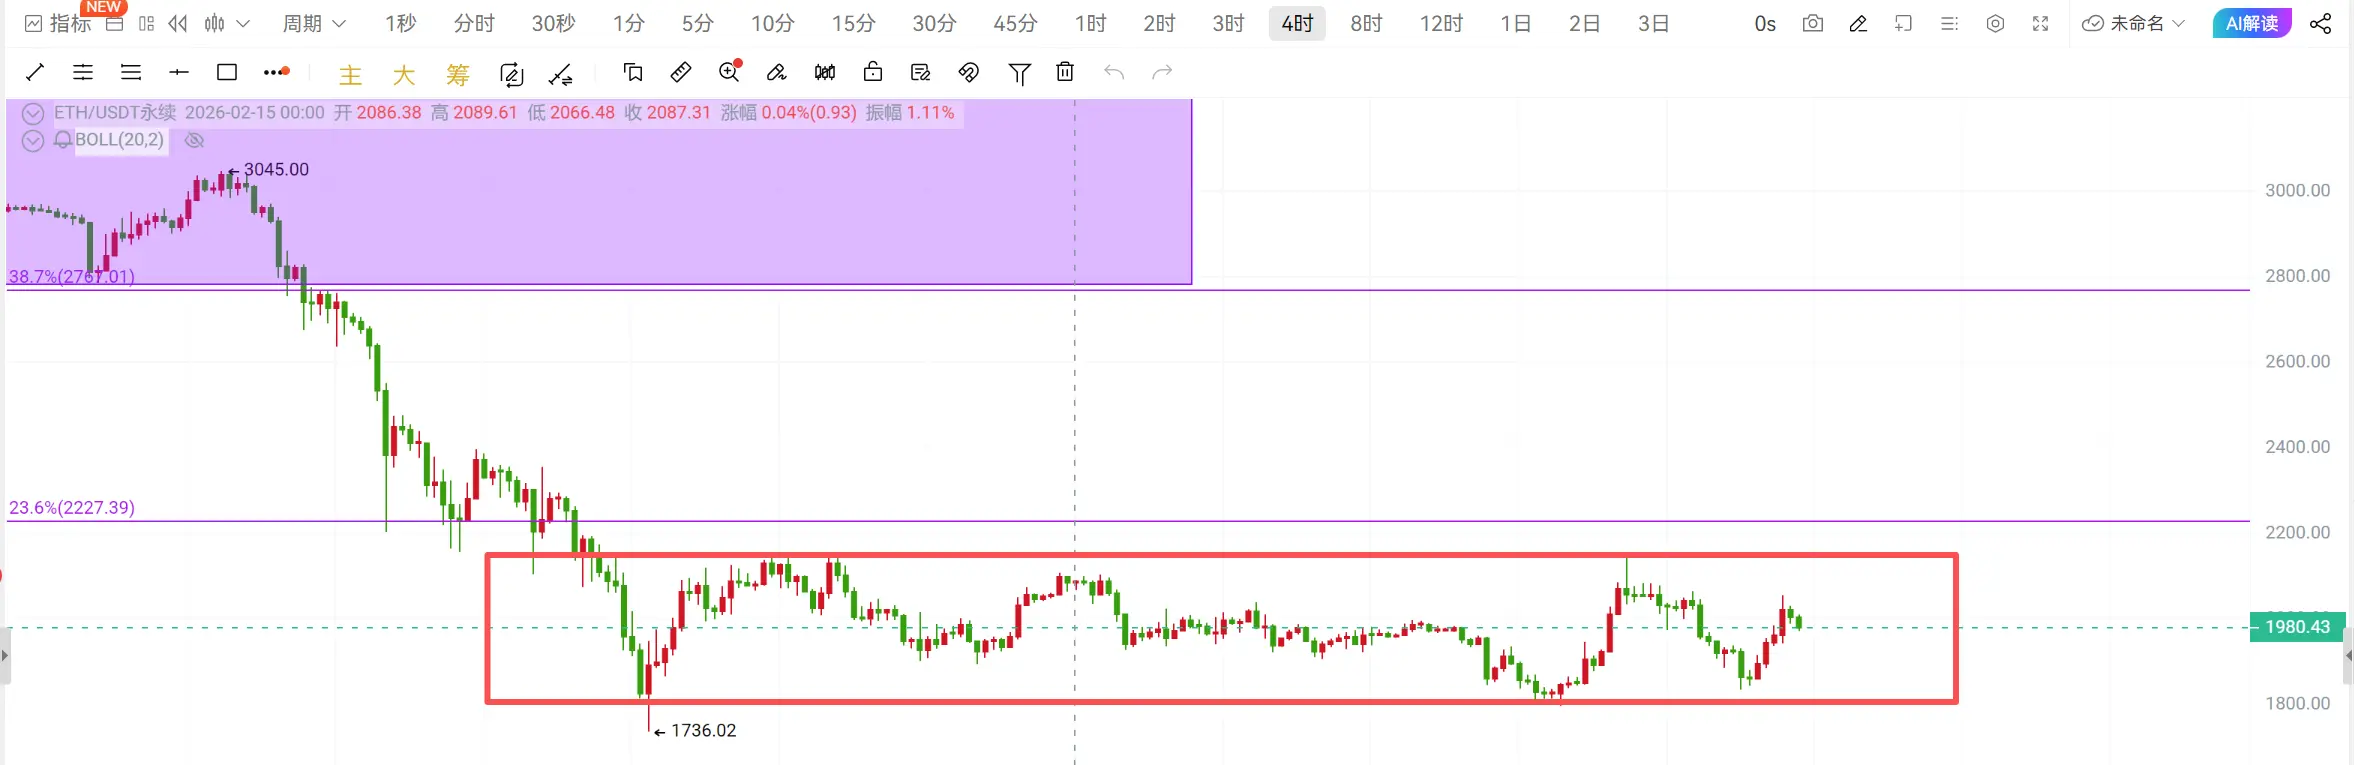
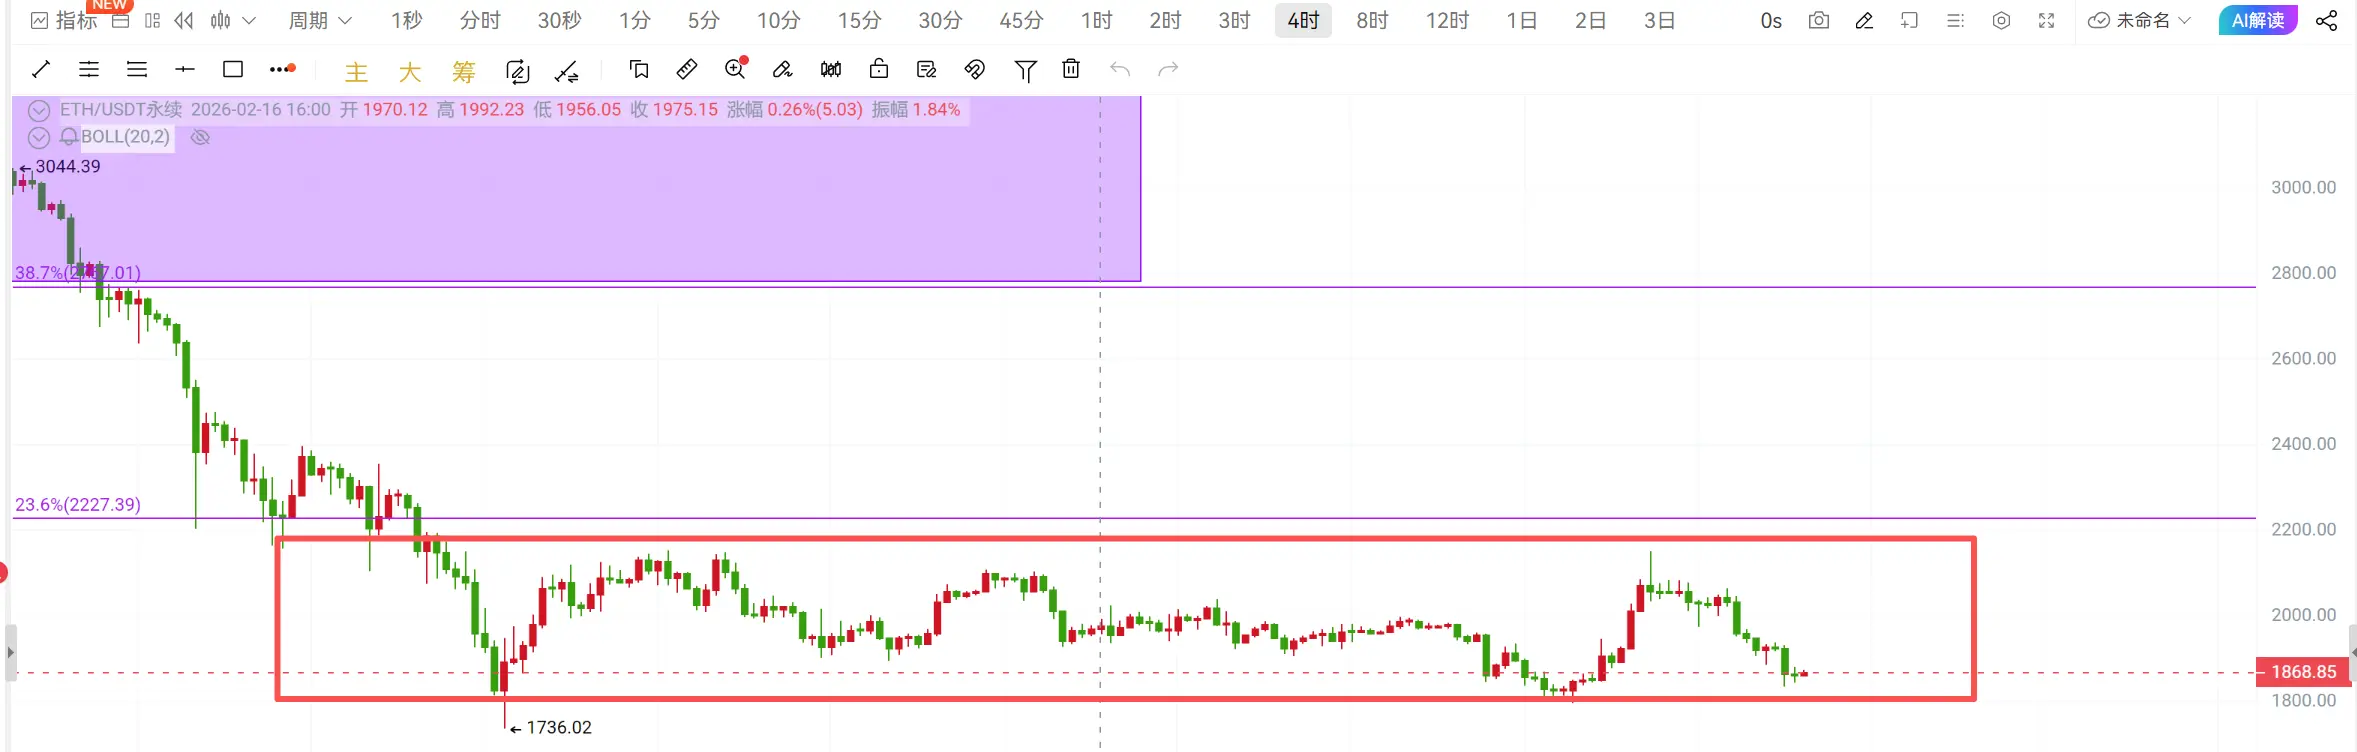
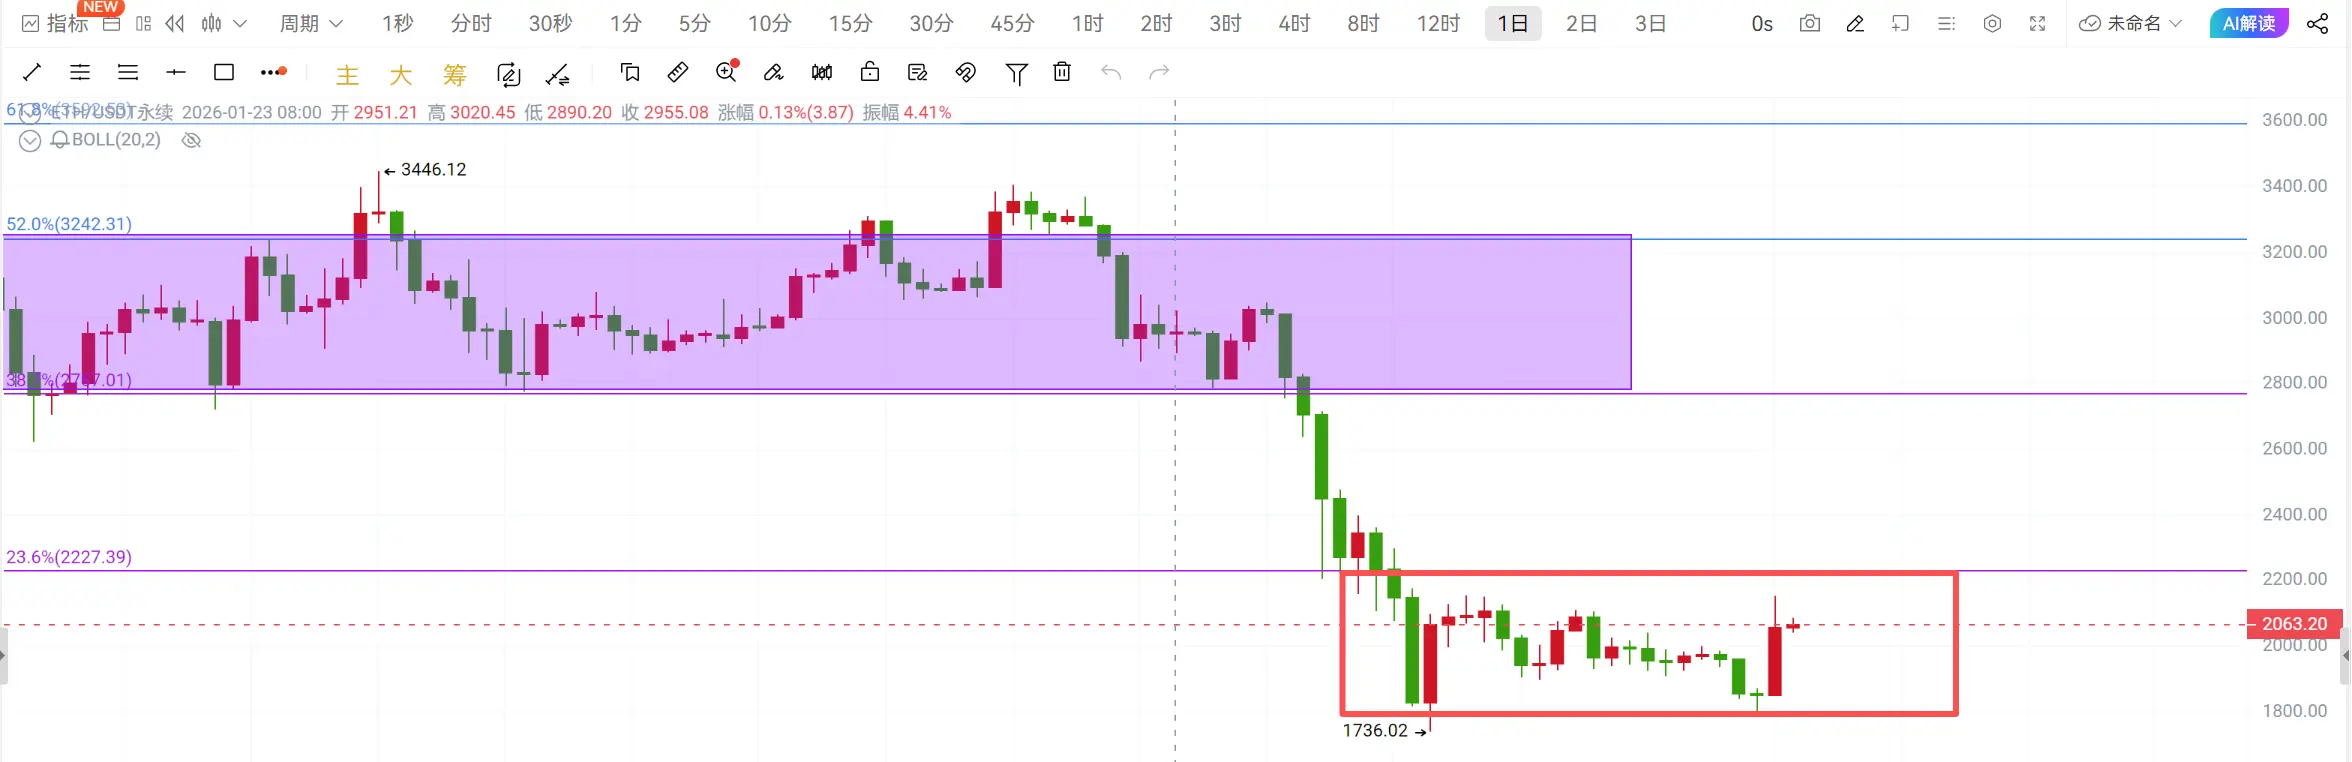
Current price Ethereum 2145-2165 short, target 2100-2050, stop-loss above 2190!
Strategies are time-sensitive; please follow real-time guidance! #四月行情预测 #加密市场普遍上涨 #金银同步走强
Current price Bitcoin 68,800-69,300 short, target 68,000-67,000, stop-loss above 70,000!
Current price Ethereum 2145-2165 short, target 2100-2050, stop-loss above 2190!
Strategies are time-sensitive; please follow real-time guidance! #四月行情预测 #加密市场普遍上涨 #金银同步走强