#Gate金手指
The Golden Finger Moment — Extended Version
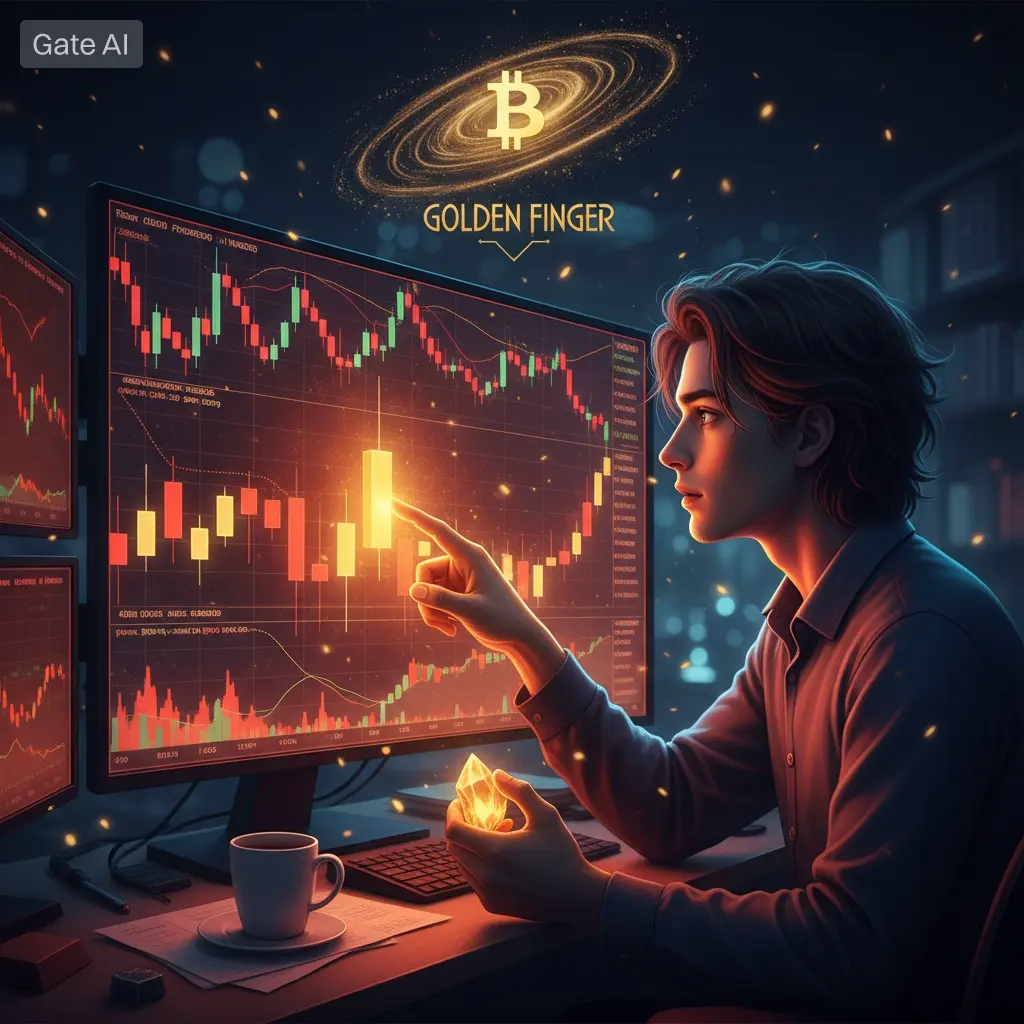
I woke up at 3 AM again. The world outside my window was silent, but my mind was noisy. The chart was red. My portfolio was bleeding like an open wound. Another late-night trading session gone wrong. Another cup of cold coffee sitting next to my glowing screen, mocking me with its indifference.
And then I imagined it — what if I had the Golden Finger?
Not some vague wishful thinking. The real thing. The King Midas kind, where every touch transforms the ordinary into the extraordinary. Where the mundane becomes legendary, where risk becomes reward.
I reached for my laptop. The keys shimmered as they turned gold beneath my fingers. My screen followed. And somehow, impossibly, magically, the red candles of my chart began to flip. Every wick, every dip, every loss I had ever endured, every panic-sell, every trembling moment became a golden bar stacking higher and higher.
I reached for my coffee cup. Gold. Cold, yes. But pure, unshakable gold.
I looked at my portfolio. Green. Glowing. Golden. The numbers weren’t just digits — they were a story, a testament to patience, research, and resilience.
That’s the thing about crypto that nobody tells you at first. It’s not just about profit. It’s about transformation. About feeling something ordinary turn extraordinary in your hands. About holding through storms when everyone else is running for the exit. About believing in a coin nobody else does, and then witnessing the miracle of movement.
That is Golden Finger energy.
King Midas had no choice. Everything he touched became gold — whether he wanted it or not. In crypto, we choose. We research, we strategize, we hold, we risk, and when the timing is right, we touch. We create our own magic.
My Golden Finger moment? I would turn every doubt I’ve ever had into gold. Every skeptic who said crypto was dead. Every red week that made me consider quitting. Every sleepless night I almost closed positions in panic. Every fear, every hesitation, every regret — pure gold in hindsight.
Because those who keep touching, keep building, keep believing — they are the ones who end up holding more than just assets. They hold confidence, wisdom, patience, and yes, real tangible rewards that outshine even the hardest lessons.
Imagine it. What would YOU turn into gold? The charts that scare you? The keyboard that types your every trade? The coffee that fuels your late nights? The doubt that whispers you’re not ready?
Touch it. Own it. Transform it. This is your Golden Finger moment.
Because in the end, crypto is more than numbers. It’s magic. It’s mastery. It’s turning what’s ordinary into something legendary.
And if you’ve got the courage, the vision, and the patience — your moment is waiting.
#Gate金手指
The Golden Finger Moment — Extended Version
I woke up at 3 AM again. The world outside my window was silent, but my mind was noisy. The chart was red. My portfolio was bleeding like an open wound. Another late-night trading session gone wrong. Another cup of cold coffee sitting next to my glowing screen, mocking me with its indifference.
And then I imagined it — what if I had the Golden Finger?
Not some vague wishful thinking. The real thing. The King Midas kind, where every touch transforms the ordinary into the extraordinary. Where the mundane becomes legendary, where risk becomes reward.
I reached for my laptop. The keys shimmered as they turned gold beneath my fingers. My screen followed. And somehow, impossibly, magically, the red candles of my chart began to flip. Every wick, every dip, every loss I had ever endured, every panic-sell, every trembling moment became a golden bar stacking higher and higher.
I reached for my coffee cup. Gold. Cold, yes. But pure, unshakable gold.
I looked at my portfolio. Green. Glowing. Golden. The numbers weren’t just digits — they were a story, a testament to patience, research, and resilience.
That’s the thing about crypto that nobody tells you at first. It’s not just about profit. It’s about transformation. About feeling something ordinary turn extraordinary in your hands. About holding through storms when everyone else is running for the exit. About believing in a coin nobody else does, and then witnessing the miracle of movement.
That is Golden Finger energy.
King Midas had no choice. Everything he touched became gold — whether he wanted it or not. In crypto, we choose. We research, we strategize, we hold, we risk, and when the timing is right, we touch. We create our own magic.
My Golden Finger moment? I would turn every doubt I’ve ever had into gold. Every skeptic who said crypto was dead. Every red week that made me consider quitting. Every sleepless night I almost closed positions in panic. Every fear, every hesitation, every regret — pure gold in hindsight.
Because those who keep touching, keep building, keep believing — they are the ones who end up holding more than just assets. They hold confidence, wisdom, patience, and yes, real tangible rewards that outshine even the hardest lessons.
Imagine it. What would YOU turn into gold? The charts that scare you? The keyboard that types your every trade? The coffee that fuels your late nights? The doubt that whispers you’re not ready?
Touch it. Own it. Transform it. This is your Golden Finger moment.
Because in the end, crypto is more than numbers. It’s magic. It’s mastery. It’s turning what’s ordinary into something legendary.
And if you’ve got the courage, the vision, and the patience — your moment is waiting.
#Gate金手指